Performance of a Vertical Axis Wind Turbine under Accelerating
and Decelerating Flows
Atif Shahzad, Taimoor Asim*, Rakesh Mishra, Achilleos Paris
School of Computing & Engineering, University of Huddersfield, UK (HD1 3DH)
* Corresponding author. Tel.: +0044-1484-472727. E-mail address: [email protected]
Abstract
Rapid increase in global energy requirements has resulted in considerable attention towards energy generation from the renewable energy sources. In order to meet renewable energy targets, harnessing energy from all available resources including those from urban environment is required. Vertical Axis Wind Turbines (VAWTs) are seen as a potential way of utilising urban energy sources. Most of the research on the wind turbines constitutes condition monitoring and performance optimisation of VAWTs under a constant velocity of air where the transient effects have not been accounted. The inconsistent behaviour of the wind may change the nature of the flow field around the VAWT which could decrease its life cycle. This study is an attempt to use Computational Fluid Dynamic’s techniques to study and analyse the performance of a wind turbine under accelerating and decelerating air inlet velocity. The performance of a VAWT is monitored under an accelerated and decelerated gust of the value 1.09m/s² characterised by change in velocity from 4m/sec to 10m/sec. The instantaneous torque output varies significantly when a gust of air is applied to the turbine. Furthermore the torque outputs during accelerating and decelerating flows vary, highlighting the effect of transient phenomena. This abrupt change in the instantaneous torque output of the turbine may give rise to highly transient loads on the turbine’s structure which may induce heavy stresses on the turbine leading to structural failure. It has been shown that CFD can be used as an effective tool to predict the performance outputs of a VAWT under varying flow conditions.
Keywords: Vertical Axis Wind Turbine, Computational Fluid Dynamics, Tip Speed Ratio, Power Output
1. Introduction
Renewable energy plays a significant role in overcoming the increased energy demand. Considerable amount of research has been carried out in renewable energy sector, mainly wind energy. Wind energy has a great potential to overcome excessive dependence on fossil fuels to meet energy demand. The wind turbine systems can be classified as the horizontal axis wind turbine (HAWT) and the vertical axis wind turbine (VAWT) based upon the direction of the axis of rotation. When the wind stream is parallel to the rotational axis of turbine rotor, it is referred to as HAWT. Similarly, when the wind direction is perpendicular to the rotational axis of turbine rotor, it is referred to as VAWT. The performance capabilities of the wind turbines depend greatly on the torque output which further depends upon the torque generating capability of the rotor.
HAWTs are more efficient as compared to VAWTs but require good quality wind energy. In urban areas where wind is in-consistent and highly fluctuating, VAWT is more beneficial due to its low starting torque characteristics as well as other advantages like being in-expensive to build and of simple design [3, 5]. The important performance parameters of VAWTs, as mentioned by Colley et al [1] are the tip speed ratio (TSR) and the torque output. TSR is the ratio between the rotational speed of the tip of the blade and the actual velocity of the wind.
Wind environment and the flow field around the rotor are directly related to its torque generating capabilities. However wind continuously changes its magnitude and direction. The transient effect of the approaching wind on the performance output of the wind turbine is an important measure in the design of the wind turbines and plays a major role in reducing turbine structure fatigue life. Under transient conditions of the inlet velocity, the excitation force experienced by the blades varies by magnitude, which may cause vibratory response. Furthermore increased levels of accelerated inlet velocity of air may result in amplified mechanical stresses. Hence it is necessary for the design load calculations for wind turbines to determine the fatigue loads as well as extreme loads. VAWT would behave differently under different wind conditions and the flow field around the rotor is directly related to its torque generating capabilities. It can be argued that, due to the location, different masses and length scales of turbines, small turbines experience different impact of wider range of transient wind conditions as compared to the large turbines [7]. Sun et al [6] used CFD software Fluent to simulate an unsteady flow around the horizontal axis wind turbine and compared power co-efficient, which were in good agreement with the experimental data. The scope of this study is to investigate the transient response of the turbine under accelerating and decelerating wind flows using CFD
2. Numerical Modeling
The performance output of a VAWT has been numerically analysed using commercial CFD package. This VAWT has a diameter of 2m and a height of 1m. The geometry of the VAWT features 12 equally spaced rotor and stator blades respectively. Various flow conditions have been generated in order to analyse the effect of gust of air on the overall performance output of the VAWT. The equations have been solved using iterative method such that each time step corresponds to 3º rotation of the rotor blades.
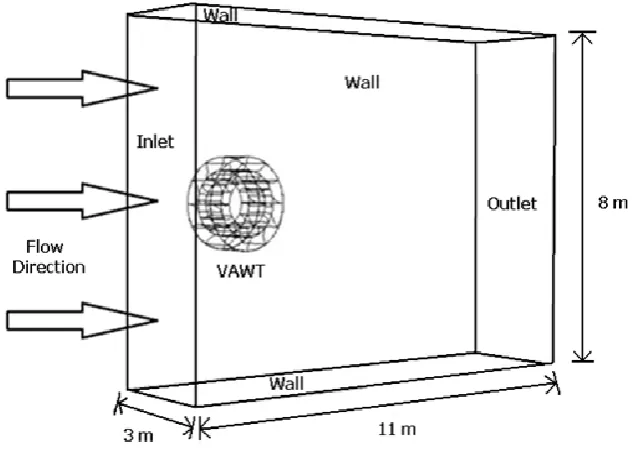
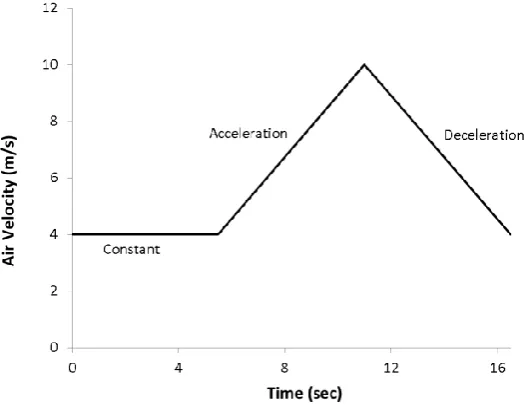
[image:2.595.133.450.511.737.2]The computational model of this turbine consists of 12 rotor and stator blades each as shown in figure 1. The realizable k-ε solver [2] has been used in the following simulations due to its stability during computations and accuracy over a wide range of operating conditions. The sliding mesh technique is used to simulate the rotation of the blades at an angular velocity of 1.143rad/sec [4]. Second order spatial and temporal schemes have been specified with SIMPLE pressure-velocity coupling in the solver. The influx of air into the flow domain is governed by the velocity inlet boundary at which a uniform 4m/s flow condition is used in the X-direction in the first condition, whereas to incorporate the gust conditions, firstly, air inlet velocity is increased from 4m/s to 10m/s during one complete rotation of the rotor blades and then air inlet velocity is decreased from 10m/s to 4m/s, both at a rate of 1.09m/s², by incorporating user defined functions, as shown in table 1 and figure 2. Angular velocity of the blades is kept constant during all these three revolutions.
Table 1. Different Inlet Velocity Conditions.
Condition Inlet velocity
Condition 1 Constant 4m/s
Condition 2 Accelerating 4m/s – 10m/s
Condition 3 Decelerating 10m/s – 4m/s
[image:3.595.171.435.233.437.2]For the accuracy of the results, the solution needs to be statically steady. It has been observed that during the steady state, model is free from any non-uniformity from 3rd revolution onwards and hence the results are considered after the 3rd revolution only to get an initial converged condition for the transient simulation. During transient analysis, the number of iterations is increased to 100 to allow for convergence.
Fig. 2. Change in Inlet Air Velocity with respect to Time.
3. Results and Analysis
[image:3.595.76.534.568.740.2]3.1. Flow Field Analysis
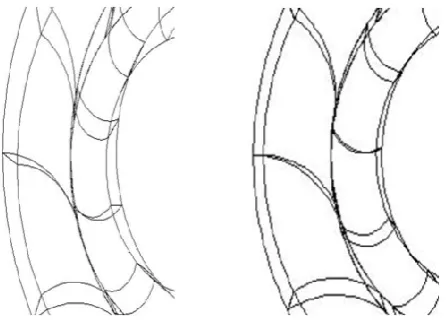
Figure 3 shows the velocity contours in the vicinity of the VAWT for both conditions 1 and 2. In this respect, flow field profile can be analysed.
(a) (b)
It can be seen that the magnitudes of velocity near the stator blades are very small, acknowledging the fact of no-slip boundary condition, however within the stator blade passage, the velocity magnitude represent high values. Furthermore the velocity values under the rotor blades, on the windward side of the turbine, are considerably high. On the rear of the turbine, the velocities are much smaller as compared to the front end. Furthermore, within the rotor blade passages and within the core of turbine, velocity distribution is non-uniform. It can be noted the velocity magnitude in case of accelerating condition is considerably high as compared to the normal condition. Furthermore, in accelerated condition, the nature of flow within the central core of the turbine has changed and the shift in the high velocity of jet from the centre towards the leeward side. This jet of air interacts with the rotor blades on the rear end and may affect the torque fluctuation.
The figure further reveals the velocity deficit in the wake of the turbine, which may have considerable impact on the downwind turbines when installed in wind farms. In order to further analyse the flow field, pressure contours are shown in figure 4, corresponding to normal and accelerated inlet velocity conditions.
[image:4.595.73.525.228.387.2](a) (b)
Fig. 4. Variations in the static pressure in the vicinity of the VAWT during inlet velocity (a) steady at 4m/s (b) transient at peak 10m/s.
Figure depicts highly non-uniform pressure distribution in the turbine region. Specific energy transfer regions corresponding to high pressures can be noted. This high pressure zone is considerably reduced in the wind turbine wake. This pressure drop is due to the energy transfer to the rotor blades. High pressure regions can be seen at the front end of the turbine while low pressures are observed at the rear end. It can be interpreted that the areas of high pressure correspond to low velocities and vice versa. It can further be observed that non-uniform pressure regions exist in the rotor passages and the rotor blades facing the direction of flow, which have maximum contribution to torque output. The high pressure regions above the rotor blades on windward side enhance the rotation of the turbine, thus contributing to increased torque output.
[image:4.595.121.377.579.766.2]3.2. Performance Characteristics
Figure 5 reveals the values of instantaneous torque output of the turbine during three complete revolutions of the turbine. The angular velocity of the turbine rotor blades is set at a constant value of 1.143rad/s.
During the first revolution i.e. 0-360 degrees, the turbine is running at constant inlet velocity of air at 4m/s and hence the tip speed ratio is constant at a value of 0.2. The torque output in this case has a continuous trend of peaks and valleys. This signature of the torque output corresponds to the angular position of each rotor blade. The peaks are formed when the rotor blade is in line with the stator blade, forming large uniform passages for the flow of air. Whereas valleys correspond to the non-uniform passages in the rotor section due to position of the blade.
[image:5.595.166.433.229.414.2]The next revolution of the rotor blades takes place with air inlet velocity changing from 4m/s to 10m/s at an acceleration of 1.09m/s². The continuous upward trend of instantaneous torque output in magnitude can be noted. At 7m/s the torque output averaged for 1m/s increase is 34.4Nm which is 231% higher than the first condition. The maximum torque averaged torque output achieved is 78.2Nm at 10m/s which is 652% higher than that of condition 1 which is due to increase in velocity on the torque output. The cyclic pattern of the torque output also changes, highlighting the effect of transient condition.
Fig. 6. Instantaneous Torque output from VAWT during steady inlet velocity of 10m/s.
In order to further analyse the transient behaviour, solution is simulated for a steady inlet velocity of 10m/s as shown in figure 6. It can clearly be seen that in case of constant inlet velocity, the torque output is cyclic and uniform as compared to accelerated condition. Furthermore during acceleration, the maximum torque output achieved is 96.3Nm which is 26% higher as compared to maximum torque at steady state which is 76.5Nm. Similarly the during acceleration, the average torque output obtained is 89.4Nm which is 37% higher as compared to the constant velocity of 10m/s which is 65.2Nm.
The 3rd revolution corresponds to condition when the inlet velocity decelerates from 10m/s to its normal value 4m/s at the rate of 1.09m/s². It is evident from the figure that upon decelerating, there is a trend wise decrease in the torque output with the decrease in the inlet velocity.
The cyclic pattern of the torque also changes during initial acceleration and during last few cycles of deceleration. The blade position with respect to peak and pits changes during acceleration and deceleration as compared to the steady inlet velocity condition. This can be illustrated in figure 7.
[image:5.595.120.344.607.773.2]The torque signatures formed in the accelerating condition are not only non-conforming to the ones during steady inlet velocity of 10m/s but an interesting factor to note is that they are also non-conforming to decelerating torque signatures. These different torque signatures highlight the fact of transient conditions with continuously changing TSRs on the torque output.
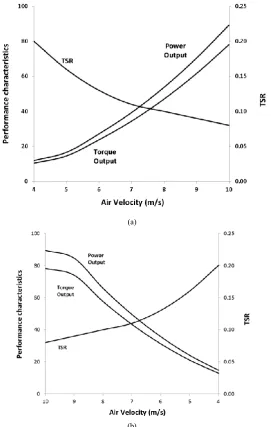
To show the performance characteristics of the turbine, both average torque and power output values can be plotted against the transient velocity of air in figure 8. TSR is plotted on a separate axis for reference.
(a)
[image:6.595.165.437.165.593.2](b)
Fig. 8. Performance characterises of the VAWT during changing velocity (a) Accelerating, (b) Decelerating.
Figure 8 shows the values of torque and power outputs, based on each 1m/s averaging period during acceleration and deceleration. It is observed that the TSR decreases as the inlet velocity increases for accelerating flow. Furthermore, the TSR increases as the flow velocity increases for decelerating flow.
The figure also reveals that during accelerating air velocity, as the TSR decreases, the torque output and the power output of the turbine increases. The maximum average power output achieved is 89.4W with the instantaneous torque value of 78.2Nm; which are considerable high as compared to power and torque output values during constant velocity of 4m/s air inlet velocity power and torque output values which are 11.8W and 10.4Nm respectively.
Table 2. Average Torque/Power Output during each m/s increase in velocity.
Accelerating Decelerating
Velocity
(m/s) Torque Output Power Output Torque Output Power Output
% difference in power
output
4 - 5 14.52 16.60 12.95 14.8 10.82
5 - 6 23.76 27.16 21.1 24.12 11.19
6 - 7 34.40 39.32 31.24 35.71 9.18
7 - 8 47.03 53.76 43.34 49.54 7.84
8 - 9 61.65 70.47 57.57 65.80 6.62
9 - 10 78.20 89.38 73.95 84.52 5.44
Table 2 presents the average torque/power output for each m/s change in velocity. It can be seen that the average torque and power outputs increase for accelerating flows whereas the torque and power outputs decrease for decelerating flows. This validates the phenomena that increase in the velocity of the air significantly increases the power output from the turbine. Furthermore, it can be observed that during change in velocity from 4m/s to 5m/s, the power output during accelerating condition is 16.6W while during decelerating condition the power output during the same velocity change is 14.8W hence giving a difference of 11%. During the first complete revolution the average torque output obtained from the turbine is 12.6Nm, during the accelerating flow, the values of average torque output achieved is 43.2Nm while during the decelerating flow of air the average torque output, given by the turbine during whole revolution, is 40Nm.
[image:7.595.163.431.460.768.2]However this percentage difference increases during change of velocity between 5m/s and 6m/s, and then decreases giving the percentage difference between acceleration and deceleration between 9m/s and 10m/s as 5%. In this regard, this percentage difference between accelerating and decelerating values doesn’t show any clear trend. Hence, in order to quantify the results, further analysis of the torque signatures is carried out. Table 3 depicts the maximum torque and the peak to peak amplitude of the torque.
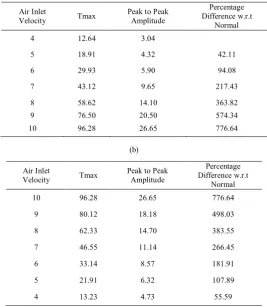
Table 3. Peak to Peak Amplitude for the Torque Outputs (a) Accelerating (B) Decelerating. (a)
(b) Air Inlet
Velocity Tmax Peak to Peak Amplitude
Percentage Difference w.r.t
Normal
4 12.64 3.04
5 18.91 4.32 42.11
6 29.93 5.90 94.08
7 43.12 9.65 217.43
8 58.62 14.10 363.82
9 76.50 20.50 574.34
10 96.28 26.65 776.64
Air Inlet
Velocity Tmax
Peak to Peak Amplitude
Percentage Difference w.r.t
Normal
10 96.28 26.65 776.64
9 80.12 18.18 498.03
8 62.33 14.70 383.55
7 46.55 11.14 266.45
6 33.14 8.57 181.91
5 21.91 6.32 107.89
The torque output from the turbine reveals another aspect. It can be seen that as the air inlet speed increases, the peak to peak amplitude of torque output also increases. This variation is recorded as 3.04Nm as maximum in case of inlet velocity of air at 4m/s. When the inlet velocity of air accelerated to 10m/s, the peak torque output achieved is 96.3Nm and the maximum peak to peak amplitude of torque is recorded as 26.6Nm which is 776% high as compared to the constant velocity condition. These high fluctuations in torque output may give rise to highly transient loads on the turbine’s structure which may induce heavy stresses on the turbine leading to structural failure.
Same analysis implies to decelerating condition, where the variation in torque amplitude decreases as the velocity decreases. The peak to peak amplitude is highest at high inlet velocity and then this decrease with the change in velocity and further reduces to 4.7Nm for inlet velocity of 4m/s. Here it highlights the fact that although the velocity has resumed to its original value of 4m/s, still there is the difference between peak to peak amplitude between steady state and the transient state which is 55%. It implies that the turbine will take some time to revert back to its normal average torque production.
4. Conclusions
Analysis of transient loading on the turbine blades is crucial for design consideration and determination of extreme behaviour of the turbine since it provides time-accurate solutions for the flow. On the other hand, steady analysis neglects the effect of changing parameters. A VAWT behaves differently under transient conditions as compared to steady state input parameters. The blade positions corresponding to production of maximum and minimum torque output change during transient inlet velocity with respect to the normal condition. Also accelerating condition gives different results as compared to the decelerating condition even though the rate of change of velocity is the same. Furthermore, Peak to peak value of amplitude of the torque increases during accelerated flows and decreases with decelerated flows. The value of peak to peak torque amplitude can be used as a parameter for the detection of accelerated and decelerated flows. It has also been shown that CFD can be used as an effective tool to predict the performance outputs of a VAWT under varying flow conditions and total life cycle of the VAWT can be computed.
References
[1] Colley, G. and Mishra, R. Computational flow field analysis of a Vertical Axis Wind Turbine, In proceedings of the International Conference on Renewable Energies and Power Quality, Las Palmas, Gran Canaria (2011).
[2] Colley, G. and Mishra, R. Effect of rotor blade position on Vertical Axis Wind Turbine performance, In proceedings of the International Conference on Renewable Energies and Power Quality (ICREPQ’10) Granada, Spain (2010).
[3] Manwell, J.F. Mcgowan, J.G. and Rogers, A.L. Wind Energy explained: Theory, Design and Application (2009); 2nd Ed., John Wiley & Sons Ltd., Chichester, UK.
[4] Park, K.S. Asim, T. and Mishra, R. Computational Fluid Dynamics based fault simulations of a Vertical Axis Wind Turbine, Journal of Physics: Conference Series (2012); 364.
[5] Rohatgi, J. and Barbezier, G. Wind turbulence and atmospheric stability – their effect on wind turbine output. Journal of Renewable Energy (1999); 16: 908-911.
[6] Sun Y, Zhang L. Numerical Simulation of the Unsteady Flow and Power of Horizontal Axis Wind Turbine using Sliding Mesh, Asia-Pacific Power and Energy Engineering Conference (2010).