2017 2nd International Conference on Computer Science and Technology (CST 2017) ISBN: 978-1-60595-461-5
Multiple Imputation by Chained Equations for Social Data
Wei HAN
1, Chuan-jun JI
2, Yun-wen CHEN
2, Ji-feng HUANG
1a*and Wu-xiong ZHANG
31The College of information, Mechanical and Electrical Engineer, Shanghai Normal University, Shanghai, China,
2Datagrand, Shanghai, China
3Shanghai Institute of Microsystem and Information Technology, Chinese Academy of Sciences, China
*Corresponding author
Keywords: Multiple Imputation by Chained Equations; Random Forest; Social Network; Missing Data.
Abstract. Most of the machine learning techniques requires high level data integrity to achieve ideal performance. However, in real application scenario with complex conditions, especially in social network, missing data is such a general problem that has certain impact on the effect of social behavior data mining using machine learning. To dress the missing data problem in social data mining, we proposed to combine Multiple Imputation by Chained Equations (MICE) with Random Forest algorithm, which applied imputation on missing data and then conducted model training and predicting. Experiments were conducted on the Titanic Passengers dataset for survival prediction. Experimental results showed that, comparing to the original Random Forest and other imputation methods combined with Random Forest, our approach achieved the best performance.
Introduction
In the social network, it has been a wide range of applications to obtain the massive user behavior data, predict personalized behavior and accurate recommendation, through the machine learning technology. The social network data has the characteristics of large scale, rapid change and wide propagation. It is a big challenge for the use of machine learning algorithm. Especially in the real network environment, because of the prevalence of data missing, incomplete sample and other issues, the common model is difficult to obtain good results.
For the problem of missing sample data, P. Royston et al [1] performed data completion by counting the Pascal distribution. Ramoni et al [2] proposed a Robust Bayes Classifier (RBC) model to improve the Bayesian algorithm for the lack of data fitness. A heuristic robust Bayesian classification algorithm based on feature selection element is proposed for feature complement and selection by Lin et al [3], using Electromagnetism-like Mechanism Algorithm(EMA)method. For the continuity data, Friedman et al [4] proposed an extended entropy discretization method to discretize the continuous attributes.
algorithms using the data of Titanic Test Dataset. It effectively reduces the error of modeling of machine learning caused by the lack of data and performs better especially for the samples which do not satisfy the normal distribution.
Multi-Interpolation Algorithm for Chain Equation Multi-interpolation
For data missing problem, compared with abandoning the whole data, data imputation can solve it better. But how to choose the appropriate value to fill is a hard thing. In contrast, Multiple Imputation is a more common interpolation method. Multiple interpolation is a data expansion and statistical analysis method established by Rubin [5] in 1987.
The multiple interpolation means that each substitution value constructs m substitution values (m>1), producing m complete data sets. Then using same data analysis method processes each complete data set, resulting in m results. The results are used, based on some principle, to get the final estimate of the target variable. Since multiple estimation techniques attempt to generate a random sample of missing values instead of filling a single value, this approach reflects the uncertainty resulting from data missing and can produce more efficient statistical inferences.
Multiple interpolation can be divided into three stages: (1) estimation of target variables; (2) creation of complete data sets, (3) determination of target variables. The most critical phase is the estimate of the target variable, which needs to be determined the method of missing the value. This stage directly affects the validity of the statistical inference.
It is assumed that the vector = ( , , … , ) is a k−dimensional random variable, subject to the k−variate distribution ( | ). The matrix = ( , , … , )
with missing data is the independent and identically distributed sampling of Y. = ( , , … , ) is the i-th sample. Let = ( , , … , ) and = ( , , … , ) represent the all observations value set and missing value set respectively. The standard procedure for constructing multiple interpolation ∗ for
is as follows:
Multiple Imputation by Chained Equations
Multiple imputation by chained equations (MICE)[6] is the most representative multiple interpolation algorithm. Through constructing a series of regression models, this algorithm establishes conditional distributions based on other variables for ones with missing data. Logistic regression can be used for variables with binary values, while linear regression can be used for continuous variables. Then, we use a standard statistical analysis process to analyze a number of data sets generated after multiple substitutions.
For the multivariate variable Y, the main problem is how to obtain the multivariate distribution of by explicit or implicit way. MICE proposed a cyclic sampling from the conditional distribution of the following form to obtain the posterior distribution of :
1 Calculate the posterior distribution ( | ) of based on the observations value set . 2 Generate ∗according to the distribution ( | ).
3 Given ∗, calculatethe conditional posterior distribution ( , = ∗) of , then
get ∗.
P(Y |Y , θ ),
. (1) P(Y |Y , θ ).
Where = ( , … , , , … , ) denote the new variable after the variable Y which is removed the ℎ column. Parameter … , are generated according to the corresponding conditional density distribution. The t (t <m) cycle of the whole construction process contains the following successive Gibbs samples:
∗( )~ ( | , ( ), … , ( ))
∗( )~ ( | , ( ), … , ( ), ∗( ))
. (2) ∗( )
~ ( | , ( ), ( ), … , ( ) ) ( )
~ ( | , ( ), … , ( ) , ∗( ))
Random Forest
The random forest [7] is an ensemble learning algorithm that contains multiple decision trees. During the training process, a series of decision trees are constructed by randomly selecting different parts of the training data set. In the prediction phase, every decision tree is utilized to predict. Finally, we take the weighted average of all decision tree results as the final result. This effectively overcomes the problem of over fitting of a single decision tree on the training set.
In the data prediction, for the test sample x ', use the K decision trees to forecast respectively. Then average the prediction results to obtain the final prediction result. For regression analysis, the final prediction results are calculated as follows:
= ∑
( )
(3)
For the classification problem, the majority of the classification results of the K decision trees are taken.
Experimental Data and Processing Experimental Data
Based on the Titanic User Data Set [8], we do experiments for user survival forecasting. Titanic sinking accident is one of the most serious disasters in human history. The data set contains the data of the people of the shipwreck. There is a certain degree of missing data in it. The data set has high similarity with the user attribute data set of social networks in the real environment.
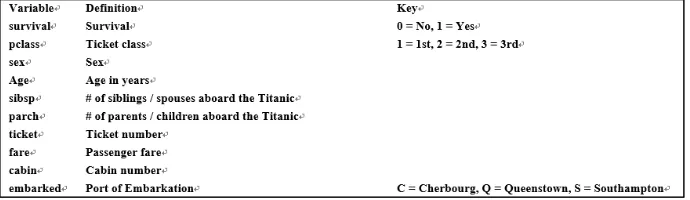
Figure1. Description of data attribute in Titanic dataset. Missing Data
[image:4.612.135.480.69.169.2]Titanic passenger data has a large proportion of missing data on age attributes. There are 177 samples which has missing age data on the training data set, the missing rate of 19.84%. The test data set has 86 samples missing data, the missing rate of 20.53%. From the basic experience, age of the people has a great influence on the probability of survival for the passengers, so we use the MICE algorithm for age attributes to complete the data.
Figure 2. Sample data in Titanic dataset.
Data Completion
Figure 3. Comparison of age distribution before and after data interpolation.
Results and Analysis
We use the random forest algorithm for Titanic survivor forecast. We use accuracy as the effectiveness of indicators; the accuracy rate is as follows:
= /
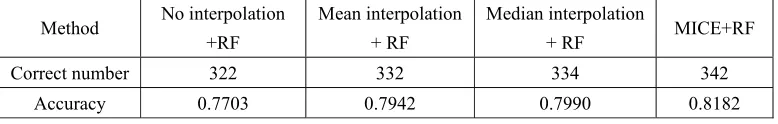
In order to compare with the MICE algorithm, we also make the datasets with no interpolation, the mean interpolation and the median data. Then we use the random forest algorithm for survivor prediction. Table 1 gives a comparison of the effects of each method. The use of MICE interpolation with random forest achieved the highest accuracy rate of 0.8182. The correct number is 342. The accuracy of predictions using median interpolation and the mean interpolation is almost the same. Dataset with no interpolation results the worst, the accuracy rate only of 0.7703. MICE with random forest algorithm are 6.22% higher than that without interpolation.
Table 1. Accuracy Comparison of Random Forest Forecasts under Various Interpolation Methods.
Method No interpolation +RF
Mean interpolation + RF
Median interpolation
+ RF MICE+RF
Correct number 322 332 334 342
Accuracy 0.7703 0.7942 0.7990 0.8182
Summary
In this paper, we propose a kind of algorithm based on MICE and random forest to deal with the problem of missing data in real social application. This method upgrades the effect of machine learning algorithm in user behavior prediction. In this paper, the comparison experiment of several interpolation algorithms by the Titanic data set shows that the new MICE algorithm can effectively upgrade the prediction accuracy caused by the high data loss rate. And it also reduces the machine learning modeling error.
Acknowledgement
[image:5.612.113.502.479.541.2]References
[1] Multiple imputation of missing values: Further update of ice, with an emphasis on categorical variables. P. Royston -Stata Journal, 2009, 9(3):466-477
[2] Ramoni, M., Sebastiani, P. Robust Bayes classifiers[J]. Artificial Intelligence 2001, 125 (1/2):209-226.
[3] Lin Hungchun, Su Chaoton. A selective Bayes classifier with meta-heuristics for incomplete data[J]. Neurocomputing, 2013,106:95-102.
[4] Friedman, N., Goldszmidt, M. Discretization of continuous attributes while learning Bayesian networks[C]//Proceedings of the13th International Conference on Machine Learning,Bari,Italy,1996:157-165
[5] Rubin, D. B. (1987). Multiple Imputation for Nonresponse in Surveys. John Wiley & Sons, New York.
[6] Van Buuren, S., Oudshoorn, K. (2000). Multivariate Imputation by Chained Equations: MICE V1.0 User’s Manual, volume Pg/Vgz/00.038. TNO Prevention and Health, Leiden. URL http://www.stefvanbuuren.nl/publications/mice%20v1.0% 20manual%20tno00038%202000.pdf.
[7] Ho, Tin Kam. (1995). Random Decision Forests (PDF). Proceedings of the 3rd International Conference on Document Analysis and Recognition, Montreal, QC, 14–16 August 1995. pp. 278–282.