2017 2nd International Conference on Computer Science and Technology (CST 2017) ISBN: 978-1-60595-461-5
A Novel Prediction Model Based on IFGM for
Flight Segment Fuel Consumption
Jing-jie CHEN, Jie CHE
a,*and Lu-lu GAO
College of Electronic Information and Automation, Civil Aviation University of China, Tianjin 300300, China
*Corresponding author
Keywords: Flight segment fuel consumption prediction, FGM (1,1), Weakening buffer operator, Missing value imputation, Panel data.
Abstract. In order to predict fuel consumption of fixed plane model and flight segment accurately, a novel FGM (1,1) (first entry GM (1,1)) model was proposed based on the weakening buffer operator and improvement of background values and grey developmental coefficient. For the enough scale of really Quick Access Recorder (QAR) data to given conditions, the proposed grey model performs better than FGM, and restrains the negative impact on prediction precision brought by the inaccurate background values of traditional FGM and volatile original data sequence.
Introduction
The major source of carbon emissions in aviation industry is fuel consumption. With the aviation carbon market in China is about to start, the verification of carbon emissions is imminent; the key is to estimate the fuel consumption accurately. At present, fuel consumption prediction model based on QAR data are detailed in reference [1]. For the samples with missing values, grey system theory is utilized and introduced in reference [2]. Because of the uselessness to the vibration data sequences, various buffer operators are put forward to process different sequences [3-7], and many improvements for background values [8-10] are also presented to boost the precision of GM (1,1) model.
For the purpose of the fuel consumption prediction to fixed plane model and flight segment, a novel flight segment fuel consumption prediction model based on the improved FGM (1,1), abbreviated as IFGM, is proposed in this paper. Based on the enough scale of real QAR data, fuel consumption panel data is constructed considering cruise altitude and gross weight to given flight segment and plane model. Considering the negative impact of data uncertainty, a K-nearest neighbor imputation method based on standardized Euclidean distance is applied to solve the QAR data missing problems.
Flight Segment Fuel Consumption Panel Data Construction
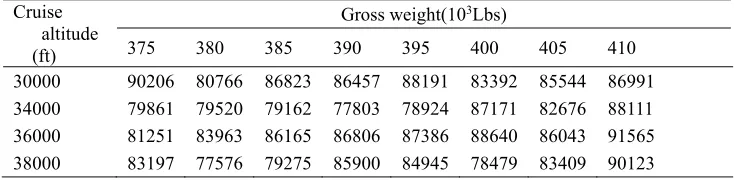
segment fuel consumption panel data shown in Table 1 demonstrate the fuel consumption affected by payload (to given plane model, gross weight reflects the payload) and cruise altitude.
Table 1. Shanghai -Beijing fuel consumption panel data in second quarter. Cruise
altitude (ft)
Gross weight(103Lbs)
375 380 385 390 395 400 405 410
30000 90206 80766 86823 86457 88191 83392 85544 86991
34000 79861 79520 79162 77803 78924 87171 82676 88111
36000 81251 83963 86165 86806 87386 88640 86043 91565
38000 83197 77576 79275 85900 84945 78479 83409 90123
The gross weight in Table 1 is a weight interval using the weight data (in the second row of Table 1) as the center and (-2.5,2.5) 103Lbs as the length. The fuel consumption in every gross weight is the weighted average of all data in weight interval, which is composed as follows:
1) get the unitization (pi) of weight.
1 ( )
, 1,2,..., ( )
i n
i GW i
p i n
GW i
=
= =
(1)where, n is the number of data in weight interval, GW is the abbreviation of gross
weight.
2) calculate the entropy (hi) of the ith data. hi = −(ln ) * *lnn −1 pi pi (2)
3) get the variation degree coefficient (vi) of ithdata. vi = −1 hi (3)
4) determine weight (wi) for each fuel consumption data.
1
1 (1 )
1
i
i n
i i
v w
n
v
=
= −
−
(4)5) obtain the flight segment fuel consumption in each weight.
1
*
n
i i
i
FF FF w
=
=
(5)where, FFiis the ith fuel consumption in weight interval.
Fuel Flow Data Missing Analysis and Process
The QAR data is always uncompleted because of its complex working environment and improper operation in data storage and transmission. The uncertainty of QAR data reduces the accuracy of the constructed flight segment panel data inaccurate, leaving this unsolved may critically degrade the reliability of any consequent downstream statistical analysis and decision making.
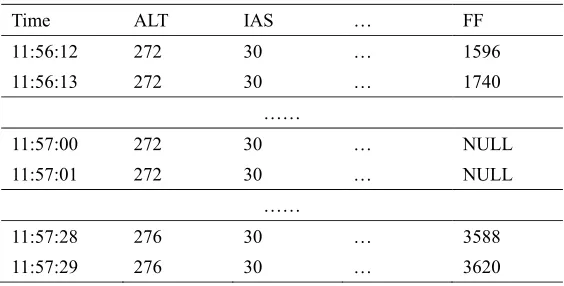
To analyze the influences of fuel flow missing data on fuel consumption statistical analysis and prediction when missing rate is lower than 15%, a gapped-data sample with the missing rate 8.7% was made artificially for the data sample utilized in Table 1. The missing data sample for one of samples with 3000ft cruise altitude in 385(103Lbs)
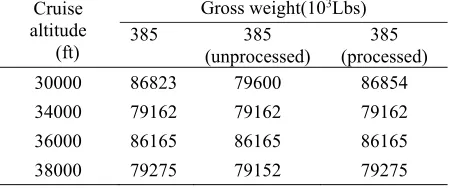
[image:3.612.169.436.83.216.2]weight interval is shown in Table 2(where NULL denotes the losing value, ALT is flight altitude, IAS is air speed, FF is fuel flow). The fuel consumption panel data to given cruise altitude in 385(103Lbs) weight interval is shown in Table 3.
Table 2. Missing data sample.
Time ALT IAS … FF
11:56:12 272 30 … 1596
11:56:13 272 30 … 1740
……
11:57:00 272 30 … NULL
11:57:01 272 30 … NULL
……
11:57:28 276 30 … 3588
[image:3.612.165.447.477.620.2]11:57:29 276 30 … 3620
Table 3. Flight segment fuel consumption considering data missing problem. Cruise
altitude (ft)
Gross weight(103Lbs)
385 385
(unprocessed)
385 (processed)
30000 86823 79600 86854
34000 79162 79162 79162
36000 86165 86165 86165
38000 79275 79152 79275
Compared the data in Table 3, based on the K-nearest neighbor(KNN) imputation method proposed in reference [12], the KNN method based on standardized Euclidean distance is used to process the fuel flow data missing problems in this paper.
K nearest neighbors are selected according to the similarity of main factors affecting fuel consumption between missing data samples and observed samples. The standardized Euclidean distance is used to measure the similar degree, the formula is defined as follows:
1
( )T ( )
i i i
d = z −g V− z −g (6)
where, g [ ,= g g1 2,...,gm] denotes the missing data sample, zi =[ ,zi1 zi2,...,zim]
denotes the observed sample, m is the sample dimension, and V is the standard
deviation of observed fuel flow samples.
According to Eq. (1)-(4) in Section 2, the entropy weight for K nearest neighbors can be obtained. The fuel flow missing value is estimated by the weighted average of K nearest neighbors. The processed fuel consumption panel data is shown in forth column in Table 3, which is close to the original data and meets the original fuel consumption distribution law.
Flight Segment Fuel Consumption Prediction Model Design
Considering QAR data missing problems, based on the existing FGM (1,1) model [9], a novel comprehensive grey prediction model (IFGM (1,1)) is presented to restrain the negative impact brought by inaccurate parameters of tradition grey model. What’s more, the weakening buffer operator based on strictly monotone function proposed by Zheng-peng WU etc. [3-7] is applied in this model, which is used to adjust the fluctuation of fuel consumption data. The IFGM (1,1) model is composed of the following steps:
Assume the original series to be 0 { (0)(1), (0)(2),..., (0)( )}
X( )= x x x n .
Step 1: weakening buffer operator sequence generation. According to the weakening buffer operator D4 proposed in [5], the weakening buffer operator sequence
called XD is generated. To make full use of the original series, an arbitrary constant
(0)
x is added in front of the weakening buffer operator sequence.
4 4
( (0), (1) ,..., ( ) )
XD= x x d x n d , where
1 ... 4
( ) {[ wk( ( )) ... wn( ( ))]wk wn}
x k d =g f x k × × f x n + + (7)
and ( ) 2
f x =x is used in this paper as the monotone function, ( )g x is the inverse
function of ( )f x , wk is the weight obtained by the entropy of every data in series using
Step 2: first-order accumulated sequence (1-AGO) X(1) generation.
(1)
4 0
( ) k ( ) , 0,1,...,
i
x k x i d k n
=
=
= (8) Step 3: time response function of IFGM. The parameters of time response sequence for FGM (1,1) are determined by least-squares method. To reduce the error of
prediction value, =a a+ε is used to replace the grey developmental coefficienta, and εis an arbitrary value determined by multiple experiments.
(1) ( )
4
ˆ ( 1) ( (1) b ) a k b
x k x d e
a a
ε
ε − + ε
+ = − +
+ + (9)
Where, [ , ]T ( T )1 T n
a b = B B − B Y ,and [ (0)(1), (0)(2),..., (0)( )]T n
Y = x x x n (10)
(1)
(1)
(1)
(1) 1 (2) 1
( ) 1
z z B z n − − = −
(11)
and (1)( )
z k is the background value of grey model, which is defined as
(1)( ) (1)( ) 1 (1)( 1)
z r =μx r + −( μ)x r− (12)
where, r=1, 2,...,n , μ is determined using automatic optimization method
proposed by Hua-long YANG [8].
The simulation value for can be derived to be
( ) ( )
4 4
ˆ( 1) (1 a )( (1) b ) a k
x k d e x d e
a
ε ε
ε
+ − +
+ = − −
+ (13)
So, the modelling value Xˆ( )0 is given by
1 1 ( ... ) (1) 4 ( ... ) (1) 4 ( ( ( )
ˆ( ) [ ]
( ( ( 1) )
k n k k n w w w w w
f x kd x k
f x k d +
+ +
+ + =
+ (14)
where, k=1, 2,...,n−1.When k≥n, xˆ( )0 ( )n =xˆ(1)( )n d4.
By this, the future data can be forecast using IFGM (1,1) model.
Performance Evaluation
The real QAR data of Shanghai-Beijing segment for A330 plane is used in this paper to construct the fuel consumption panel data about gross weight and cruise altitude. Training the IFGM (1,1) model repeatedly, when μ=0.65and ε =0.00005, the proposed model performs best to the selected QAR data.
Residual error inspection method [2] is applied to analyze the model precision. The residual error sequence is defined as:
ˆ ( (1), (2),..., ( ))
E= e e e n = −X X (15)
| ( ) |
( ) 100% ( )
e i i
x i
ξ = × (16)
2
1 ( ) n
i error
e i RMS
n =
=
(17)The model precision can be estimated from as follows:
(1 ) 100%
P= − ×ξ (18)
where,
1
1
| ( ) |
n
i
i n
ξ ε
=
=
, is the mean value of relative error. When P>90% , greyprediction model meets the request of precision, and the grey differential equation will be close to the real differential equation.
Table 4. Prediction of flight segment fuel consumption considering data missing with 30000ft cruise altitude.
Gross weight
(103Lbs) original
predicted
original unprocessed processed
375 90206 85025 82728 85035
380 80766 85228 83311 85236
385 86823 85416 83856 85423
390 86457 85606 84406 85611
395 88191 85796 84961 85800
400 83392 85987 85519 85989
405 85544 86178 86080 86178
410 86991 86369 86645 86368
According to Eq. (14) and KNN imputation method detailed in Section 3, flight segment fuel consumption to 30000ft cruise altitude samples considering fuel flow data missing are simulated by MATLAB. The predicted values are shown in Table 4, where the italic denote the data samples in this weight interval considering the data underlined missing. Based on the contrast to last two columns of data in Table 4(which represents the predicted series with missing data unprocessed and processed), the necessary of fuel flow missing data process is affirmed.
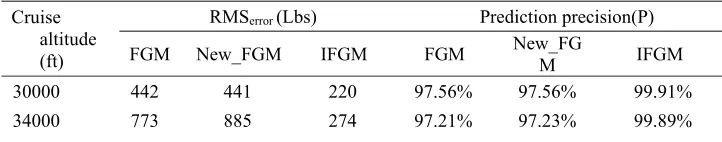
In order to analyze the necessity of improvement of background and grey developmental coefficient, we added the weaken buffer operators used in IFGM (1,1) into FGM. As shown in Table 5(where New_FGM denotes the FGM added the weaken buffer operators), for all fuel consumption to different cruise altitude with various fluctuation status, the proposed IFGM (1,1) is always shown a higher precision and lower root mean squared error, which verifies the validity of the IFGM (1,1) model.
Table 5. The model precision for different grey models.
Cruise altitude (ft)
RMSerror (Lbs) Prediction precision(P)
FGM New_FGM IFGM FGM New_FGM IFGM
30000 442 441 220 97.56% 97.56% 99.91%
36000 461 430 416 98.64% 99.01% 99.84%
38000 1432 1490 760 96.15% 99.16% 99.70%
Conclusions
This paper proposes a novel flight segment fuel consumption prediction model based on the existing FGM (1,1) model. The experimental results demonstrate the outperformance of proposed model, which is gauged based on the widely-used RMSE analysis and Residual error inspection method. The improved KNN algorithm based on the standardized Euclidean distance is utilized to process the fuel flow data missing, and the improvement of background values and grey developmental coefficient to existing FGM (1,1) model are applied in this paper. The experiments show that the proposed model is better than existing FGM (1,1) model and can be used to estimate the fuel consumption to different payload. This model is presented based on the processing to the missing data, which avoids the statistical error caused by the data missing, which provides a strong protection for fuel consumption estimation and monitoring to airlines.
References
[1] Jing-jie CHEN, Meng LI. Fuel Consumption Prediction Based on Bootstrap Method Under Small Size of Samples[J]. MEASUREMENT &CONTROL TECHNOLOGY, 2015,34(10): 0026-0030 (in Chinese).
[2] Yi LU. The Research and Application of Grey Forecast Model[D]. Hangzhou: Zhejiang Sci-Tech University, 2014 (in Chinese).
[3] Zheng-xin WANG, Yao-guo DANG, Si-feng LIU. A sort of power weakens buffer operators and its properties[J]. Control and Decision, 2012, 27(10), 1482-1488 (in Chinese).
[4] Wei-jie ZHOU, Yao-guo DANG, Hong-sheng LIU. Comparison of operator strength and smoothen between common weakening buffer and their multi-order operators [J]. Systems Engineering-Theory & Practice, 2013, 33(11): 2903-2909 (in Chinese).
[5] Yong SU. Study on the Grey Buffer Operators and Smoothness of Buffer Sequence[D]. Hangzhou: Zhejiang Sci-Tech University, 2013 (in Chinese).
[6] Jing YE, Bing-jun LI, Fang LIU. Forecasting effect and applicability of weakening buffer operators on GM (1,1) [J]. Systems Engineering-Theory & Practice, 2014, 34(09): 2364- 2371 (in Chinese).
[7] Ning XU, Yao-guo DANG. Construction of buffer operator with smooth variable weight and property[J]. Control and Decision, 2014; 29(07): 1262-1267 (in Chinese). [8] Hua-long YANG, Jin-xia LIU, Bin ZHEN. Improvement and Application of Grey Prediction GM (1,1) Model[J]. MATHEMATICS IN PRACTICE AND THEORY, 2011, 41(23): 0039-0046 (in Chinese).
[10] Lifeng Wu, Sifeng Liu, Zhigeng Fang, Haiyan Xu. Properties of the GM (1,1) with fractional order accumulation[J]. Applied Mathematics and Computation, 2015,252(01):287-293.
[11] Jing-jie CHEN, Guan-ping XIAO. Minimum sample size analysis of aircraft segment fuel consumption interval estimation[J]. COMPUTER ENGINEERING AND DESIGN, 2014; 35(12): 4356-4360 (in Chinese).