2017 2nd International Conference on Information Technology and Management Engineering (ITME 2017) ISBN: 978-1-60595-415-8
The Comparison and Study of WVD, PWVD, SPWVD Time Frequency
Analysis Technologies Based on Observed Dynamic EEG Data
Yi-feng LI*, Li-hui ZHANG, Xi-chen GENG, Zhao JIN, Hai-xia WANG,
Rong LIN, Xiao-yan LIU, Yi WANG, Bao-hui LI,
Xiao-yang WEI and Quan WANG
Air Force Institute of Aeromedicine, Beijing, China
*Corresponding author
Keywords: WVD, PWVD, SPWVD, Dynamic EEG data, Time frequency characteristic.
Abstract. For the observed EEG data under +Gz acceleration, the traditional Fourier transformation can not express the change regularity of EEG frequency spectrum characteristic with time, so it is tried to make data treatment with the help of analysis tool of WVD. Through the theory comparison on WVD, PWVD and SPWVD-this three analysis methods and the comparison analysis on the application results of the actually measured EEG data under centrifuge +Gz acceleration, the respective advantage and disadvantage of the three methods is studied, and SPWVD is found to be relatively a better analysis method. It can eliminate effectively crossing term interference which is innate for quadratic form distribution and has better focusing characteristic, and can better reflect the state of EEG under different G acceleration and frequency spectrum change characteristic.
Introduction
SPWVD is a more adaptive method, and it can help to better find the state and change characteristic of EEG under different G loads.
The Theory Introduction of WVD, PWVD and SPWVD [19]
WVD is the basic and core of many analysis technologies, other quadratic form time frequency distribution can all be looked as the adding windows form of WVD, and its definition forum of time domain is as:
∫
+∞ ∞ − − − += x t τ x t τ e πτdτ f
t
WVD j f
x 2 * ) 2 ( ) 2 ( ) ,
( (1)
WVD has better time frequency cluster characteristic. But for multi-component signal, crossing term can produce “false signal”. Crossing term is the intrinsic result of quadratic form or bilinear time frequency distribution, and they come from the crossing action of different signal components in multi-component signal, reducing the time frequency analysis ability of WVD.
PWVD is making adding window treatment for basic WVD. The reason is the actual integral is not possible from -∞ to ∞, so it should study the integral result of limited range. Its distribution definition form is as:
∫
+∞ ∞ − − − += τ τ τ πτ τ
d e t x t x h f t
PWVDx * ) j2 f
2 ( ) 2 ( ) ( ) ,
( (2)
The result of adding window makes absolute nonlocal characteristic of WVD becomes local, moreover, from some degrees, it decompresses the crossing term of multi-component signal, but at the same time destroys some marginal characteristic of WVD.
So in order to reduce and eliminate the crossing interference brought by WVD, according to the characteristic of WVD, WVD after two time domain signals make convolution equals to the convolution of respective WVD on time axis, and this is the equal of that WVD transformation making smooth in time domain. Thus transformation is called as Smooth Pseudo Wigner—Ville Distribution. Its definition is as:
∫ ∫
+∞∞ +∞ ∞ − − + = - -2 * ) 2 ( ) 2 ( ) ( ) ( ) ,( τ τ τ πτ τ
d e t x t x h u g f t
SPWVDx j f (3)
Among this, g(t),h(t) are real symmetrical window functions. After making the treatment of adding window smoothing on time domain and frequency domain for signal, the crossing term of time domain and frequency domain can get a big inhibition. While SPWVD loses some mathematics characteristics of WVD because of this, and union time frequency resolution ratio also can descend simultaneously. But the scales of time domain smoothing and frequency domain smoothing are easy to get control, moreover, the lengths of window function g(t),h(t) can be selected independently.
The Application and Characteristic Comparison of WVD, PWVD, and SPWVD on the Actually Measured Dynamic EEG Data
The Acquisition of the Actually Measured EEG Data
to the level state of ear pulse, combining with the subjective narration of peripheral lamp disappeared or central lamp indistinct and the expression of the subject. EEG data when running, and before and after running is recorded by using a portable EEG recorder. Electrode signal of 16 leads is recorded in accordance with the electrodes positions of 10-20 system of international EEG standard electrodes installation method. All electrodes take the electrode at ipsilateral earlobe (A1 or A2) as the reference electrode [20]. Subject is worn of different types of fasten mesh cap, and each electrode is affixed special medical tape to prevent becoming loose in running. In experiment the subject is required to try to keep the natural state. Measuring method of single electrode lead is selected. The sampling rate is 128Hz.
The Result and Analysis of Method Application
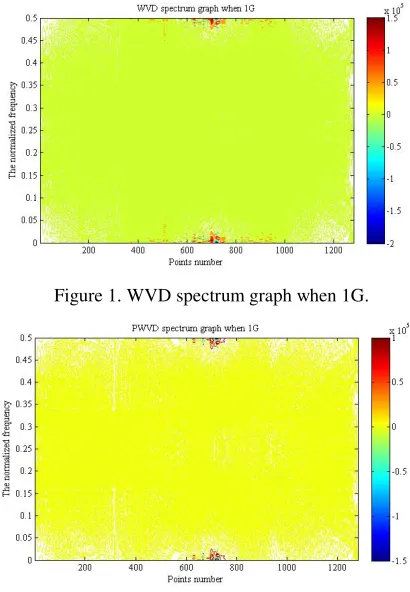
[image:3.612.200.405.319.615.2]For the each lead EEG data of 16 leads, EEG data at quiet state that is when 1G and EEG data under +Gz acceleration are respectively selected, selecting EEG data of 10s, and the sampling rate of EEG data takes 128Hz.The data is analyzed by using WVD, PWVD and SPWVD methods respectively, and all spectrum graphs of each lead for 16 leads when 1G and under different G load acceleration are made. The following Figure1~3 are the made time frequency graphs when subject is at quiet state that is when 1G by using respectively WVD,PWVD and SPWVD methods. The following Figure4~6 are the made time frequency graphs when subject is under 3G acceleration by using respectively WVD, PWVD and SPWVD methods.
Figure 1. WVD spectrum graph when 1G.
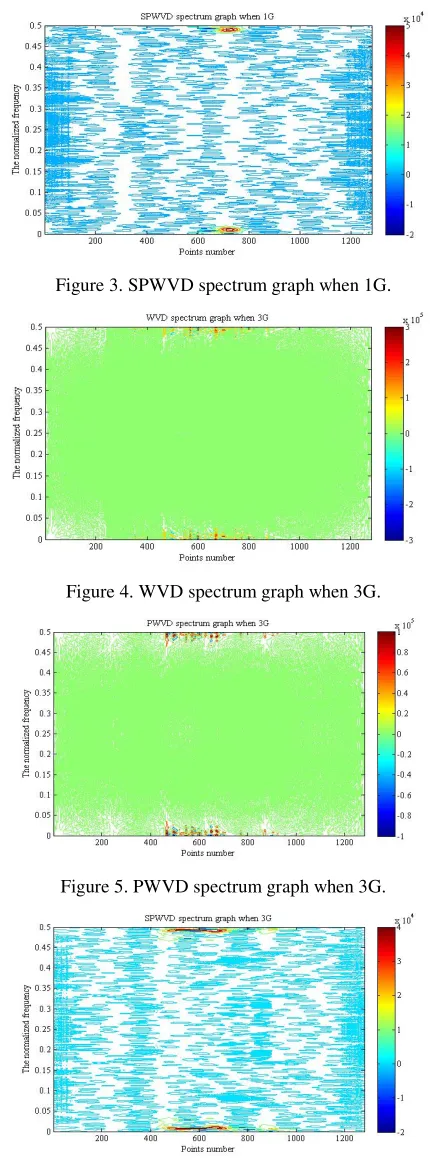
Figure 3. SPWVD spectrum graph when 1G.
Figure 4. WVD spectrum graph when 3G.
Figure 5. PWVD spectrum graph when 3G.
Figure 6. SPWVD spectrum graph when 3G.
is basically unanimous with EEG some change characteristic observed by other time frequency analysis methods previously [21]. In addition, no matter with or not with load action, all spectrum graphs have higher energy accumulation at about 65Hz, and this phenomenon expresses more obviously in SPWVD graphs. The interference frequency of power is about 50Hz, while electromagnetism interference frequency of instrument and apparatus in cabinet is not generally so concentrate, moreover, under +Gz acceleration, the low frequency component increases and high frequency component decreases generally, so this phenomenon explains that brain can produce feature wave about 65Hz because of excitability under G load acceleration.
From Figure1 and Figure4 it can be seen that, WVD is quadratic form time frequency description method, its time frequency resolution ratio is fixed, and is higher relatively FFT, and has better time frequency cluster characteristic. But for EEG signal which has many kinds of frequency components, more serious interference of crossing term still exists, also reducing its time frequency resolution ratio. Crossing term is the natural result of time-frequency distribution of quadratic form or bilinearity, and they come from the crossing action between different signal components in multi components signal. That is, for the complex signals such as EEG, the crossing term will produce a “false phenomenon". As Figure 2 and Figure 4, the PWVD after the treatment that WVD adds window function, makes the complete non local characteristic of WVD becoming as localization, and at a certain extent, compresses the crossing term interference of multi components signal, but at the same time it destroys some edge characteristic of WVD, time-frequency concentration decreasing. SPWVD develops on the basis of WVD, inherits the advantages of WVD, making smooth processing for crossing interference, with a better effect of eliminating cross term, and at the same time its time-frequency characteristic and focusing property both also maintain better. Not like WVD, advantages are standing out, and disadvantages are also obvious, limiting its application. From Figure 3 and Figure 6, it can be seen that, compared to the other two kinds, SPWVD is indeed able to more clearly express the time-frequency distribution characteristic of dynamic EEG signal. When focusing on the limited frequency band, that is the concerned range of frequency band is not very wide, the choice of SPWVD can get a higher time frequency resolution ratio, and the advantage is more prominent. So considering from several aspects factors, relatively speaking, for the focused on frequency within the range of narrow band less than 60Hz, using SPWVD as a time-frequency analysis tool of EEG data is a better choice, and it can help more clearly understand the distributions of low and high frequency parts in signal and recognize characteristic of signal. The feasibility of this method on the analysis of dynamic EEG data is proved. But SPWVD also has some shortcomings, such as the computing time is relatively longer, and when frequency range is required ,compared to WVD, it reduces interference of crossing term, while decreases time-frequency resolution ratio and so on, so the application of SPWV is also a perfection process.
Conclusions
can be as a kind of better time frequency analysis tool of characteristic analysis of EEG data, proving the feasibility of this method on the analysis of dynamic EEG data. Compared to other two methods, SPWVD can more clearly express the time frequency distribution characteristic of dynamic EEG signal under different G loads, and help better recognize the characteristic of dynamic EEG signal.
References
[1] Koji Morikawa, Akinori Matsumoto, Shrishail Patki, Bernard Grundlehner,Auryn Verwegen, Jiawei Xu, Srinjoy Mitra and Julien Penders. Compact Wireless EEG Sys tem with Active Electrodes for Daily Healthcare Monitoring. IEEE International Conference on Consumer Electronics (ICCE). 2013:204-205.
[2] H. Li, Y.-D. Liu, J.-H. Lu, T. Zheng, X.-H. Yu, Suppressing EMI in Power Converters via Chaotic SPWM Control Based on Spectrum Analysis Approach, IEEE Transactions on Industrial Electronics, 2014, 61 (11): 6128–6137.
[3] K. Patil, K.-E. Skouby, R. Prasad, Spectrum measurement and analysis of TV band support of Cognitive Radio operation in India, 2013 3rd International Conference on Wireless Communications, Vehicular Technology, Information Theory and Aerospace & Electronic Systems (VITAE), Atlantic City, NJ, 2013:1–5.
[4] Zabalza, J. J.-C. Ren, J.-B. Zheng, J.-W. Han, H.-M. Zhao, S.-T. Li, S. Marshall, Novel Two-Dimensional Singular Spectrum Analysis for Effective Feature Extraction and Data Classification in Hyperspectral Imaging, IEEE Transactions on Geoscience and Remote Sensing, 2015, 53(8):4418–4433.
[5] SN. Tang, FC. Jan, HW. Cheng, CK. Lin, G Z. Wu. Multimode Memory-Based FFT Processor for Wireless Display FD-OCT Medical Systems. IEEE Transactions on Circuits and Systems I: Regular Papers.2014; 61 (12): 3394–3406.
[6] N. Fuad, W. Mansor, and K.Y. Lee, “Wavelet packet analysis of EEG signals from dyslexic children with writing disability,” in: 35th Annual International Conference of the IEEE, Engineering in Medicine and Biology Society (EMBC), Osaka, pp. 2890-2893, 2013.
[7] A.S. Zandi, P. Boudreau, D.B. Boivin, and G.A. Dumont, “Circadian variation of scalp EEG: A novel measure based on wavelet packet transform and differential entropy,” in: 35th Annual International Conference of the IEEE, Engineering in Medicine and Biology Society (EMBC), Osaka, pp.6297-6300, 2013.
[8] G. Serbes, N. Aydin, and H.O. Gulcur, “Directional dual-tree complex wavelet packet transform,” 2013 35th Annual International Conference of the IEEE, Engineering in Medicine and Biology Society (EMBC), Osaka, pp. 3046-3049, 2013.
[9] K. Rai , V. Bajaj ,A. Kumar. Hilbert-Huang transform based classification of sleep and wake EEG signals using fuzzy c-means algorithm. 2015 International Conference on Communications and Signal Processing (ICCSP), IEEE, Melmaruvathur, 2015: 0460–0464.
[10] Rui Wang,Yang Wang ,Chunheng Luo. EEG-Based Real-Time Drowsiness Detection Using Hilbert-Huang Transform. 2015 7th International Conference on Intelligent Human-Machine Systems and Cybernetics (IHMSC), (Volume: 1), Hangzhou, 2015: 195–198.
[11] B. Lenka. Time-frequency analysis of non-stationary electrocardiogram signals using Hilbert-Huang Transform. 2015 International Conference on Communications and Signal Processing (ICCSP), Melmaruvathur, 2015: 1156–1159.
for time-frequency representation of a signal through Wigner-Ville distribution. 2016 International Conference on Electronics, Communications and Computers (CONIELECOMP), 2016, Cholula: 162–167.
[13] Stanislav Pikula, Verification of enhanced interference reduction in WVD on real non-stationary acoustic signal. 2015 16th International Carpathian Control Conference (ICCC), 2015, Szilvasvarad: 385–388.
[14] Taylan O. Gulum, A. Yasin Erdogan, Kani K. Guner, Lutfiye Durak-Ata, Tulay Yildirim, Phillip E. Pace. PWVD resolution considerations for LFMCW signal detection by WHT, 2014 20th International Conference on Microwaves, Radar, and Wireless Communication (MIKON), 2014, Gdansk: 1–4.
[15] Xu Zhu, Takeo Fujii, A novel modulation classification method in cognitive radios based on features clustering of time-frequency, 2016 IEEE Radio and Wireless Symposium (RWS), 2016, Austin, TX: 45-47.
[16] Ning Ma, Jianxin Wang, Dynamic threshold for SPWVD parameter estimation based on Otsu algorithm, Journal of Systems Engineering and Electronics,2013, 24 (6) : 919–924.
[17] Kewen Sun, Ming Zhang, Dongkai Yang, A New Interference Detection Method based on Hybrid Time-Frequency Distribution for GNSS Receivers, IEEE Transactions on Vehicular Technology, 2016, pp (99) :1.
[18] Gongjian Wei, Ting Jiang, Yue Liu, Wei Liu, Dynamic gesture recognition using software defined radio based on smooth pseudo Wigner-Ville distribution, 2015 9th International Conference on Signal Processing and Communication Systems (ICSPCS), Cairns, QLD: 2015: 1–5.
[19] Guo Hong-tao, Xu Lai-Wu, Wu Ji-fei, Yu Li, Investigation on SPWVD time-frequency analysis technique for unstationary fluctuating pressure data. Journal of Experiments in Fluid Mechanics, 2 011, 25(5):40-44, 78.
[20] M. Nakamura, Q. Chen, T. Sugi, A. Ikeda, H. Shibasaki, Technical quality evaluation of EEG recording based on electroencephalographers’ knowledge, Medical Engineering & Physics, 2005, 27:93–100.