© 2016, IRJET | Impact Factor value: 4.45 | ISO 9001:2008 Certified Journal | Page 1801
STUDY OF ABSORPTION AND DESORPTION OF WATER IN
SUPERABSORBENT POLYMER
a
M.A. Suryawanshi*,
bV.B. Tidke
,
cN.B. Khairnar,
dR.D. Patil
aDepartment of Chemical Engineering, Bharati Vidyapeeth college of Engineering,MH,India
E-mail: * [email protected], contact no: 8108802233
bDepartment of Chemical Engineering, Institute of Chemical Technology(UDCT), MH,India
c,d, Department of Chemical Engineering, Bharati Vidyapeeth college of Engineering,MH,India
Abstract: The objective of our project is to study the
kinetics of absorption and desorption of water in SAP. SAP’s are able to absorb water up to 300 times of its own weight. The basic property of the water absorption has suggested the use of SAP in many fields such as Agriculture, Horticulture, Disposable baby diapers, sanitary goods and Medicine. The ability of swollen SAP’s to release the water to surrounding as vapor has also been used in various ways for example Humidity Controlling or Soil Conditioner. The SAP’s used for experiment were poly-acrylic based. The swelling tests carried out at 20, 30 and 60 0C temperatures to study the thermal stability of SAP. The results have shown that the swelling rate increases with increase in surrounding water temperature. The kinetics were fitted to different models namely Peleg, First order absorption kinetic and Exponential association equation models. Out of all models Peleg model provides a good agreement with experimental data with high value of R2, slope and intercept, it is concluded that the Peleg’s model represent swelling characteristics better than other models.
Keywords: SAP, absorption, desorption, agriculture,
models etc.
INTRODUCTION
Superabsorbent polymers (SAP’s) are materials that have the ability to absorb and retain large volumes of water and aqueous solutions. This makes them ideal for use in water absorbing applications such as baby nappies and adults incontinence pads to absorbent medical dressings and controlled release medium. Early superabsorbent were made from chemically modified starch and cellulose and other polymers like poly (vinyl alcohol) PVA, poly (ethylene oxide) PEO all of which are hydrophilic and have a high affinity for water. When lightly cross-linked, chemically or physically, these polymers became water-swellable but not water-soluble [Francesco F.M. et.al.].
Today’s superabsorbent polymers are made from partially neutralized, lightly cross-linked poly (acrylic acid), which has been proven to give the best performance versus cost ratio. The polymers are manufacture at low solids levels
for both quality and economic reasons, and are dried and milled in to granular white solids. In water, they swell to a rubbery gel that in some cases can be up to 99% wt water.
Superabsorbent hydrogels are a particular class of gels, obtained by chemical stabilization of hydrophilic polymers in a Three-dimensional network. Most of the traditional hydrogels on the market are acrylate-based products, thus not biodegradable. Due to the increase inattention for environmental protection issues, biodegradable hydrogels arise lively interest for potential commercial application in agriculture. It is a polymer where the long chains are cross-link to one another. A polymer can absorb water many times its volume therefore earning the term superabsorbent. After it absorbs the water, it forms a stiff gel.
Cross-links between polymer chains form a three-dimensional network and prevent the polymer swelling to infinity i.e. dissolving. This is due to the elastic retraction forces of the network, and accompanied by a decrease in entropy of the chains, as they become stiffer from their originally coiled state. There is a balance now between the forces of retraction and the tendency for the chains to swell to infinite dilution. The degree of cross-linking has a direct effect on the level of swelling of the polymer and the strength of the network i.e. Increased cross-link density = decreased swelling capacity = increased gel strength.
MATERIALS AND METHODS
Raw MaterialsThe polymeric material used in this study was purchased from local market, Matunga, Mumbai. The material is locally known as magic balls. We have performed two sets of experiments to study the kinetics for absorption and desorption phenomenon of water in SAP. The material used is shown in Figure 1.
Method used for swelling of SAP
© 2016, IRJET | Impact Factor value: 4.45 | ISO 9001:2008 Certified Journal | Page 1802 with water for swelling. The constant temperatures were
observed throughout the experiment by using digital temperature indicator. The experimental set up is shown in Figure 2. The swelling content and diameter of SAP were measured at specific time interval. While taking readings sample were removed from water and surface water wiped by using tissue paper. Then using this weight and diameter data the swelling kinetics were investigated. The experiments were carried out till equilibrium weight of SAP was observed.
[image:2.595.309.513.150.337.2]
[image:2.595.37.257.243.430.2] [image:2.595.38.269.453.666.2]
Figure 1: SAP balls used for experiments
Figure 2: Experimental Set up for Absorption.
Method used for desorption of SAP
Desorption i.e. drying test was carried out at room temperature of 30 0C as shown in Figure 3. SAP sample used for experiment was completely saturated with water. The starting weight of SAP balls were measured after wiping surface water by tissue paper. The reduction in
water content and diameter were measured after specific time interval continuously till constant weights were observed.
Figure 3: Desorption of SAP balls
Swelling content
The swelling contents were calculated as follows: , (1)
Where,
S is the swelling content (g of water/g of dry balls), is the weight of swollen SAP at time t and is the weight of original dry SAP.
Swelling rate
Change in swelling content per unit of time in SAP is called “swelling rate” of SAP and is calculated using,
, (2) Where,
is swelling content at any time (g/g of dry balls) and is the swelling at “ ”
Diffusion of water
The Ficks law is used for the calculation of the swelling kinetics and diffusion of SAP structure. Swelling kinetics of polymers can be given by Peppas et al.
, (3) Where,
© 2016, IRJET | Impact Factor value: 4.45 | ISO 9001:2008 Certified Journal | Page 1803 obtained from the arrangement of Fick’s II law and given
as [R. Dengre et.al.]
, (4) Where,
represent coefficient of diffusion as m2/s and represents the swollen SAP balls radius as m.
Activation Energy
The dependence of the diffusivity coefficient on temperature is often given by an Arrhenius type equation [M. Bohning et.al.]
, (5)
Where,
is the pre-exponential factor of Arrhenius equation (m2/s), is the activation energy (kJ/mol), is temperature of water (K-1) and is the universal gas constant of 8.314×10⁻³ (kJ/mol.K).
Mathematical Modeling of Absorption Kinetics
In this study, the methods that are developed from different researchers were used. Namely Peleg’s model (6), First order absorption kinetics model (7) and Exponential association equation (8) [M. Peleg, D.K. Apar, M. Noshad]
Peleg proposed a two parameter model to describe water absorption by grains [M. Peleg]
, (6)
Where is swelling content at =0 (g of water /g of dry balls), is the swelling content at any time (g/ g of d.b.), is the swelling time in (s), is kinetic constant of the model (h(g.d.b)/g), and is characteristics constant of the model (g d.b./g). In equation (6) “ ” becomes “ ” if the process is absorption or adsorption and “ ” if the process is drying or desorption.
In the first order absorption kinetic model, the equation used is of the following form, [K.G. Kaptso, K. Gomicki]
, (7)
Where,
is the swelling kinetic constant (h-1). Consider , (8)
RESULTS AND DISCUSSION
Swelling Curves
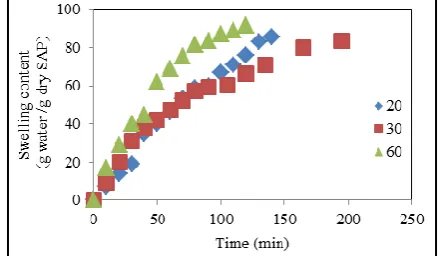
From the results obtained the SAP swelling came to equilibrium at value at different time for different temperature of water and diameter of balls. The swelling equilibrium values for SAP were found as 84.5, 86.5 and 92.57 g water/g SAP balls for temperatures of 20, 30 and
[image:3.595.323.545.175.303.2]60 0C, respectively for diameter of 3mm and similarly 26.8, 46 and 32.1 for 1mm diameter. Swelling content S is calculated by (1). The S-t graph was drowning from these values and swelling isotherms were constructed, shown in Figure 4 and 5 for 3mm and 1mm diameter respectively.
Figure 4: Swelling of SAP balls as a function of time at different temperatures for 3mm diameter of balls.
Figure 5: Swelling of the SAP balls as a function of time at different temperatures for 1mm diameter of balls.
The hydrogels swelling increases with increase in temperatures as seen in Figure 4 and 5. Figure 6 shows the change in SAP swelling rate with respect to swelling content for 3mm diameter of SAP balls.
[image:3.595.320.545.345.483.2] [image:3.595.321.548.567.697.2]© 2016, IRJET | Impact Factor value: 4.45 | ISO 9001:2008 Certified Journal | Page 1804 As seen in Figure 7, the swelling rates and swelling
content are increased with increasing temperatures. The maximum swelling content is found at 600C temperature of water, i.e. 92.57 g water/g dry SAP for 3mm diameter.
Figure 7: Swelling rate curve for SAP at different temperatures for 1mm diameter
As seen in Figure 5, the swelling content content for higher temperature of 600C is lesser than at 300C temperature of water, this is because of smaller diameter of the SAP balls. It is possible to say the H-bonds inside the SAP balls were broken due to temperature rise, it also increases the thermal mobility of polymer molecules inside the hydrogels.[2]
Calculation of Diffusion Coefficients
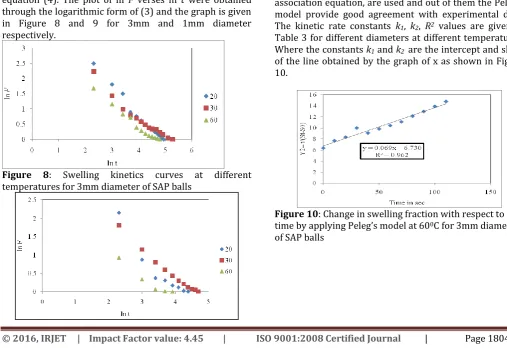
The diffusion coefficients were calculated by using equation (4). The plot of ln F verses ln t were obtained through the logarithmic form of (3) and the graph is given in Figure 8 and 9 for 3mm and 1mm diameter respectively.
Figure 8: Swelling kinetics curves at different temperatures for 3mm diameter of SAP balls
Figure 9: Swelling kinetics curves at different temperatures for 1mm diameter of SAP balls
Diffusion coefficient is one of the major parameters to determine the swelling characterisation of hydrogel, and it is calculated by using (4). The values of diffusion coefficient obtained for SAP are listed in Table 2.
Calculation of Activation Energy
The calculated diffusiveties Activation energy is calculated by using (5). The values of activation energies for 1mm and 3mm are given in Table 2.
Table 2: Values of swelling coefficients of SAP for 1mm and 3mm
Parameters 1mm 3mm
Temperatur e (0C)
20 30 60 20 30 60
Diffusion Coefficients (k × 10-5 )
3.1 3.5 6.3 0.8 11.3 1.5
Activation
Energy 22.43 49.73
Evaluation of the Models
To describe swelling kinetics of the SAP balls at different temperatures (20, 30, and 60 0C), the three empirical models, namely, Peleg’s, first order, and exponential association equation, are used and out of them the Peleg’s model provide good agreement with experimental data. The kinetic rate constants k1, k2, R2 values are given in
[image:4.595.46.275.151.268.2]Table 3 for different diameters at different temperatures. Where the constants k1 and k2 are the intercept and slope of the line obtained by the graph of x as shown in Figure 10.
[image:4.595.34.542.429.777.2] [image:4.595.323.539.519.636.2]© 2016, IRJET | Impact Factor value: 4.45 | ISO 9001:2008 Certified Journal | Page 1805
Table 3: Values of rate constants and R2for 1mm and
3mm at different temperatures
Parameters 1mm 3mm Temperatur
e (0C) 20 30 60 20 30 60 Intercept
(k1) 20.76 8.34 4.56 9.012 8.344 6.730 Slope (k2) 0.488 0.16 0.53 0.057 0.087 0.069
R2 0.5
76 0.79 0.90 0.431 0.976 0.962
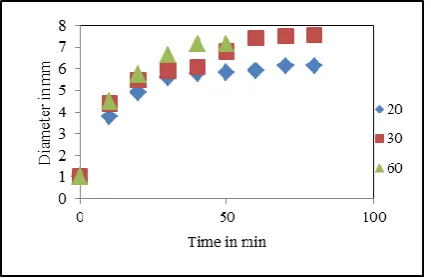
Effect of Initial Size and Water Temperature on Diameter of the SAP balls
The change in diameter of SAP balls were measured after specific time interval, for 1mm and 3mm diameter at different water temperature as shown in Figure 11 and 12.
Figure 11: Change in diameter of 3mm SAP balls at different temperatures
Figure 12: Change in diameter of 1mm SAP balls at different temperatures
Results of Desorption
Change in Weight of SAP balls
[image:5.595.317.547.309.435.2]The change in weight of SAP during Desorption i.e. drying of SAP with respect to time is shown in Figure 13.
Figure 13: Desorption of SAP with respect to time
Change in Diameter of SAP balls
[image:5.595.50.273.329.469.2]The change in diameter of SAP balls were measured after specific time interval at atmospheric temperature and it is plotted as shown in Figure 14.
Figure 14: Change in Diameter with respect to time
CONCLUSIONS
From the study, it is concluded that SAP is smart material. It has a very high water absorption capacity by its own weight, which helps in improving soil moisture capacity and hence reduces the water stress on the plant during irrigation intervals. SAP is also employed in hygienic uses for diapers, napkins etc. According to the results shown the size and weight of the SAP material is increases with respect to time. The absorption is higher at higher temperature of water. After the temperature of 60 0C SAP’s have shrunk by giving their absorbed water. The swelling rate and effective diffusivity increases with increase in water temperature. To obtain the water content uptake as a swelling time, three different models were studied, out of which Peleg model has provided good agreement with experimental data. Therefore, this model is chosen to represent the swelling kinetics of SAP balls.
REFERENCES
[image:5.595.36.252.507.646.2]© 2016, IRJET | Impact Factor value: 4.45 | ISO 9001:2008 Certified Journal | Page 1806 Processing and Preservation, vol. 33, no.
5,pp.618–634,2009
2) Francesco f. Montesano, Biodegradable Superabsorbent Hydrogel Increases Water Retention Properties of Growing Media and Plant Growth, Institute of Science of Food Production, National Research Council, Italy-2015, 451-458.
3) K. G. Kaptso, Y. N. Njintang, A. E. Komnek, J. Hounhouigan, J. Scher, and C. M. F. Mbofung, Physical properties and rehydration kinetics of two varieties of cowpea (Vignaunguiculata) and bambara groundnuts (Voandzeiasubterranea) seeds, Journal of Food Engineering, vol.86, no.1, pp. 91–99, 2008.
4) K. Gornicki, A. Kaleta, R. Winiczenko, Chapter 16: some remarks on modeling of mass transfer kinetics during rehydration of dried fruits and vegetables engineering, in Mass Transfer—Advances in Sustainable Energy and Environment Oriented Numerical Modeling, H. Nakajima, Ed., 2013.
5) M. Bohning, N. Hao, and A. Schonhals, Correlation of activation energies of gas diffusivity and local matrix mobility in polycarbonate/POSS nano composites, Journal of Polymer Science B: Polymer Physics, vol.51, no.22, pp.1593–1597, 2013.
6) M. Noshad, M. Mohebbi, F. Shahidi, and S. A. Mortazavi, Kinetic modeling of rehydration in air-dried quinces pretreated with osmotic dehydration and ultrasonic, Journal of Food Processing and Preservation, vol. 36, no. 5, pp. 383–392, 2012.
7) M. Peleg, An empirical model for the description of moisture sorption curves, Journal of Food Science, vol.53, no.4, pp.1216– 1217, 1988.
8) N. A. Peppas, P. Bures, W. Leobandung, and H. Ichikawa, Hydrogels in pharmaceutical formulations, European Journal of Pharmaceutics and Bio-pharmaceutics, vol. 50, pp. 27–46, 2000.