© 2016, IRJET | Impact Factor value: 4.45 | ISO 9001:2008 Certified Journal | Page 822
Seismic Analysis of Steel Plate Shear Walls with
Holes
Aswin Sasidharan
M Tech student, Department of Civil Engineering Mar Baselios Institute of Technology &Science
Nellimattom, Kerala, (India) aswints92@gmail.com
Abstract—Steel plate shear walls (SPSWs) in buildings are known to be an effective means for resisting lateral forces. By using un-stiffened walls and allowing them to buckle, their energy absorption capacity will increase significantly due to the post-buckling capacity. The nonlinear behaviour of steel shear walls with openings were studied in this paper. This analytical study was conducted to compare the force-displacement curves, initial stiffness and ultimate strength of corrugated steel shear walls. Nonlinear finite element analyses were conducted using ANSYS. The effect opening shapes were studied. The opening shapes considered in this study are diamond, hexagonal and circular shape.
Index Terms—Steel Plate Shear Wall, FE Analysis, Ansys, Opening Shape
INTRODUCTION
Reinforced concrete shear walls have been widely used as lateral load resisting system in concrete buildings in the past, especially in high-rise buildings. In steel buildings, in most cases concrete shear walls are used with a perimeter steel moment frame to resist seismic effects. However, tension cracks and compression crushing failures in a concrete shear wall can result in spalling and splitting failure of the wall, and lead to serious deterioration of stiffness and reduction of energy-dissipation capacity. Furthermore, the casting and curing of concrete wall makes the construction not so efficient compared to other systems such as braced frames or moment frames. In recent years, more attention has been paid to steel shear walls that could be constructed economically and efficiently in high rise buildings. Seismic behaviour of this system and the design guidelines for them are therefore of high interest. Steel shear wall is a possible option for seismic resistance of these structures.
A steel shear wall frame consists of column and beam elements augmented by steel infill shear panels, provided over the height of a framing bay. Steel plates can be welded or bolted to the boundary frame. Stiffened and un-stiffened thin steel plate shear walls (TSPSWs) have been introduced primary as a lateral load resisting elements in several
buildings. In early applications of steel plate shear walls, the walls had vertical and horizontal stiffeners. Welding stiffeners can be costly as well as time consuming. In recent years, the research and testing of specimens have indicated that using post-buckling tension field action of un-stiffened SPSWs leads to very ductile and efficient steel walls.
MODELLING
The nonlinear analysis of steel plate shear walls are performed based on the finite element method employing a general nonlinear finite element commercial code ANSYS.
The finite element model is generated using the two types of elements. Shell element SHELL 181 and BEAM 188. SHELL 181 is defined by four nodes, with six degrees of freedom at each node: translations in the x, y, and z directions, and rotations about the x, y, and z-axes. Shell 181 is well-suited for linear, large rotation, and/or large strain nonlinear applications and suitable for analysing thin to moderately-thick shell structures. BEAM188 is suitable for analysing slender to moderately stubby/thick beam structures. The element is based on Timoshenko beam theory which includes shear-deformation effects. The element provides options for unrestrained warping and restrained warping of cross-sections. The element is a linear, quadratic, or cubic two-node beam element in 3-D. BEAM188 has six or seven degrees of freedom at each node. These include translations in the x, y, and z directions and rotations about the x, y, and z directions. A seventh degree of freedom (warping magnitude) is optional. This element is well-suited for linear, large rotation, and/or large strain nonlinear applications.
© 2016, IRJET | Impact Factor value: 4.45 | ISO 9001:2008 Certified Journal | Page 823 Shear wall with three shapes of holes are considered for
the study. The three shapes are: circular, rectangular and hexagon. The structural configurations of the model are given. Fixed end conditions are given to the column and the shear wall in the bottom.
Thickness of shear wall= 9mm Height of building= 15m Size of beam=100mmx100mm Size of column=100mmx100mm Length of beam=3m
Height of column=3m
Model Description
Model 1 (Circular)
Radius=47mm, Length of outer hole=101.94mm Model 2
(Rectangular) Large =94mm Small=55mm Model 3
[image:2.595.340.528.96.247.2](Hexagon) Square=55mm Side=38mm
[image:2.595.64.264.256.381.2]Table 1 Model configurations
Fig. 1.Finite element model of shear wall
BOUNDARY CONDITIONS AND APPLICATION OF LOAD
The boundary conditions used for the project work are the fixed condition. Fixed end conditions are given to the column and the shear wall in the bottom and gravity is applied in the downward directions.
Fig. 2 Boundary conditions
[image:2.595.312.555.273.431.2]El Centro earthquake data were used in the project work for analyzing the seismic responds of the models.
Fig. 3 El Centro east west direction
MODE SHAPE
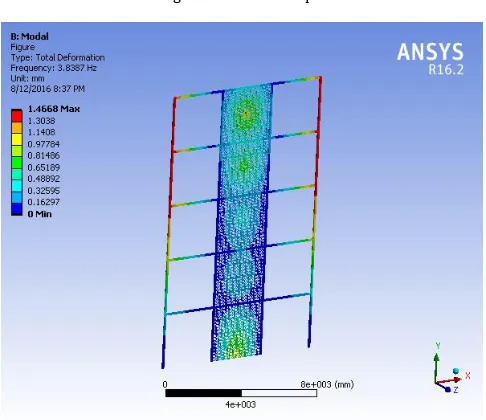
[image:2.595.69.260.411.557.2]In the seismic analyse of the structure six mode shape were chosen the mode shape of the second model shear wall is as follows.
[image:2.595.326.540.524.699.2]© 2016, IRJET | Impact Factor value: 4.45 | ISO 9001:2008 Certified Journal | Page 824 Fig. 5. Second mode shape
Fig. 6.Third mode shape
[image:3.595.51.277.290.684.2]Fig. 7. Fourth mode shape
Fig. 8. Fifth mode shape
Fig. 9.Sixth mode shape
MESHING
The proper mesh size was needed to obtain the precise result with less load of the work. The mesh length used for the model is 8.38 mm.
VI.FINITE ELEMENT ANALYSIS AND RESULTS
[image:3.595.312.555.297.507.2]© 2016, IRJET | Impact Factor value: 4.45 | ISO 9001:2008 Certified Journal | Page 825
A.Model 1
[image:4.595.337.548.99.206.2]The first model was made with circular patterns of holes with some opening around each circle. The circles are made with a radius of 47mm. The thickness of the shear wall is 9 mm. The spline geometry around the circular shaped holes are 101.94 mm long.
Fig. 10. Geometry of model 1
VII.STRESS ON SHEAR WALL
[image:4.595.76.252.186.340.2]The stress diagram is plotted after the application of the self-weight and after the transient analyse. The following figures discuss about the variation of the stress in the first model after the application of the self-weight and after the application of transient analyse.
Fig. 11 Stress after transient analyse
Fig. 12 Stress graph after transient analyse
The stress graph after transient analyse is shown above. We can see a variation of the stress distribution on the shear wall during the analyse. The maximum stress of 108.07 Mpa was experienced by the shear wall after 20 seconds and before 25 seconds.
VIII.DEFORMATION
[image:4.595.330.535.356.514.2]The total deformation occurred on the shear wall after the transient analyse is plotted and the deformation on the shearwall due to the self-wait was also plotted.
[image:4.595.62.266.450.604.2]Fig. 13 Total deformation in Transient analyse.
[image:4.595.313.555.551.677.2]© 2016, IRJET | Impact Factor value: 4.45 | ISO 9001:2008 Certified Journal | Page 826 During the transient analyse there is variations in the
deformation of the shear wall. The maximum deformation of 689.93 mm is observed after 21 seconds. The deformation is quite small.
B.Model 2
[image:5.595.334.553.100.207.2]The second model was made with two square patterns of holes. Both of them are square in shape and with two dimensions.
Fig. 15. Geometry of model 2
IX.STRESS ON SHEAR WALL
[image:5.595.321.532.384.548.2]The stress diagram is plotted after the application of the self-weight and after the transient analyse. The following figures discuss about the variation of the stress in the first model after the application of the self-weight and after the application of transient analyse.
Fig. 16 Stress after transient analyse
Fig. 17 Stress graph after transient analyse
The stress graph after transient analyse is shown above. We can see a variation of the stress distribution on the shear wall during the analysis. The maximum stress of 4231.8Mpa was experienced by the shear wall after 37 seconds.
X.DEFORMATION
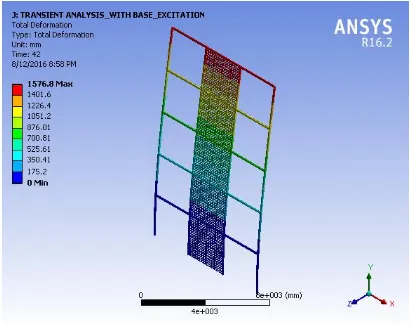
The following diagram shows the total deformation occurred during the transient analyse .the graph is plotted using the obtained results.
[image:5.595.75.267.517.666.2]© 2016, IRJET | Impact Factor value: 4.45 | ISO 9001:2008 Certified Journal | Page 827 Fig. 18 Total deformation
During the transient analyse there is variations in the deformation of the shear wall. The maximum deformation of 3996.7 mm is observed after 32seconds. The deformation is larger than the first. It is unstable
C. Model 3
[image:6.595.60.270.249.431.2]The third model was made with hexagonal patterns of holes with small square patterns. The hexagon is made with a side length of 94mm and a side length of 55mm for the smaller square. The thickness of the shear wall is 9 mm.
Fig. 19 Third model
XI.STRESS ON SHEAR WALL
[image:6.595.330.535.433.595.2]The stress diagram is plotted after the application of the self-weight and after the transient analyse. The following figures discuss about the variation of the stress in the first model after the application of the self-weight and after the application of transient analyse.
Fig. 20 Stress after transient analyse
Fig.21 Stress graph after transient analyse
The stress graph after transient analyse is shown above. We can see a variation of the stress distribution on the shear wall during the analysis. The maximum stress of 536.08Mpa was experienced by the shear wall after 12 seconds.
XII.DEFORMATION
The following diagram shows the total deformation occurred during the transient analyse .the graph is plotted using the obtained results.
[image:6.595.55.274.522.690.2]© 2016, IRJET | Impact Factor value: 4.45 | ISO 9001:2008 Certified Journal | Page 828 Fig. 23 Total deformation
XIII.RESULTS
a) VON MISES STRESS VARIATION
A large difference in the stress distribution during the transient analyse is observed for different models. The following graph shows the comparison of the stress distributions for all three type of shearwall model.
Fig. 24 Comparison of stress distribution
The first model has a maximum stress of 108.07 Mpa at 21 seconds.
Second model have a maximum stress of 4231.8 Mpa at 37 seconds.
Third model have a maximum stress of 536 Mpa at 12 seconds.
First model have the least stress among the three. Second model have the maximum stress among
the three.
The third model has a moderate stress.
Third model took the minimum time to experience maximum stress.
The difference in the stress concentration for each model is the reason for the result.
DEFORMATION
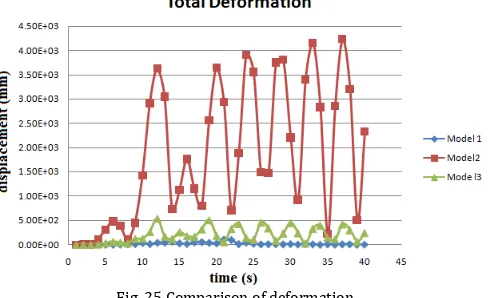
[image:7.595.314.558.247.396.2]As the three models have different stress values from analyse the deformation occurred for each of the three models are also different. The three models shows a very large variation in the deformation when they are plotted in the graph. The following graph shows the comparison of the deformation occurred to the three models of shear wall.
Fig. 25 Comparison of deformation.
The first model has a maximum deformation of 689mm at 21 seconds.
The second model has a maximum deformation of 3996.7 mm at 33 seconds.
The third model has a maximum deformation of 2907.4mm at 12 seconds.
First model with circular shape holes deformed the least of the three models.
Second model have the maximum value of deformation than the two other models.
Third model have moderate deformation.
Third model took the least time to attain maximum value of deformation.
Second and third models are instable.
VII.CONCLUSIONS
The model analyses of three models were carried out to study the seismic response of the shear wall with different shapes of holes and the following conclusion is obtained from the analyses.
[image:7.595.40.285.395.530.2]© 2016, IRJET | Impact Factor value: 4.45 | ISO 9001:2008 Certified Journal | Page 829 of stress concentration helped the first model to perform
well.
The second model showed the maximum value of deformation and stress. It also shows that the model was instable. The uneven stress concentration on the shape resulted in its underperformance.
The third model shown the values lesser than that of the second shape but it was more than the first model. But maximum deformation was obtained with less time. Thus the shear wall with hexagonal shape proved that it will get affected very quickly but it is not damaged as the second shear wall.
ACKNOWLEDGMENT
I express my deepest sense of gratitude to my esteemed guide, Mr. Jobil Varghese, Asst. Professor, MBITS, Nellimattom, my cordial thanks for his warm encouragement, thoughtful guidance, insightful decision, critical comments and correction of the thesis. I also express my sincere thanks to all the faculty members and students of the Civil Engineering Department of Mar Baselios Institute of Technology and Science for their co-operation and support.
REFERENCES
[1]H.-C. Guo et al., Behaviour of stiffened and unstiffened steel plate shear walls considering joint properties, Thin-Walled Structures 97:53–62 (2015)
[2]Alireza Farzampourand Mohammad Yekrangnia, Behavior of corrugated steel shear walls with and without openings, Second European conference on earthquake engineering and seismology, Istanbul (2014)
[3]E.B. Machalyetal, Numerical investigation on ultimate shear strength of steel plate shear walls, Thin-WalledStructures84:78–90 (2014)
[4]A. Jahanpour et al., Seismic behaviour of semi-supported steel shear walls, Journal of Constructional Steel Research 74 : 118–133 (2012)
[5]Jeffrey W. Berman, Seismic behavior of code designed steel plate shear walls, Engineering Structures 33 : 230– 244 (2011)
[6]M. Lashgari,Finite element analysis of thin steel plate shear walls, World Academy of Science, Engineering and Technology, International Journal of Civil, Environmental, Structural, Construction and Architectural Engineering Vol:3, No:10, (2009)
[7]M. Wang et al., Seismic behaviours of steel plate shear wall structures with construction details and materials,
Journal of Constructional Steel Research 107 : 194–210 (2015)
[8]M. Wang et al., Experimental and numerical study of unstiffened steel plate shear wall structures, Journal of Constructional Steel Research 112 : 373–386 (2015) [9]D. Dubina, F. Dinu, Experimental evaluation of dual
frame structures with thin-walled steel panels, Thin-Walled Structures 78 : 57–69 (2014)