© 2016, IRJET ISO 9001:2008 Certified Journal
Page 662
Comparing and Optimizing the Process Parameters of two types of
Al-MMC’s in Turning
Shaik Noor Ahamed
1, PG Scholar
, Department of Mechanical Engineering, MREC, Hyderabad, India.
K.Rajesh
2, Assistant Professor, Department of Mechanical Engineering, MREC, Hyderabad, India
.---***---Abstract -
Aluminium Metal Matrix Composites (Al MMC’s)are the nearby elements which can replace conventional materials which are in use. Al MMC’s, now gained the space in applications such as aerospace, structural members, automotive, ship buildings etc because of their properties like high strength to weight ratio, hardness, stiffness and corrosion resistance. This paper presents an investigation on machining (Turning) of Al (6061)-SiC and Al (6063)-SiC MMC’s. SiC particles are reinforced in Al matrix with 0%, 10%, and 20% by weight. Taguchi’s L27 orthogonal array experimentation was used to optimize the parameters of Al-SiC MMC’s. The effect of parameters such as Speed, Feed, Depth of cut and Percentage of contribution on Metal Removal Rate and Cutting Force in turning was calculated. Signal to Noise ratio and ANOVA was used for finding significant parameter. Required comparisons are done between two Al MMC’s. The experiments are conducted using HSS tool under dry condition. A Taguchi analysis is carried out. The effect of parameters is studied and presented.
Key Words: Signal to Noise ratio, ANOVA, metal removal rate, cutting Force.
1. INTRODUCTION
Frequent use of modern materials for the required applications in the present scenario, made clear that a quality product at the end is necessary, after performing the machining operations on the work piece. Therefore quality is an important part of production. Machining operations are performed in the process to achieve the required output, so now product’s quality depends on the operations performed on the product. Turning is the operation performed for metal removal in most applications, as it can give a good surface finish. Volume of metal removed from a cylindrical work piece per unit time is called as metal removal rate and highest metal removal rate is expected from turning operation, so that it leads to reduced cost and highest production. The cutting tool feeds into the rotating work piece and cuts away material in the form of small chips to create the desire shape.
Problems associated with machining of MMC’s should be minimised if these materials need to be used extensively. Here in this paper study of effects of process parameters such as speed, feed, depth of cut and percentage of composition on metal removal rate and cutting force in
turning of Al MMCs is calculated. Taguchi methods are statistical methods developed by Genichi Taguchi to improve the quality of manufactured goods and more recently also applied to engineering.
Design of experiments or Taguchi’s technique is used to complete the objective and generate the optimised value. Here L27 orthogonal array was used for conducting the experiments and ANOVA was employed to analyze the percentage contribution and influence of process parameters. Taguchi’s technique was found using Minitab 17 software.
2. METHODOLOGY
In this paper, the machining parameters are determined by using Taguchi’s design method. Orthogonal arrays of Taguchi, the signal-to-noise (S/N) ratio, the analysis of variance (ANOVA), and regression analysis are used to get the optimal levels and to analyze the effect of the machining parameters on material removal rate & cutting force.
2.1 TAGUCHI METHOD
Taguchi has developed a methodology for the application of factorial design experiments that has taken the design of experiments from the exclusive world of the statistician and brought it more fully into the world of manufacturing [1].Thus the marriage of design of experiments with optimization of control parameters to obtain best results is achieved in Taguchi method. Orthogonal arrays provide a set of well balanced experiments & desired output. [2]
Conventional procedures need more number of experiments to be performed, when more number of parameters increased, this issue is resolved by Taguhci method, it uses special design to study the parameters with small number of experiments. Saving time, cost and finding significant factors at more ease. Taguchi uses the S/N ratio to measure the quality characteristic deviating from the desired value. There are several S/N ratios available, depending on the type of characteristic; lower the better, nominal the best or higher the better.
© 2016, IRJET ISO 9001:2008 Certified Journal
Page 663
(1)
The S/N ratio for the lower-the-better criterion is given by Taguchi as:
(2)
Where ‘y’ is the observed data and ‘n’ is the number of observations.
Regardless of the category of the performance characteristics, a greater S/N value corresponds to a better performance. Therefore, the optimal level of the machining parameters is the level with the great S/N ratio value [10].
2.2 ANALYSIS OF VARIANCE (ANOVA)
ANOVA is a statistical process in which the existence of differences among several population means determined. While the aim of ANOVA is the detect differences among several populations means, the technique requires the analysis of different forms of variance associated with the random samples under study-hence the name analysis of variance. The relative influence of the parameters is measured by total sum of square value (SST) and is given by:
(3)
Where n is the number of experiments in the orthogonal array, ni is the mean S/N ratio for the ith experiment and nm is the total mean S/N ratio of all experiments.
2.3 REGRESSION ANALYSIS
A statistical tool that allows you to examine how multiple independent variables are related to a dependent variable. Once you have identified how these multiple variables relate to your dependent variable, you can take information about all of the independent variables and use it to make much more powerful and accurate predictions about why things are the way they are. It is also used to understand which among the independent variables are related to the dependent variable and to explore the forms of these relationships. The general form of a multiple regression model is as follows:
Independent variable = b0 + b1 (Independent variable 1) + b2 (Independent variable 2) + … +ε. (4) Where b1, b2 … are estimates of the independent variables 1, 2 … and ε is the error.
3. EXPERIMENTAL WORK
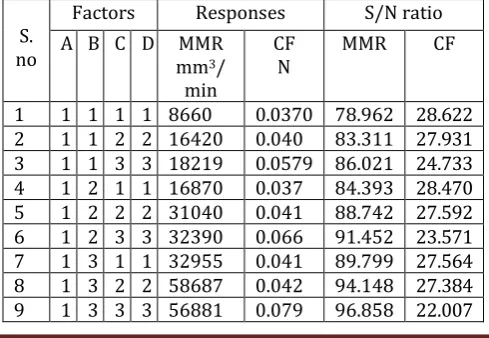
Samples of 30mm dia and 30cm length of Al (6061)-SiC and Al (6063)-SiC composites with 0%, 10% and 20% weight of SiC are fabricated by stir casting method [12].
Experiments are conducted on lathe based on Taguchi’s design of experiments. Speed, feed and depth of cut values are controllable and are maintained nominal, thus preventing harm to the machine. Machining criteria also depends on the work piece density, with increasing the percentage of reinforcement in composites the density too varies. Therefore to study the effect of percentage of reinforcement on machining criteria, SiC is varied from 0%-20% by weight in Al-SiC composites. The factors to be studied and their levels are given in Table 1. Tool used for machining is High speed steel. The observations (MMR and Cutting force) are made by changing speed, feed, depth of cut and percentage of reinforcement. Figure 1 & 2 shows the prepared work pieces of Al (6061)-SiC and Al (6063)-SiC respectively. Table 2 & Table 3 lists Taguchi’s L27 orthogonal array, the measured values of responses and the S/N ratios of both Al MMC’s.
Metal Removal Rate, MMR = π*Davg*d*f*N (5) Where Davg = (Di +Df) /2
Di=Intial dia of rod Df=Final dia of rod d= depth of cut f= feed
N= spindle speed
Cutting force, CF= (Torque)/Davg (6)
Where Torque = (Power consumed)/ω
[image:2.595.312.557.607.776.2]ω = 2Πn
Table 1. Factors and their levels
Symbol Factors Level
1 Level 2 Level 3
A Speed (rpm) 315 500 775
B Feed
(mm/rev) 0.71 1.42 2.85
C Depth of cut
(mm) 0.4 0.8 1.2
D % of
reinforcement 0 10 20
Table 2. L27 orthogonal array for Al 6061-SiC
S. no
Factors Responses S/N ratio A B C D MMR
mm3/ min
CF
N MMR CF
© 2016, IRJET ISO 9001:2008 Certified Journal
Page 664
10 2 1 1 2 11068 0.034 82.472 29.272 [image:3.595.40.292.101.323.2]11 2 1 2 3 23921 0.029 87.472 30.690 12 2 1 3 1 36952 0.0297 90.039 30.532 13 2 2 1 2 21422 0.0326 87.903 29.732 14 2 2 2 3 44986 0.0328 92.903 29.675 15 2 2 3 1 67478 0.0320 95.47 29.877 16 2 3 1 2 41561 0.0334 93.309 29.508 17 2 3 2 3 84555 0.0366 98.308 28.713 18 2 3 3 1 122534 0.0357 100.87 28.940 19 3 1 1 3 20476 0.0219 85.487 33.185 20 3 1 2 1 28777 0.0256 90.344 31.814 21 3 1 3 2 44825 0.0311 92.404 30.124 22 3 2 1 3 39844 0.0196 90.918 34.122 23 3 2 2 1 53126 0.0241 95.775 32.336 24 3 2 3 2 79689 0.0359 97.835 28.892 25 3 3 1 3 77748 0.0175 96.324 35.092 26 3 3 2 1 97740 0.0291 101.18 30.704 27 3 3 3 2 139946 0.0449 103.24 26.942
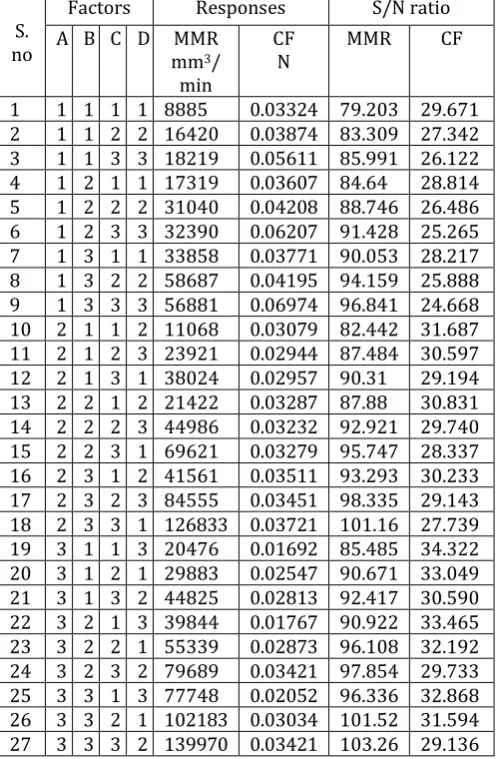
Table 3. L27 orthogonal array for Al 6063-SiC
S. no
Factors Responses S/N ratio
A B C D MMR mm3/ min
CF
N MMR CF
1 1 1 1 1 8885 0.03324 79.203 29.671 2 1 1 2 2 16420 0.03874 83.309 27.342 3 1 1 3 3 18219 0.05611 85.991 26.122 4 1 2 1 1 17319 0.03607 84.64 28.814 5 1 2 2 2 31040 0.04208 88.746 26.486 6 1 2 3 3 32390 0.06207 91.428 25.265 7 1 3 1 1 33858 0.03771 90.053 28.217 8 1 3 2 2 58687 0.04195 94.159 25.888 9 1 3 3 3 56881 0.06974 96.841 24.668 10 2 1 1 2 11068 0.03079 82.442 31.687 11 2 1 2 3 23921 0.02944 87.484 30.597 12 2 1 3 1 38024 0.02957 90.31 29.194 13 2 2 1 2 21422 0.03287 87.88 30.831 14 2 2 2 3 44986 0.03232 92.921 29.740 15 2 2 3 1 69621 0.03279 95.747 28.337 16 2 3 1 2 41561 0.03511 93.293 30.233 17 2 3 2 3 84555 0.03451 98.335 29.143 18 2 3 3 1 126833 0.03721 101.16 27.739 19 3 1 1 3 20476 0.01692 85.485 34.322 20 3 1 2 1 29883 0.02547 90.671 33.049 21 3 1 3 2 44825 0.02813 92.417 30.590 22 3 2 1 3 39844 0.01767 90.922 33.465 23 3 2 2 1 55339 0.02873 96.108 32.192 24 3 2 3 2 79689 0.03421 97.854 29.733 25 3 3 1 3 77748 0.02052 96.336 32.868 26 3 3 2 1 102183 0.03034 101.52 31.594 27 3 3 3 2 139970 0.03421 103.26 29.136
Figure 1. Al 6061-SiC
Figure 2. Al 6063-SiC
4. ANALYSIS OF EXPERIMENTAL RESULTS
After conducting 27 experiments each on Al 6061-SiC and Al 6063-SiC composites, performance evaluation and the effects of process parameters on metal removal rate and cutting force is studied.
4.1 ANALYSIS OF SIGNAL TO NOISE RATIO
Metal removal rate and cutting force values are obtained by equation (5) & (6) respectively and there signal to noise ratio values are calculated by equation (1) & (2) respectively.
4.1.1 Metal removal rate
[image:3.595.38.287.358.738.2]© 2016, IRJET ISO 9001:2008 Certified Journal
Page 665
Table 4. Response Table for SN Ratios for Al 6061-SiCLevel Speed Feed D.O.C % reinforcement of 1 88.19 86.28 87.73 91.87
2 92.08 91.71 92.46 91.49
3 94.83 97.12 94.91 91.75
Delta 6.65 10.84 7.18 0.39
Rank 3 1 2 4
[image:4.595.47.277.118.333.2]Chart-1: Main effects plot for SN ratios for Al 6061-SiC
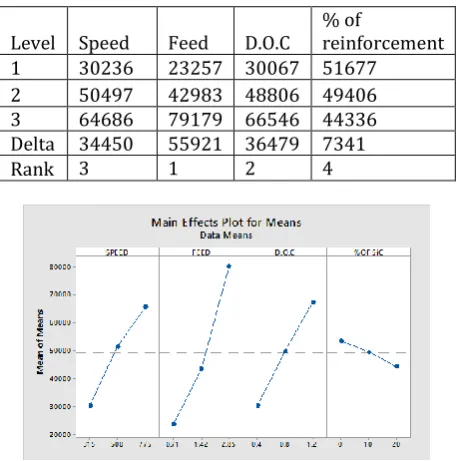
Table 5. Response table for means for Al 6061-SiC
Level Speed Feed D.O.C % of reinforcement 1 30236 23257 30067 51677 2 50497 42983 48806 49406 3 64686 79179 66546 44336 Delta 34450 55921 36479 7341
Rank 3 1 2 4
Chart-2: Main effects plot for means for Al 6061-SiC
Table 6. Response Table for SN Ratios for Al 6063-SiC
Level Speed Feed D.O.C % of
reinforcement
1 88.26 86.37 87.81 92.16
2 92.17 91.81 92.58 91.49
3 94.95 97.22 95 91.75
Delta 6.69 10.85 7.20 0.67
Rank 3 1 2 4
[image:4.595.320.549.298.529.2]Chart-3: Main effects plot for SN ratios for Al 6063-SiC
Table 7. Response table for means for Al 6063-SiC
Level Speed Feed D.O.C % of reinforcement 1 30236 23257 30067 51677 2 50497 42983 48806 49406 3 64686 79179 66546 44336 Delta 34450 55921 36479 7341
Rank 3 1 2 4
Chart-4: Main effects plot for means for Al 6063-SiC
4.1.2 CUTTING FORCE
The cutting force response table for each level of machining parameters (speed, feed, D.O.C & % of SiC) is obtained and results are presented in Table 8 for Al 6061-SiC and in Table 10 for Al 6063-SiC. Optimal levels at which optimal values can be obtained are darkened in the tables. Chart 6 and 8 shows the effect of process parameters on cutting force in Al MMC’s. Previous researchers stated that the factors affecting the cutting force are the feed rate and spindle speed [9].
[image:4.595.48.277.388.624.2]© 2016, IRJET ISO 9001:2008 Certified Journal
Page 666
Table 8. Response Table for SN Ratios for Al 6061-SiCLevel Speed Feed D.O.C % reinforcement of 1 26.43 29.66 30.62 29.87
2 29.66 29.36 29.65 28.60
3 31.47 28.54 27.29 29.09
Delta 5.04 1.12 3.33 1.28
Rank 1 4 2 3
[image:5.595.47.277.117.339.2]Chart-5: Main effects plot for SN ratios for Al 6061-SiC
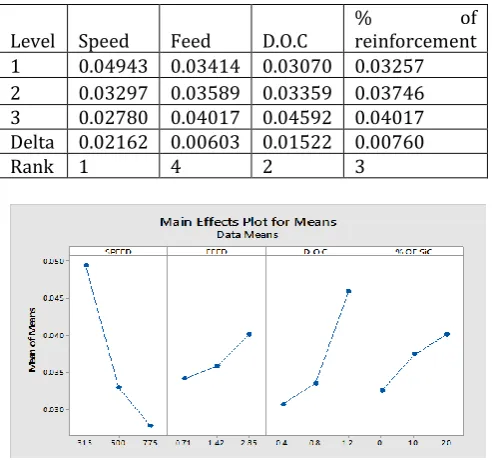
Table 9. Response table for means for Al 6061-SiC
Level Speed Feed D.O.C % reinforcement of 1 0.04943 0.03414 0.03070 0.03257 2 0.03297 0.03589 0.03359 0.03746 3 0.02780 0.04017 0.04592 0.04017 Delta 0.02162 0.00603 0.01522 0.00760
Rank 1 4 2 3
Chart-6: Main effects plot for means for Al 6061-SiC
Table 10. Response Table for SN Ratios for Al 6063-SiC
Level Speed Feed D.O.C % reinforcement of 1 26.94 30.29 31.12 29.87
2 29.72 29.43 29.56 29.10
3 31.88 28.83 27.87 29.58
Delta 4.94 1.45 3.26 0.76
Rank 1 3 2 4
[image:5.595.313.556.304.549.2]Chart-7: Main effects plot for SN ratios for Al 6063-SiC
Table 11. Response table for means for Al 6063-SiC
Level Speed Feed D.O.C % reinforcement of 1 0.04642 0.03205 0.02899 0.03235 2 0.03274 0.03543 0.03374 0.03535 3 0.02625 0.03793 0.04268 0.03771 Delta 0.02017 0.00588 0.01368 0.00535
Rank 1 3 2 4
..
Chart-8: Main effects plot for means for Al 6063-SiC
4.2
ANALYSIS OF VARIANCE (ANOVA)
4.2.1 METAL REMOVAL RATE
[image:5.595.31.278.398.628.2]© 2016, IRJET ISO 9001:2008 Certified Journal
Page 667
Table 12. ANOVA for MMR for Al 6061-SiCSourc
e DF SS MS F-valu
e
Pr (%)
Speed 2 5395912
165 2697956082 14.42 18.29
Feed 2 1447930
5580 7239652790 38.70 49.10 D.O.C 2 5989751
197 2994875598 16.01 20.31 % of
SiC 2 254288630 127144315 0.68 0.86 Error 18 3367574
028 187087446 Total 26 2948683
[image:6.595.42.281.337.519.2]1599
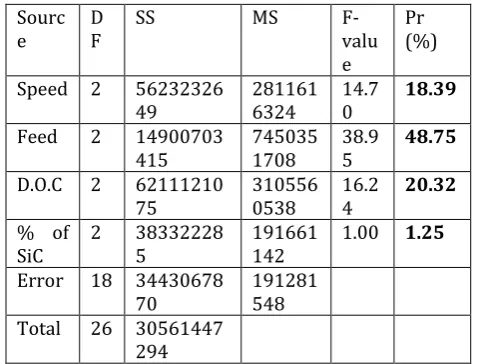
Table 13. ANOVA for MMR for Al 6063-SiC
Sourc
e DF SS MS F-valu
e
Pr (%)
Speed 2 56232326
49 2811616324 14.70 18.39 Feed 2 14900703
415 7450351708 38.95 48.75 D.O.C 2 62111210
75 3105560538 16.24 20.32 % of
SiC 2 383322285 191661142 1.00 1.25 Error 18 34430678
70 191281548 Total 26 30561447
294
4.2.2 CUTTING FORCE
Table 14 and 15 shows the ANOVA results for CF values. During machining of composites, each factor has its own significance on the CF. Darkened values in tables show their respective effects in percentage wise. Results shows speed is the effective parameter which effects in both composites.
Table 14. ANOVA for CF for Al 6061-SiC
Sourc
e DF SS MS F-valu
e
Pr (%)
Speed 2 0.00229
6 0.001148 25.15 48.51 Feed 2 0.00017
3 0.000087 1.90 3.65 D.O.C 2 0.00117
6 0.000588 12.88 24.84
% of
SiC 2 0.000267 0.000133 2.92 5.64 Error 18 0.00082
1 0.000046
Total 26 0.00473 3
Table 15. ANOVA for CF for Al 6063-SiC
Sourc
e DF SS MS F-valu
e
Pr (%)
Speed 2 0.00190
8 0.000954 29.45 52.33 Feed 2 0.00015
7 0.000078 2.42 4.30 D.O.C 2 0.00086
9 0.000434 13.41 23.83 % of
SiC 2 0.000130 0.000065 2.00 3.56 Error 18 0.00058
3 0.000032
Total 26 0.00364 6
4.3 REGRESSION ANALYSIS
A correlation between machining process parameters and machining criteria for machining of Al MMC’s are obtained by multiple linear regressions. MINITAB software package is used to develop these relations or models.
4.3.1 REGRESSION ANALYSIS FOR MMR
Equation below is for Al 6061-SiC
MMR = -66259 + 73.1 (SPEED) + 26013 (FEED) + 45599 (D.O.C) - 367 (% OF SiC) (7)
Equation below is for Al 6063-SiC
© 2016, IRJET ISO 9001:2008 Certified Journal
Page 668
4.3.2 REGRESSION ANALYSIS FOR CF
Equation below is for Al 6061-SiC
CF= 0.03676-0.00045 (SPEED) +0.00284 (FEED) +0.01902 (D.O.C) +0.000380 (% OF SiC) (9)
Equation below is for Al 6063-SiC
CF=0.03687- 0.000042 (SPEED) + 0.00260 (FEED) + 0.01710 (D.O.C) + 0.000268 (%OF SiC) (10)
Table 16. Optimum sequence for MMR in Al 6061-SiC
Speed Feed D.O.C % of
SiC MMR
775 2.85 1.2 10 139946
Table 17. Optimum sequence for MMR in Al 6063-SiC
Speed Feed D.O.C % of SiC MMR
775 2.85 1.2 10 139970
Table 18. Optimum sequence for CF in Al 6061-SiC
Speed Feed D.O.C % of
SiC CF
775 2.85 0.4 20 0.0175
Table 19. Optimum sequence for CF in Al 6063-SiC
Speed Feed D.O.C % of SiC CF
775 0.71 0.4 20 0.01692
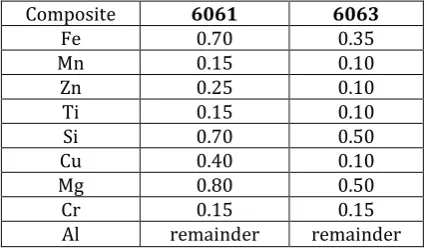
[image:7.595.55.269.567.691.2]5. COMPARING AL 6061 SIC AND AL 6063
Table 20. Compositions of elements in Al 6061 & Al 6063
Composite 6061 6063
Fe 0.70 0.35
Mn 0.15 0.10
Zn 0.25 0.10
Ti 0.15 0.10
Si 0.70 0.50
Cu 0.40 0.10
Mg 0.80 0.50
Cr 0.15 0.15
Al remainder remainder
Elements present in Al 6061-SiC and Al 6063-SiC is as described above.
Comparison between Al MMC’s is done according to the results obtained in analysis of experiments in this study.
In analysis of SN ratios for MMR, Tables 4 & 6 shows the ranks allotted to the parameters according to their significant effect. A much alike similarity is observed in between them.
Chart 2 & 4 shows the behavior of MMR with respect to process parameters selected and it confirms that major similarity occurs between them.
In analysis of SN ratio for CF, Tables 8 & 10 shows the ranks of parameters. It shows some what difference in the ranks comparing between them, but speed remaining the major factor to affect the CF.
Chart 6 & 8 shows the behavior of CF with respect to process parameters, a slight difference occurs between them.
In analysis of variance for MMR, from Tables 12 & 13 same parameters from both MMC’s have same impact with some negotiable difference. Here feed is the major parameter which has most impact on MMR.
In analysis of variance for CF, from Tables 14 & 15 same parameter from each side shows same impact, with some negotiable difference. Here speed is the major parameter which has most impact on CF.
6. SCOPE OF FUTURE WORK
Same analysis can be done for other materials like steel, brass, copper etc.
We can use other process parameters for MMR and CF.
Study can be performed on milling, drilling, grinding and
other metal removal processes.
Cutting fluids and other lubricants are not used in this process, so these can be employed for improvements.
7. CONCLUSION
© 2016, IRJET ISO 9001:2008 Certified Journal
Page 669
NOMENCLATURE
s= Spindle speed, rpm f= Feed, mm
d= Depth of cut, mm
Davg= Average diameter, mm Di= Initial diameter, mm Df= Final diameter, mm
MMR= Metal removal rate, mm/min CF= Cutting force, N
S/N or SN ratio= Signal to Noise ratio
ACKNOWLEDGMENT
We express our sincere gratitude to Dr. A. Raveendra, Professor and Head of the Department of Mechanical Engineering, MREC, for his helpfulness and motivation.
We are also thankful to all the staff and my friends who made our work to be done with more ease.
REFERENCES
[1] Das,S.R., NayakR.P., & Dhupa, D.(December 2012).International Journal of Lean Thinking,3(2).
[2] Mahendra K., & Neeraj A. (October 2012).Optimization of different machining parameters of En 24 alloy steel in CNC turning by use of Taguchi method. International Journal of
Engineering Research and Application, 2(5), 160-164.
[3] Yang, W. H. and Tarng, Y. S. 1998. Design optimization of cutting parameters for turning operations based on the Taguchi method. Journal of Materials
Processing Technology, 84: 122-129.
[4] J.Sateesh et all .2003 Optimal Machining Conditions For Turning Of Al SiC Metal Matrix Composites Using ANOVA.
[5]Md. Maksudul Islam et all .2012 Optimization of Metal Removal Rate for ASTM A48 Grey Cast Iron using Taguchi Method.
[6] S. R. Rao and G. Padmanabha. 2014 Optimization of Machining Parameters in ECM of Al/B4C Composites Using Taguchi Method.
[7] Senthilkumar, et all. 2009. Study of electrochemical machining characteristics of Al/SiCp composites. International Journal of Advanced
Manufacturing Technology.
[8] Fortana, M. G. 1986. “Corrosion Engineering”. McGraw-Hill, New York
[9] M. Ramulu, P. N. Rao, H. Kao, Drilling of Al2O3) p/6061 metal matrix composites, Journal of Materials Processing Technology, 124(2002)
[10]Ravinder Kumar, Ramakant Rana, Surabhi Lata, Rahul kumar Sonkar, Abhinav Kumar, Shekhar Pawar, Roop Lal. 2015.
Optimization of process parameters on Over-Cut in drilling of Al-B4C MMC.
[11] Patnaik,S.S.M.A., & Prabina K. P., (2006).Parametric analysis and optimization of cutting parameters for turning operations based on Taguchi method. Proceedings of the International
Conference on Global Manufacturing and Innovation,(pp. 1–8).