© 2015, IRJET ISO 9001:2008 Certified Journal Page 1936
Comparative study of seismic performance of building having Stiffness
vertical irregularity at different floor levels
Manoj Kumar
1, Hemant Singh Parihar
2, Rahul Satbhaiya
31
Research Scholar, Department of Civil Engineering, Infinity Management and Engineering College, Sagar,
Madhya Pradesh., India
2
Assistant Professor , Department of Civil Engineering, GLA University , Mathura, Uttar Pradesh., India
3Assistant Professor, Department of Civil Engineering, Infinity Management and Engineering College, Sagar,
Madhya Pradesh., India
---***---Abstract -
Nowadays, as in the urban areas the space available for the construction of buildings is limited. So in limited space we have to construct such type of buildings which have can be used for multiple purposes such as lobbies, car parking etc. To fulfill this demand, buildings with irregularities is the only option available. During an earthquake, failure of structure starts at points of weakness. This weakness arises due to discontinuity in mass, stiffness and geometry of structure. Vertical irregularities are one of the major reasons of failures of structures during earthquakes.To study the behaviour of the building having various vertical irregularities at different floor levels seven models have been considered in this project. All the models were analyzed by using SAP 2000. The methods used for the analysis are static method and response spectrum method.1. INTRODUCTION
The structures having this discontinuity are termed as Irregular structures. Irregular structures contribute a large portion of urban infrastructure. For example structures with soft storey were the most notable structures which collapsed. So, the effect of vertically irregularities in the seismic performance of structures becomes really important. Height-wise changes in stiffness and mass render the dynamic characteristics of these buildings different from the regular building. As per IS 1893 vertical irregularity in the building structures may be due to irregular distributions in their mass, strength and stiffness along the height of building. When such buildings are constructed in high seismic zones, the analysis and design becomes more complicated. Vertical irregularities are considered and described as follows.
1.1
STIFFNESS IRREGULARITY
Soft Storey: As per IS 1893-2002, A soft storey is one in which the lateral stiffness is less than 70% of that in the
storey above or less than 80% of the average lateral stiffness of the three storeys above.
Extreme Soft Storey: An extreme soft storey is one in which the lateral stiffness is less than 60% of that in the storey above or less than 70% of the average stiffness of the three storeys above.
1.2
MASS IRREGULARITY
As per IS Code 1893-2002, Mass irregularities are considered to exist where the effective mass of any storey is more than 200% of effective mass of an adjacent storey. A roof that is lighter than the floor below need not be considered. The effective mass is the real mass consisting of the dead weight of the floor plus the actual weight of partition and equipment. Excess mass can lead to increase in lateral inertial forces, reduced ductility of vertical load resisting elements, and increased tendency towards collapse due to P-Δ effect. . The central force of gravity is shifted above the base in the case of heavy masses in upper floors resulting in large bending moments.
1.3 VERTICAL GEOMETRIC IRREGULARITY
As per IS 1893-2002, Geometric irregularity exists, when the horizontal dimension of the lateral force resisting system in any storey is more than 150% of that in an adjacent storey. The setback can also be visualized as a vertical re-entrant corner.1.4 DISCONTINUITY IN CAPACITY-WEAK STOREY
As per IS 1893-2002, A weak storey is one in which the storey lateral strength is less than 80% of that in the storey above. The storey lateral strength is the total strength of all seismic force resisting elements sharing the storey shear in the considered direction2. STRUCTURAL MODELLING
3-© 2015, IRJET ISO 9001:2008 Certified Journal Page 1937 dimensional analytical models are considered in this
study. Studies are conducted on these seven models. Out of seven models one is basic model, other contains six models having stiffness irregularity at different storey levels.
2.1 DESCRIPTION OF THE STRUCTURE
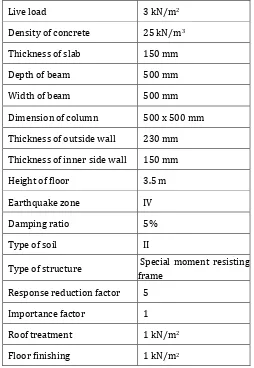
The various features of the building models considered in this project are as under:
Live load 3 kN/m2
Density of concrete 25 kN/m3
Thickness of slab 150 mm
Depth of beam 500 mm
Width of beam 500 mm
Dimension of column 500 x 500 mm
Thickness of outside wall 230 mm
Thickness of inner side wall 150 mm
Height of floor 3.5 m
Earthquake zone IV
Damping ratio 5%
Type of soil II
Type of structure Special moment resisting frame
Response reduction factor 5
Importance factor 1
Roof treatment 1 kN/m2
[image:2.595.35.289.222.590.2]Floor finishing 1 kN/m2
Table 2.1: Showing Building description The loads from the walls are distributed as uniformly distributed load on the beams of the respective storeys. The slab load is distributed in the beams of the respective storeys as trapezoidal and triangular loads.
2.2 DESCRIPTION OF STRUCTURAL MODELLING
To model and simulate the structure in geometry and behaviour to ensure the modelled structure is as close to the real one as possible. Modelling is done in such a way so that there is ideal distribution of mass, stiffness and strength of the structure. The modelling of the material properties and geometric modelling of the structure is given as follows:2.2.1 MATERIALS PROPERTIES
Different materials are used in the structural modelling of the building. The grade of concrete and reinforcement used in the study of the models is taken as M 25 and Fe 415. The elastic properties of these materials are taken as per the IS 456:2000. As per clause 6.3.2.1 of the IS 456:2000 the modulus of elasticity of concrete is taken as:
2
5000
ck/
C
E
f N mm
Where fck is the characteristic compressive strength of the
concrete in N/mm2 at 28 days. For present study value of
fck is 25. For the reinforcement, the yield stress (fy) and modulus of elasticity (Es ) is taken as per IS 456:2000.
Material Concrete Steel
Grade M 25 Fe 415
Mass Density (Kg/m3) 2549.3 7849
Unit Weight (Kg/m3) 25 76.97
Modulus of Elasticity (KN/m2) 25,000,000 20,000,000
Poisson’s Ratio 0.15 0.3
Table 2.2: Showing Material Properties 2.2.2 STRUCTURAL ELEMENT MODELLING
The following are the main modelling assumptions used in this study:
Rigid Slab: It is assumed that all the frames in the buildings are connected by floor diaphragms that are rigid in their own plane. Therefore every floor has only two translational and one rotational degree of freedom. The in-plane displacements of all the nodes on the floor are constrained by these degrees of freedom. However, the nodes can have independent vertical displacements. The gravity loads from the slabs are distributed as triangular and trapezoidal line loads on the supporting beams. Fixed base: The frames of building are assumed to be fixed at their base on an infinitely rigid foundation. No soil-structure interaction effect is considered in this study. Design Spectrum: Design spectra are not uneven curves since they are intended to be the average of many earthquakes. An idealized design spectrum of earthquake ground motions is applied at the base of the buildings as per IS 1893:2002 (Part 1). Due to the fixed base assumption, all supports are assumed to move in phase. No vertical ground motion components are applied to the buildings.
© 2015, IRJET ISO 9001:2008 Certified Journal Page 1938 Lateral load resisting system: Lateral load resisting
system must be of closed loops, so that it is able to transfer all the forces acting either vertically or horizontally to the ground. Table No. 7 of IS1893:2002 (Part 1) lists the different framing systems and response reduction factor (R). A low value of ‘R’ indicates an extremely earthquake prone building i.e., unreinforced masonry wall building, which is having a ‘R’ value of 1.5 and a high value of ‘R’ indicates an earthquake-resistant type building like moment resisting reinforced concrete frame buildings. In this system the members and the joints of frame are resisting the earthquake forces, primarily by flexure. This system is generally preferred by design engineers. Hence, a special moment resisting frame which is having an ‘ R’ value of 5 has been considered here for present study. Lumped mass at floor level: The mass of the building assumed to be lumped at the floor levels.
Frame Members: There are different analytical models available to simulate structural frames. In this research a beam element and a column element are used to model the elements of the frames in the buildings. The beams as well as columns of the frames are modelled by 3D frame elements. All the beam-column joints are assumed to be rigid. Using SAP 2000 the beams and columns in the present study are modelled as frame elements with the centerlines joined at nodes.
2.3
MODEL NOMENCLATURE AND STRUCTURE
MODELS
Each model in this study is named according to the type of irregularity and floor level at which irregularity exists. Model name SI 1 refers to the model in which stiffness irregularity is at ground floor. SI B refers to basic model for stiffness irregularity. The detailed nomenclature for the frame models considered is as under in table no. 2.3.
Reference Frame SI B
Model with stiffness irregularity at ground floor
SI 1
Model with stiffness irregularity at first floor
SI 2 Model with stiffness irregularity at second
floor
SI 3
Model with stiffness irregularity at third floor
SI 4
Model with stiffness irregularity at fourth floor
SI 5
Model with stiffness irregularity at fifth floor
SI 6 Table 3.3: Showing nomenclature of the different
models
The various models which have been analyzed are shown below. The red coloured portion shows the vertical irregularity at that particular floor.
Fig. 1 Model SI1 to SI6 2.4 METHOD OF ANALYSIS
2.6.1 STATIC ANALYSIS
Today various methods of the seismic analyses are available to evaluate the seismic performance of the framed structures. Broadly they are classified as static analysis and dynamics analysis. Further they are classified as the linear and nonlinear analysis. In the present work only static analysis is performed on the models.
Static analysis is a linear type of analysis. This method defines a way to represent the effect of earthquake, when series of forces are applied on a building, through a seismic design response spectrum. To account for effects due to yielding of the structure, many codes apply modification factors that reduce the design forces. In the equivalent static method, the lateral force equivalent to the design basis earthquake is applied statically. The equivalent lateral forces at each floor are applied at the design centre of mass. For different types of soil conditions the values of response spectra can be calculated as per IS 1893:2002 as under:
For rocky, or hard soil sites
1 15 0.00 0.10
2.50 0.10 0.40
1.00 0.40 4.00
a
T T
T g
T T
S
For medium soil sites
1 15 0.00 0.10
2.50 0.10 0.55
1.36 0.55 4.00
a
T T
T g
T T
S
For soft soil sites
1 15 0.00 0.10
2.50 0.10 0.67
1.67 0.67 4.00
a
T T
T g
T T
S
© 2015, IRJET ISO 9001:2008 Certified Journal Page 1939 The fundamental natural time period of vibration (Ta ) in
seconds, of a moment resisting frame structures is given by the empirical expression as per clause 7.6 of IS 1893:2002
0.75
0.75
0.075 for RC frame building
0.085 for steel frame building 0.09
for all structures with infill
h T a
h h d
Where, h= height of the building in m, d= base dimensions of the building at the plinth level, in m, along the considered direction of the lateral force.
[image:4.595.41.275.286.446.2]In the present work medium soil condition has been chosen. Response spectra for 5% damping for soil condition medium as per IS 1893:2002 is given in fig 3.17.
Fig 2: Response Spectra for 5% Damping (IS1893:2002)
The total design lateral force or design seismic base shear (VB) is calculated as per clause 7.5.3 of IS 1893:2002 as under:
B h
V
A w
Where, Ah is design horizontal acceleration spectrum
value calculated by using Ta and Sa/ g values. And w is the
total seismic weight of the structure which is taken equal to the sum of the dead load and 25% of the live load of the all floors of the building. Vertical distribution of the base shear to different floors is done according to the clause 7.7.1 of the IS 1893:2002, expression for the same is as under:
2 i i
i n 2
j j j=1
W h
Q
W h
Where Qi the design lateral force at floor i, Wi seismic
weight of the ith floor, hi is the height of the ith floor from
the base, and n is the number of storeys in the building.
2.6.2 RESPONSE SPECTRUM ANALYSIS
The basis of engineering seismology is the need to quantify how a given structure will respond to complex ground motions. The structure‘s response is determined by its mass and stiffness distributions. For example, stiff buildings will experience low accelerations relative to the ground. Tall buildings tend to accelerate away from
ground motions, resulting in low absolute accelerations, where absolute acceleration is the sum of the building‘s movement relative to the ground and the ground acceleration.
The response spectrum method (RSM) was introduced in 1932 in the doctoral dissertation of Maurice Anthony Biot at Caltech. It is an approach to finding earthquake response of structures using waves and vibration mode shapes. The concept of the “response spectrum” was applied in design requirements in the mid-20th century in building codes of various countries. The computational advantages in using the response spectrum method of seismic analysis are the prediction of displacements and member forces in structural systems. The method involves the calculation of only the maximum values of the displacements and member forces in each mode using smooth design spectra that are the average of several earthquake motions. The present project uses the response spectrum method to calculate the values of member forces and moments.
2.5 LOAD COMBINATIONS
A load combination results when more than one load type acts on the structure. Design codes usually specify a variety of load combinations together with load factors (weightings) for each load type in order to ensure the safety of the structure under different maximum expected loading scenarios. For example, in design a staircase, a dead load factor may be 1.2 times the weight of the structure, and a live load factor may be 1.6 times the maximum expected live load. These two “factored loads” are combined to determine the required strength of the staircase.
In the limit state design of this RC building model the following load combinations are considered as per codal provisions provided in Clause 6.3.1.2, IS: 1893-2002 (Part 1):
© 2015, IRJET ISO 9001:2008 Certified Journal Page 1940
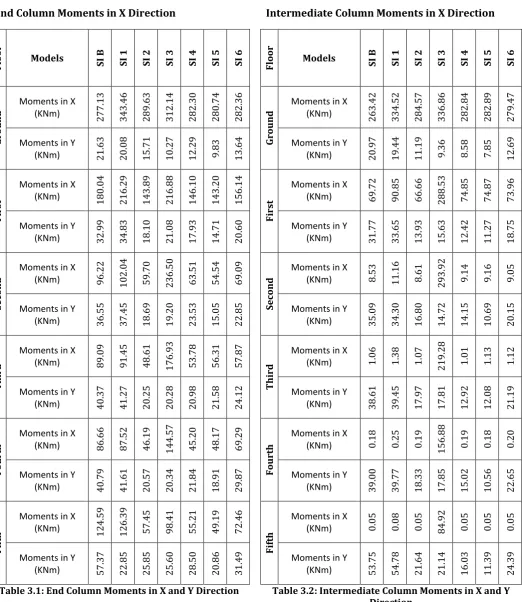
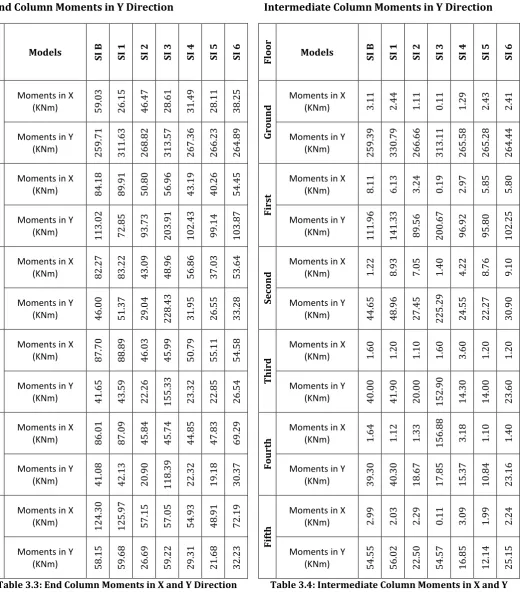
3. RESULTS
End Column Moments in X Direction
Fl
oo
r
Models SI B SI 1 SI 2 SI 3 SI 4 SI 5 SI 6
G
round
Moments in X
(KNm) 277.13 343.46 289.63 312.14 282.30 280.74 282.36
Moments in Y
(KNm) 21.63 20.08 15.71 10.27 12.29 9.83 13.64
Fir
st
Moments in X
(KNm) 180.04 216.29 143.89 216.88 146.10 143.20 156.14
Moments in Y
(KNm) 32.99 34.
83
18.10 21.08 17.93 14.71 20.60
Secon
d
Moments in X
(KNm) 96.22 102.04 59.70 236.50 63.51 54.54 69.09
Moments in Y
(KNm) 36.55 37.45 18.69 19.20 23.53 15.05 22.85
Th
ir
d
Moments in X
(KNm) 89.09 91.45 48.61 176.93 53.78 56.31 57.87
Moments in Y
(KNm) 40.37 41.27 20.25 20.28 20.98 21.58 24.12
Fourt
h
Moments in X
(KNm) 86.66 87.52 46.19 144.57 45.20 48.17 69.29
Moments in Y
(KNm) 40.79 41.61 20.57 20.34 21.84 18.91 29.87
Fift
h
Moments in X
(KNm) 124.59 126.39 57.45 98.41 55.21 49.19 72.46
Moments in Y
[image:5.595.42.565.116.719.2](KNm) 57.37 22.85 25.85 25.60 28.50 20.86 31.49
Table 3.1: End Column Moments in X and Y Direction
Intermediate Column Moments in X Direction
Fl
oo
r
Models SI B SI 1 SI 2 SI 3 SI 4 SI 5 SI 6
G
round
Moments in X
(KNm) 263.42 334.52 284.57 336.86 282.84 282.89 279.47
Moments in Y
(KNm) 20.97 19.44 11.19 9.36 8.58 7.85 12.69
Fir
st
Moments in X
(KNm) 69.72 90.85 66.66 288.53 74.85 74.87 73.96
Moments in Y
(KNm) 31.77 33.65 13.93 15.63 12.42 11.27 18.75
Secon
d
Moments in X
(KNm) 8.53 11.16 8.61 293.92 9.14 9.16 9.05
Moments in Y
(KNm) 35.09 34.30 16.80 14.72 14.15 10.69 20.15
Th
ir
d
Moments in X
(KNm) 1.06 1.38 1.07 219.28 1.01 1.13 1.12
Moments in Y
(KNm) 38.61 39.45 17.97 17.81 12.92 12.08 21.19
Fourt
h
Moments in X
(KNm) 0.18 0.25 0.19 156
.88
0.19 0.18 0.20
Moments in Y
(KNm) 39.00 39.77 18.33 17.85 15.02 10.56 22.65
Fift
h
Moments in X
(KNm) 0.05 0.08 0.05 84.92 0.05 0.05 0.05
Moments in Y
(KNm) 53.75 54.78 21.64 21.14 16.03 11.39 24.39
© 2015, IRJET ISO 9001:2008 Certified Journal Page 1941
End Column Moments in Y Direction
Fl
oo
r
Models SI B SI 1 SI 2 SI 3 SI 4 SI 5 SI 6
G
round
Moments in X
(KNm) 59.03 26.15 46.47 28.61 31.49 28.11 38.25
Moments in Y
(KNm) 259.71 311.63 268.82 313.57 267.36 266.23 264.89
Fir
st
Moments in X
(KNm) 84.18 89.91 50.80 56.96 43.19 40.26 54.45
Moments in Y
(KNm) 113.02 72.85 93.73 203.91 102.43 99.14 103.87
Secon
d
Moments in X
(KNm) 82.27 83.22 43.09 48.96 56.86 37.03 53.64
Moments in Y
(KNm) 46.00 51.37 29.04 228.43 31.95 26.55 33.28
Th
ir
d
Moments in X
(KNm) 87.70 88.89 46.03 45.99 50.79 55.11 54.58
Moments in Y
(KNm) 41.65 43.59 22.26 155.33 23.32 22.85 26.54
Fourt
h
Moments in X
(KNm) 86.01 87.09 45.84 45.74 44.85 47.83 69.29
Moments in Y
(KNm) 41.08 42.13 20.90 118.39 22.32 19.18 30.37
Fift
h
Moments in X
(KNm) 124.30 125.97 57.15 57.05 54.93 48.91 72.19
Moments in Y
[image:6.595.44.565.99.692.2](KNm) 58.15 59.68 26.69 59.22 29.31 21.68 32.23
Table 3.3: End Column Moments in X and Y Direction
Intermediate Column Moments in Y Direction
Fl
oo
r
Models SI B SI 1 SI 2 SI 3 SI 4 SI 5 SI 6
G
round
Moments in X
(KNm) 3.11 2.44 1.11 0.11 1.29 2.43 2.41
Moments in Y
(KNm) 259.39 330.79 266.66 313.11 265.58 265.28 264.44
Fir
st
Moments in X
(KNm) 8.11 6.13 3.24 0.19 2.97 5.85 5.80
Moments in Y
(KNm) 111.96 141.33 89.56 200.67 96.92 95.80 102.25
Secon
d
Moments in X
(KNm) 1.22 8.93 7.05 1.40 4.22 8.76 9.10
Moments in Y
(KNm) 44.65 48.96 27.45 225.29 24.55 22.27 30.90
Th
ir
d
Moments in X
(KNm) 1.60 1.20 1.10 1.60 3.60 1.20 1.20
Moments in Y
(KNm) 40.00 41.90 20.00 152.90 14.30 14.00 23.60
Fourt
h
Moments in X
(KNm) 1.64 1.12 1.33 156.88 3.18 1.10 1.40
Moments in Y
(KNm) 39.30 40.30 18.67 17.85 15.37 10.84 23.16
Fift
h
Moments in X
(KNm) 2.99 2.03 2.29 0.11 3.09 1.99 2.24
Moments in Y
(KNm) 54.55 56.02 22.50 54.5
7
16.85 12.14 25.15 Table 3.4: Intermediate Column Moments in X and Y
© 2015, IRJET ISO 9001:2008 Certified Journal Page 1942
4. CONCLUSIONS
The main conclusions obtained from the present study is that for the models having stiffness irregularities at different floor levels, the maximum moments were found to be for models SI 1 and SI 3. Models SI 3 is showing more chances of collapse than the other models. When there is stiffness irregularity in the model of a structure, it should not be provided at ground floor and for the intermediate floor. Stiffness irregularity may be provided in top floor levels.
ACKNOWLEDGEMENT
The authors would like to thank Er. Rahul Satbhaiya for the statistical support and the guidance. The author would also like to thank Infinity Management & Engineering College, Sagar for providing the Tools and Technology for the work to be completed.
REFERENCES
[1] Valmundsson, E.V. and Nau, J.M. (1997). “Seismic Response of Building Frames with Vertical Structural Irregularities”, Journal of Structural Engineering, ASCE, Vol. 123, No. 1, pp. 30-41. CEN(1998)(ICC,2003). [2] IS 1893 Part 1 (2002),” Indian Standard Criteria for
Earthquake Resistant Design of Structures”, Bureau of Indian Standards, New Delhi.
[3] SAP 2000 (Version 14.0). (2007) Integrated Software for Structural Analysis and Design. Computers & Structures, Inc., Berkeley, California.
[4] Saraswati S., Vineet S. (2012),“ Seismic Response of RCC Building with Soft Storey” International journal of applied engineering research, vol.7 no.11.
[5] Al-Ali, A. A. K. , and Krawinkler, H. (1998). “Effect of vertical irregularities on seismic behaviour of building structures.’’Rep. No. 130, John A. Blume Earthquake Engineering Center, Stanford Univ., Calif., 198.
[6] Arlekar, J.N., S. K. Jain and C.V.R. Murthy (1997), “Seismic response of RC frame building with soft first storey”. Proceeding of CBRI golden jubilee conference on natural hazards in urban habitat. New Delhi [7] Sharany H, Khan M. A.(2008) “Seismic Vulnerability
of Columns of RC Framed Buildings with Soft Ground Floor” International Journal of Mathematical Models and Methods in Applied Sciences.
BIOGRAPHIES
Manoj Kumar was born in 19th October 1985. He received his B.Tech in Civil Engineering from College of Science & Engineering, Jhansi in 2011. He is pursuing his M.Tech (Structural Engineering) from Infinity Management & Engineering College, Sagar. His research interests are Structural Design.
Mr. Hemant Singh Parihar received his M.Tech (Structural Engineering) from Motilal Nehru National Institute of Technology, Allahabad in 2013. He is currently working as Assistant Professor in Department of Civil Engineering of GLA University, Mathura. His researches interests are Structural Health Monitoring, Structural Dynamic, and Soil Structural Interaction.