Replication of Genetic Associations as Pseudoreplication due
to Shared Genealogy
Noah A. Rosenbergand Jenna M. VanLiere
1Department of Human Genetics, Center for Computational Medicine and Biology, and the Life Sciences Institute, University of Michigan, Ann Arbor, Michigan
The genotypes of individuals in replicate genetic association studies have some level of correlation due to shared descent in the complete pedigree of all living humans. As a result of this genealogical sharing, replicate studies that search for genotype-phenotype associations using linkage disequilibrium between marker loci and disease-susceptibility loci can be considered as ‘‘pseudoreplicates’’ rather than true replicates. We examine the size of the pseudoreplication effect in association studies simulated from evolutionary models of the history of a population, evaluating the excess probability that both of a pair of studies detect a disease association compared to the probability expected under the assumption that the two studies are independent. Each of nine combinations of a demographic model and a penetrance model leads to a detectable pseudoreplication effect, suggesting that the degree of support that can be attributed to a replicated genetic association result is less than that which can be attributed to a replicated result in a context of true independence. Genet. Epidemiol. 33:479–487, 2009. r2009 Wiley-Liss, Inc.
Key words: coalescent; population growth; meta-analysis
Contract grant sponsor: NIH; Contract grant number: R01 GM081441; R01 HL090564; T32 HG00040; Contract grant sponsor: Burroughs Wellcome Fund Career Award in the Biomedical Sciences; Contract grant sponsor: Alfred P. Sloan Research Fellowship
Correspondence to: Noah A. Rosenberg, Department of Human Genetics, Center for Computational Medicine and Biology, and the Life Sciences Institute, University of Michigan, 100 Washtenaw Avenue, Ann Arbor, MI 48109-2218. E-mail: [email protected]
Received 23 August 2008; Revised 21 October 2008; Accepted 1 December 2008 Published online 3 February 2009 in Wiley InterScience (www.interscience.wiley.com). DOI: 10.1002/gepi.20400
INTRODUCTION
Genetic case-control association studies seek to identify statistical associations between genotype and disease status in samples of unrelated individuals with and without a disease phenotype. Recently, the case-control association design has become common as an approach to the search for susceptibility loci that underlie complex genetic diseases.
As case-control genetic association studies proliferate, it is important to understand the factors that affect the replicability of association results. General acceptance of the importance of an observed association typically requires that the association be detected in additional data sets beyond the one that provided the initial finding. However, many associations identified in one study are not identified in subsequent studies [Ioannidis et al., 2001; Hirschhorn et al., 2002; Lohmueller et al., 2003]. While false positives in the initial studies likely contribute to a large fraction of nonreplications, it is also likely that some nonreplications represent true susceptibility loci that replication studies fail to detect [Gorroochurn et al., 2007; Ioannidis, 2007; Zo¨llner and Pritchard, 2007; McCarthy et al., 2008; Moonesinghe et al., 2008].
The typical difficulties involved in interpreting the replication or nonreplication of any type of statistical
finding are compounded in the genetic case-control context by the indirect nature of many genetic association studies. Rather than searching directly for true causal loci, indirect association studies seek to identify markers whose genotypes are correlated both with genotypes at (un-known) causal loci and with disease status [Kruglyak, 1999; Pritchard and Przeworski, 2001; Neale and Sham, 2004; Zondervan and Cardon, 2004; Hirschhorn and Daly, 2005]. These studies derive their utility from the fact that due to shared descent from a common ancestor, disease-affected individuals will often possess both a disease mutation and neighboring marker alleles that were present in the ancestor in whom the disease mutation originally occurred. Thus, identification of a marker associated with disease status can indicate the likely presence on the genome of a nearby causal susceptibility locus.
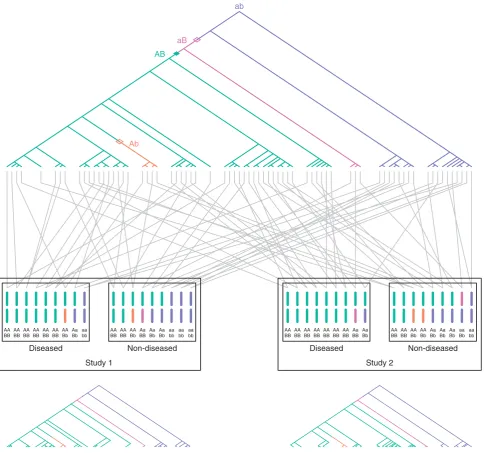
Consider a hypothetical scenario illustrating the effect of history on the correlation of outcomes of replicate studies in a single population. Suppose two similar association studies are performed in the population. The samples in the two studies will likely have some degree of shared genealogy, as many individuals from the history of the population are likely to appear in the ancestries of members of both samples. Suppose further that a true causal mutation has given rise to increased disease risk in the population. As a result, certain mutations, recombina-tions, and divergences of genealogical lineages will occur in the ancestries of many of the individuals who carry both the disease and the causal mutation. Consequently, some of the same events that have led in one sample to the production of an indirect association between a marker and the disease will also have led to an indirect association in a second sample from the population. An example of this correlation in outcomes due to shared genealogy is shown in Figure 1.
We can compare the genetic association context to the scenario of a coin toss. Suppose an unfair coin has probability P6¼0:5 of landing ‘‘heads.’’ We perform two separate experiments, in each of which we flip the coink times and test the null hypothesis that the coin has a fair probability of 0.5. Because the two experiments are independent, the probability that both experiments will reject the null hypothesis is the square of the probability that the first of the studies will reject the null hypothesis. In the case-control setting, however, because of shared ancestry of the individuals in two studies, the outcomes of the studies are not strictly independent, and the prob-ability that both studies will produce a given outcome is greater than the square of the probability that the first study will produce the outcome. Due to the dependence of multiple studies on the same past events, a replication study in a genetic association context can be more accurately described as a form of pseudoreplication study. This term is borrowed from the context of ecological field experiments, in which one of its uses is for describing situations where treatment units within an experiment are not truly independent but are viewed as such during statistical analysis [Hurlbert, 1984; Heffner et al., 1996].
The issue of genetic pseudoreplication—the correlation of replicate association studies due to shared genealo-gies—is important because if correlation among studies is considerable, then it might be inappropriate to regard a replicated genetic association result as having the same level of support as that attributed to a replication in a setting with true independence. Although statistical properties of replication in genetic association studies have frequently been investigated [Clarke et al., 2007; Gorroochurn et al., 2007; Sullivan, 2007; Zo¨llner and Pritchard, 2007; Moonesinghe et al., 2008], it has typically been assumed that separate studies have independent outcomes, and the issue of pseudoreplication has not been included in discussions about replication [Vieland, 2001; Hirschhorn and Altshuler, 2002; Hirschhorn et al., 2002; Colhoun et al., 2003; Redden and Allison, 2003; Ott, 2004; Ioannidis, 2007; NCI-NHGRI Working Group on Replication in Association Studies, 2007; McCarthy et al., 2008]. Note that the phenomenon that we term as ‘‘pseudoreplication’’ is distinct from the phenomenon termed by Gorroochurn et al. [2007] as
underpowered replication studies, our concern is with the way in which replication of an association result is influenced by the shared descent of the individuals in replicate samples. Our interest is in the relationship between the outcomes of separate studies of the same marker in different sets of individuals, rather than on forms of replication that involve joint analysis of data pooled across studies [Skol et al., 2006].
To quantitatively evaluate the phenomenon of pseudor-eplication in simulated genetic association studies, we consider pairs of indirect association studies performed in the same simulated populations. This strategy is similar to that of Ewens et al. [2007], who examined the relationship between estimates of the levels of genetic variation observed in two separate samples from the same popula-tion. We use a coalescent method to simulate the pair of studies conditional on assumptions about the demo-graphic history of the population; our approach is related to that of Sullivan [2007], who investigated replication using a data-based simulation approach [Wright et al., 2007] rather than using an explicit evolutionary model. Our focus is on pseudoreplication in pairs of studies that both have the same underlying disease effect, and we evaluate the excess probability that both studies detect an indirect association compared to the probability expected under the assumption that the two studies are indepen-dent. Although we find that the outcomes of the two studies are often close to independent, we also observe that under the conditions simulated, a pseudoreplication effect does exist, in that replicate studies can have a noticeably higher probability of finding a disease locus than is expected under independence. A consequence of this pseudoreplication effect is that under the conditions simulated, ‘‘flip-flop’’ associations, in which two studies find associations involving opposite variants at the same marker [Lin et al., 2007, 2008; Zaykin and Shibata, 2008], are relatively unlikely to occur at a marker closely linked to a true susceptibility locus.
METHODS
We simulated pairs of indirect association studies in simulated populations. Each pair of association studies involved two loci—an unknown disease locus and a nearby marker locus tested for association with disease status in both studies. For each pair of simulated studies, we recorded whether both studies, one study, or neither study detected association between the marker and disease status. Our simulation approach was designed to balance the competing issues of providing generally reasonable parameter values, generating enough accepta-ble simulations quickly, and satisfying the assumption of coalescent methods that relatively few haplotypes are simulated compared to the population size. As the simulations were intended to reflect a scenario of a complex disease with multiple underlying risk factors, high-risk genotypes at the single disease locus simulated were given incomplete penetrance, so that the remaining components of the disease risk due to other variables were not explicitly modeled.
representative among recent coalescent-based approaches to demographic modeling of human population history [Marth et al., 2004; Schaffner et al., 2005; Voight et al., 2005; Plagnol and Wall, 2006; Fagundes et al., 2007]. Each model simulates mutation, recombination, and coalescence of genetic lineages backward in time from the present, conditional on assumptions about the history of the
population size. Model 1 involved a constant-sized population of 10;000 diploid individuals, a value with similar magnitude to that reported by studies of various subsets of the human population [Takahata, 1993; Har-pending et al., 1998; Yu et al., 2001; Tenesa et al., 2007]. Viewed forward in time, Model 2, based on a study of European variation [Marth et al., 2004], involved a AA AA AA AA AA AA AA Aa aa
BB BB BB BB BB BB Bb Bb bb
AA AA AA Aa Aa Aa aa aa aa BB BB Bb BB Bb Bb bb bb bb
AA AA AA AA AA AA AA Aa Aa BB BB BB BB BB BB BB BB Bb
AA AA AA AA Aa Aa Aa aa aa BB BB Bb Bb Bb Bb Bb Bb bb
Diseased Non-diseased
Study 1
Diseased Non-diseased
Study 2 AB
Ab
aB
[image:3.595.56.541.84.537.2]ab
Fig. 1. Schematic of two association studies performed in the same diploid population. Two loci are considered, a disease-susceptibility locus with allelesAandaand a marker locus with allelesBandb. The genealogy of sampled copies of the susceptibility locus in two association studies is shown. The most recent common ancestor of the sampled copies has haplotypeab. Open diamonds represent recombinations, the closed diamond represents a mutation, and distinct colors represent distinct two-locus haplotypes. TheAallele is a true disease-susceptibility allele; alleleBis indirectly associated as it lies on the haplotype on which the firstAmutation occurred. Gray lines represent the pairing of haplotypes to form diploid individuals. For the purpose of illustration with a small sample size as shown in the figure, disease status is assigned to individuals according to a multiplicative model with penetrance 1/6 for low-riskaa
instantaneous jump occurred to size 1:4105; Model 3, based on African variation [Plagnol and Wall, 2006], involved a constant size of 10;000 diploid individuals until 4,280 generations in the past followed by exponential growth to a current size of 106.
For each demographic model, we considered three penetrance models for the disease locus—recessive, additive, and dominant. For each of the nine combinations of a demographic model and a penetrance model, we simulated 100,000 pairs of indirect association studies, each with a disease locus and a nearby marker locus that was tested for disease association. To simulate pairs of studies, we first independently selected a recombination rate per base pair r, a mutation rate per base pair m, a probability of disease PL for the low-risk homozygous genotype at the disease locus, a probability of diseasePH for the high-risk homozygous genotype at the disease locus, and a population disease frequencyPD. Values for these parameters were selected uniformly within specified ranges:½5109;2:75108forr,½1109;2108for
m,½0;0:4forPL,½0:4;1forPH, and½0:15;0:4forPD.
Given the demographic model, recombination rate, and mutation rate, we used the ms coalescent simulator [Hudson, 2002] to simulate 4,000 haplotypes, each of lengths¼300;001 base pairs. The ms approach simulates an infinitely many-sites model in whichmsis a mutation rate for a whole sequence and in which recurrent mutations are not allowed at individual sites. For the population mutation and recombination parameters, we used y¼4Nms and r¼4Nrðs1Þ, where N was the present population size for the appropriate model (104 for Model 1, 1:4105 for Model 2, and 106 for Model 3).
The ms command to generate one simulation of Model 1 was ms 4000 1 t y r r 300001, where y and r were random values based on simulated choices ofmandr. The command for Model 2 was ms 4000 1t yr r 300001 eN 0.00357 0.07143; the value 0.00357 represents the time at which the population size changed (in units of 4N), and 0.07143 represents the ancient population size (in units of N). The command for Model 3 was ms 4000 1 t yrr 300001 G 4303.9 eG 0.00107 0.0. The value 4303.9 represents the exponential population growth rate (popu-lation size at timetmeasured in units of 4Ngenerations is given byNeð4303:9Þt), 0.00107 represents the time of onset of growth in units of 4Ngenerations, and 0.0 indicates a constant size in the period prior to growth.
The 4,000 simulated haplotypes were paired randomly to obtain 2,000 diploid individuals. Scanning from left to right, polymorphic sites were tested as potential disease loci, choosing the derived allele as the high-risk allele. For a given site, treating the site as the disease locus, disease status was simulated for each of the 2,000 individuals based on the genotype of the individual and the probabilities PL and PH, using the penetrance model to determine the probability of disease for heterozygotes (PL for the recessive model, PL=2þPH=2 for the additive model, andPHfor the dominant model). If the fraction of affected individuals was found to lie in the interval ½PD0:01;PDþ0:01, then the site was chosen as the disease locus. If no suitable disease locus was found in the simulated 300 kb region, then the simulation was dis-carded and a new simulation was generated.
association studies, were selected randomly from the individuals, without replacement. Each sample included 100 cases and 100 controls (each simulation generated enough cases and controls such that two disjoint samples could always be selected). All sites with minor allele frequency greater than or equal to 0.05 in the full set of 2,000 simulated individuals were then identified as potential marker loci (excluding the disease locus as a possible marker locus). If more than 150 such loci were produced in a single simulation, then 150 of the possible marker loci were selected at random (possibly fewer than 150 for the last simulation, as the target number of pairs of association studies was reached). For each marker locus, contingency tables involving the three possible marker genotypes and case/control status were generated sepa-rately in both simulated studies. A 32Gtest statistic for association [Sokal and Rohlf, 1995] was then calculated for each study, and associations significant at the 0.05 level were identified based on the w2 distribution with two degrees of freedom (cutoff of 5.991, henceforth denoted by c). Denoting the entries in the contingency table by m00,
m01, and m11 for the numbers of occurrences of the three
genotypes in cases (where ‘‘1’’ represents the derived allele at the marker locus and ‘‘0’’ is the ancestral allele) andn00,
n01, and n11 for the corresponding values in controls, we
identified marker allele 0 as disease-associated if we observed n00þn01om00þm01 and n01þn114m01þm11, marker allele 1 as disease-associated if n00þn014m00þ m01andn01þn11om01þm11, and neither allele as disease-associated otherwise. We recorded the parameters for the simulated scenario, the allele more strongly associated with disease in each of the two studies, and theGstatistics for the two studies (G1for one study arbitrarily labeled as the first study, andG2for the other study).
The process of simulating populations using ms, choosing a disease locus, sampling two sets of cases and controls, and choosing one or more marker loci was repeated until 100,000 pairs of association studies—each pair involving the same population, the same disease locus, and the same marker locus, but different indivi-duals—were obtained. Under the assumption that two studies of the same disease and marker locus in the same population are independent, the probability that both studies produce significant associations is the product of the probability that the first study produces a significant association and the probability that the second study produces a significant association. Thus, under this hypothesis, our simulations would be expected to produce Pr½G14candG24c ¼Pr½G14cPr½G24c, and our pri-mary interest was in evaluating the excess probability Pr½G14candG24c Pr½G14cPr½G24c attributable to pseudoreplication. We also evaluated the excess using Pr½G14candG24c=ðPr½G14cPr½G24cÞ, the ratio of the conditional probability Pr½G24cjG14c to the uncondi-tional Pr½G24c. To assist in interpreting the pseudorepli-cation effect, we also examined Pr½G14c, Pr½G14candG24c, and Pr½G14cPr½G24c.
RESULTS
though they varied in the distance over which power was reasonably high (Fig. 2). These differences among models in the distance over which association was detectable likely result from the difference across models in the extent of allelic association. As expected based on previous theoretical and simulation-based predictions [Slatkin, 1994; Kruglyak, 1999; Zo¨llner and von Haeseler, 2000; McVean, 2002], the constant model (Model 1) produced a greater extent of association along the genome than did the instantaneous expansion and exponential expansion mod-els (Modmod-els 2 and 3).
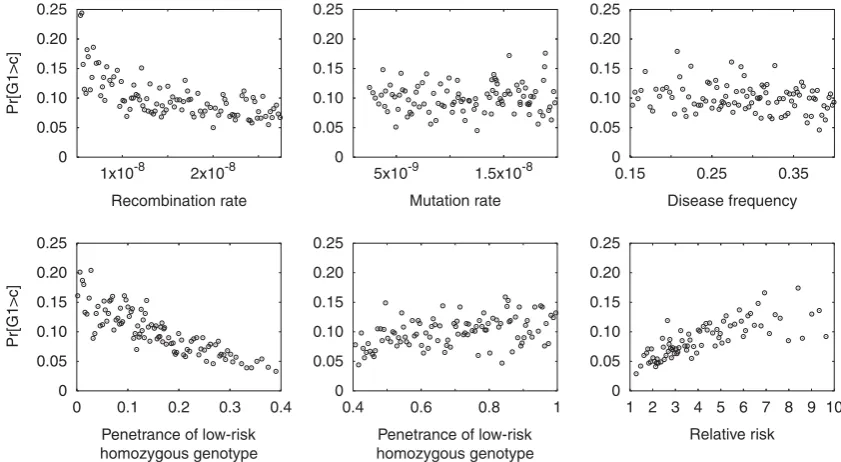
For each of the nine models, power Pr½G14cdepended in a sensible way on the various parameters, as can be seen for the role of the distance between the marker and the disease locus in Figure 2. The effects of the other parameters for a representative model, demographic Model 2 with a recessive disease effect, are shown in Figure 3. Lower recombination rate led to increased power, reflecting the greater level of association produced
between the marker and the disease locus when their recombination distance was smaller. Mutation rate had little impact on Pr½G14c, as the effect of mutation rate was mainly to influence the speed at which suitable disease and marker loci were simulated, rather than to substantially influence the properties of the scenarios that were ultimately accepted. Disease frequency also had relatively little effect in most simulated models. However, power increased with decreasing penetrance PL for the low-risk homozygous genotype, with increasing pene-trance PH for the high-risk homozygous genotype, and with increasing relative riskPH=PL.
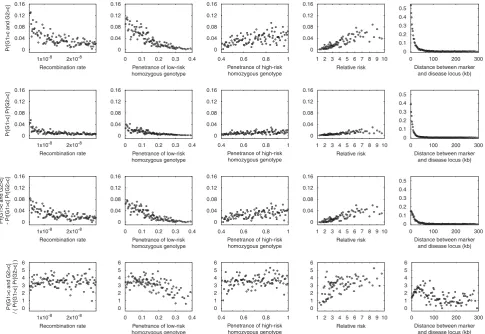
Considering Pr½G14candG24cand Pr½G14cPr½G24c, similar effects of the various parameters are observed (Fig. 4). However, comparing the top two rows of Figure 4, it is apparent that Pr½G14candG24c is typically greater than Pr½G14cPr½G24c. The bottom two rows of Figure 4 demonstrate that Pr½G14candG24c Pr½G14cPr½G24c is almost always positive and that 0
0.1 0.2 0.3 0.4 0.5 0.6
0 0.1 0.2 0.3 0.4 0.5 0.6
0 0.1 0.2 0.3 0.4 0.5 0.6
0 100 200 300
Pr[G1>c]
Distance between marker and disease locus (kb)
0 100 200 300
Distance between marker and disease locus (kb)
0 100 200 300
Distance between marker and disease locus (kb) Model 1
Recessive Additive Dominant
[image:5.595.130.463.84.172.2]Model 2 Model 3
Fig. 2.Pr½G14cas a function of the distance between the marker and the disease locus. The plots display nine combinations of demographic model (Models 1–3) and penetrance model (recessive, additive, and dominant). For each of the nine combinations, the 100,000 simulated studies were binned into 100 groups each consisting of 1,000 studies. The probability evaluated from the studies in a bin is plotted at the mean of the 1,000 values placed in the bin.
0 0.05 0.10 0.15 0.20 0.25
Pr[G1>c]
0 0.05 0.10 0.15 0.20 0.25
0 0.05 0.10 0.15 0.20 0.25
0 0.05 0.10 0.15 0.20 0.25
Pr[G1>c]
Recombination rate
0 0.05 0.10 0.15 0.20 0.25
5x10⁻⁹ 1.5x10⁻⁸ 1x10⁻⁸ 2x10⁻⁸
Mutation rate
0 0.05 0.10 0.15 0.20 0.25
0.15 0.25 0.35
Disease frequency
0 0.1 0.2 0.3 0.4
Penetrance of low-risk homozygous genotype
Penetrance of low-risk homozygous genotype
0.4 0.6 0.8 1 1 2 3 4 5 6 7 8 9 10
[image:5.595.84.505.245.476.2]Relative risk
Pr½G14c andG24c=ðPr½G14cPr½G24cÞis almost always greater than 1. Particularly for the scenarios with the highest power—small r, small PL, large PH, large PH=PL, and small distance between the marker and the disease locus— the pseudoreplication effect Pr½G14candG24c Pr½G14cPr½G24c is noticeably greater than zero. Considering Pr½G14candG24c=ðPr½G14cPr½G24cÞ, the power to detect association in the second study when conditioning on having detected association in the first study is often magnified by a factor of 2–5 compared to the unconditional power. A generally similar magnitude of the pseudoreplication effect is observed in all nine models, extending over a longer distance in the constant-sized Model 1 compared to instantaneous expansion Model 2 and exponential expansion Model 3 (Fig. 5).
Only a very small number of pairs of studies withG14c andG24chad the property that opposite high-risk alleles were identified at the marker locus in the two studies. For each of the nine models, the fraction of pairs of studies with G14c andG24c and opposite high-risk alleles was less than 5104; considering only those studies with G14candG24c, in each of the nine models the fraction of studies with opposite high-risk alleles was less than 1%.
This result has the consequence that the excess observed in Figure 4 for Pr½G14candG24c compared to Pr½G14cPr½G24c is due to genuine pseudoreplication of associations with the same marker allele, rather than to scenarios in which opposite alleles at the marker locus were associated with disease in the two separate studies.
DISCUSSION
In simulations of pairs of association studies performed in the same population, we have observed the existence of a noticeable ‘‘pseudoreplication’’ effect, in which the shared ancestry of individuals in two different association studies of the same genomic region induces a correlation in the outcomes of the two studies. We have found that the pseudoreplication effect sometimes produces a consider-able magnification of the power to detect association in a second study when conditioning on having detected it in an initial study, and that the excess probability that two studies identify a disease association is greater in scenarios with higher power to detect true disease associations. The excess probability of replication of a disease association 0
0.04 0.08
Pr[G1>c and G2>c] 0 0.04 0.08
0 0.1 0.2 0.3 0.4
Penetrance of low-risk homozygous genotype
0 0.04 0.08
0.4 0.6 0.8 1
Penetrance of high-risk homozygous genotype
0.4 0.6 0.8 1
Penetrance of high-risk homozygous genotype
0.4 0.6 0.8 1
Penetrance of high-risk homozygous genotype
0.4 0.6 0.8 1
Penetrance of high-risk homozygous genotype
0 0.04 0.08
1 2 3 4 5 6 7 8 9 10 Relative risk
1 2 3 4 5 6 7 8 9 10
Relative risk
1 2 3 4 5 6 7 8 9 10 Relative risk
1 2 3 4 5 6 7 8 9 10 Relative risk
0 0.1 0.2 0.3
0 100 200 300
Distance between marker and disease locus (kb)
0 100 200 300
Distance between marker and disease locus (kb)
0 100 200 300
Distance between marker and disease locus (kb)
0 100 200 300
Distance between marker and disease locus (kb) 0
0.04 0.08 0.12 0.16
Pr[G1>c] Pr[G2>c] 0 0.04 0.08 0.12 0.16
0 0.1 0.2 0.3 0.4
Penetrance of low-risk homozygous genotype
Penetrance of low-risk homozygous genotype 0 0.04 0.08 0.12 0.16 0 0.04 0.08 0.12 0.16 0 0.1 0.2 0.3 0.4 0.5 0 0.04 0.08 0.12 0.16
1x10⁻⁸ 2x10⁻⁸
Pr[G1>c and G2>c] - Pr[G1>c] Pr[G2>c]
Recombination rate
1x10⁻⁸ 2x10⁻⁸
Recombination rate
1x10⁻⁸ 2x10⁻⁸
Recombination rate
1x10⁻⁸ 2x10⁻⁸
Recombination rate 0 0.04 0.08 0.12 0.16
0 0.1 0.2 0.3 0.4
Penetrance of low-risk homozygous genotype
0 0.1 0.2 0.3 0.4
0 0.04 0.08 0.12 0.16 0 0.04 0.08 0.12 0.16 0 0.1 0.2 0.3 0.4 0.5 6 5 4 3 2 1 0
Pr[G1>c and G2>c]
/ ( Pr[G1>c] Pr[G2>c] )
[image:6.595.55.541.85.419.2]6 5 4 3 2 1 0 6 5 4 3 2 1 0 6 5 4 3 2 1 0 6 5 4 3 2 1 0
Fig. 4.Pr½G14candG24c, Pr½G14cPr½G24c, Pr½G14candG24c Pr½G14cPr½G24c, and Pr½G14candG24c=ðPr½G14c
was greatest at short distances between the marker tested and the disease locus, and for disease alleles with high relative risk. Small populations have more genealogical sharing among individuals than do large populations; thus, the pseudoreplication effect was greatest for the scenario with the smallest population size (Model 1), in which the set of cases included in the two replicate studies comprised a substantial fraction of affected individuals in the full population.
The occurrence of genealogical correlation between studies might have contributed to a low probability for ‘‘flip-flop’’ associations when disease loci were truly present. As we have observed, genealogical correlation leads to increased probability that two association studies of the same marker and disease will produce the same outcome in the same population, thereby decreasing the probability of divergent outcomes. Although recent stu-dies have shown that flip-flop associations can indeed occur in the presence of true disease associations [Lin et al., 2007, 2008; Zaykin and Shibata, 2008], our simula-tions suggest that the scenarios that produce such flip-flops near a disease locus might be quite rare.
The pseudoreplication phenomenon has the conse-quence that the level of statistical support provided by genetic association replications is less than that provided by truly independent replicates, an important result for the practice of association meta-analyses. Thus, the existence of pseudoreplication suggests that new strategies should be developed for estimating the degree of correlation between pseudoreplicated genetic association experi-ments, and for taking this correlation into account when agglomerating the results of separate studies. To minimize the correlation, it may also be advisable to focus on larger populations, for which the pseudoreplication effect is expected to be smallest.
It is worthwhile to note, however, that our simulations differed in various ways from common practices in replication studies. To match our simulations to the typical
setting in which a derived disease allele arises on an existing haplotypic background, we chose the derived allele for the disease variant, so that the results are not directly applicable to the fraction of situations in which disease alleles are ancestral. Loci were simulated under selective neutrality, so that potentially important scenarios with deleterious disease alleles were not considered. To utilize the demographic models chosen with a coalescent simulation approach, the sample size in our simulated studies was small compared to that of studies of typical magnitude, as was the power to detect disease association. However, the main effect of an increase in sample size is an increase in statistical power, and conditions that we have simulated that have different power levels suggest that the pseudoreplication effect is most easily observed when power is high.
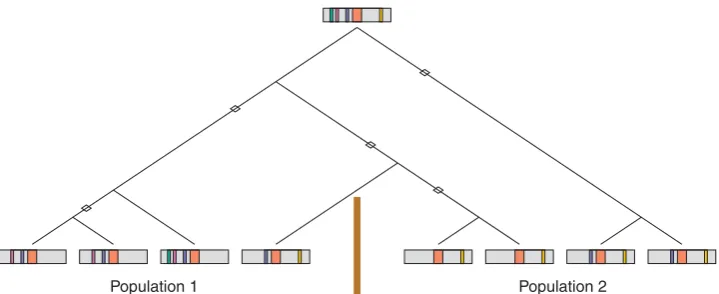
An additional limitation is that we considered replica-tion in the same populareplica-tion, whereas replicareplica-tion studies are often performed in a separate population. Due to a smaller degree of genealogical sharing for individuals from separate populations compared to individuals from the same population, the degree of correlation between studies is likely to be smaller than for pairs of studies in the same population. However, the use of different populations introduces the possibility that the history of mutations, recombinations, and divergences of genealogi-cal lineages might differ between populations; for a true disease mutation in two populations, the power to detect the mutation via indirect association studies might vary between the two populations due to differences in their linkage disequilibrium histories [Fig. 6; Hirschhorn et al., 2002; Colhoun et al., 2003; Ioannidis, 2007].
Also unlike many situations in practice, the choice to perform a second study in our simulations was not made conditional on the outcome of the first study. Thus, our framework did not take into account issues such as the potential for overestimation of effect size in the initial study and the consequent potential for overestimation of 0
0.04 0.08 0.12 0.16
0 100 200 300
Pr[G1>c and G2>c] - Pr[G1>c] Pr[G2>c]
Distance between marker and disease locus (kb)
Distance between marker and disease locus (kb) Model 1
Recessive Additive Dominant
0 0.04 0.08 0.12 0.16
0 100 200 300
Distance between marker and disease locus (kb)
0 100 200 300
Distance between marker and disease locus (kb)
0 100 200 300
Distance between marker and disease locus (kb)
0 100 200 300
Distance between marker and disease locus (kb)
0 100 200 300
Model 2
0 0.04 0.08 0.12 0.16
Model 3
4
3
2
1
0 Pr[G1>c and G2>c] / (Pr[G1>c] Pr[G2>c] )
4
3
2
1
0
4
3
2
1
[image:7.595.119.477.85.275.2]0
power in the replication study—the ‘‘winner’s curse’’ [Gorroochurn et al., 2007; Yu et al., 2007; Zo¨llner and Pritchard, 2007]. Our simulations also only considered the genealogical aspects of the properties of replication studies in unstructured populations; other factors—such as population structure, difference in sample sizes, hetero-geneity of mechanisms that produce the same disease, differences in phenotyping, and gene and gene-environment interactions—also influence outcomes of replication studies, as do differences in markers geno-typed or other differences in the genotyping procedure. An evaluation of the comparative magnitude of the pseudoreplication phenomenon in conjunction with an investigation of the effects of these various other factors remains to be performed.
Lastly, we note that our simulations focused only on pseudoreplication for marker loci closely linked to true disease loci. What about pseudoreplication of false positives, at markers not located near a causal locus? Suppose that a true disease mutation exists somewhere in the genome. Because many affected individuals in the population possess the disease mutation, ‘‘cryptic related-ness’’ [Devlin and Roeder, 1999; Voight and Pritchard, 2005] might exist, in which pairs of affected individuals would share a greater degree of recent ancestry compared to pairs in which one or both individuals were unaffected. As a result, a second sample of cases might contain more individuals from a part of the population pedigree that was overrrepresented in an initial sample. Because of shared ancestry between the two sets of cases, alleles at sites distant from the disease locus that had high frequencies in the first sample would be more likely to have high frequencies in the second sample. Thus, in principle, a false-positive finding might be replicated in a second study; similar to the scenario of pseudoreplication of true positives, shared genealogy might contribute to pseudoreplication of false positives. It is therefore possible that because of pseudoreplication resulting from cryptic relatedness across samples, false-positive findings might recur in separate studies more often than is generally appreciated. Simulations of distant markers or whole genomes rather than the single short region considered
here will be required for quantitative examination of this potentially important phenomenon.
ACKNOWLEDGMENTS
We thank S. Zo¨llner and two reviewers for the comments on a draft of the manuscript and M. Slatkin for the comments and for suggesting the use of the term ‘‘pseudoreplication.’’ This work was supported by NIH grants R01 GM081441, R01 HL090564, and T32 HG00040, by a Burroughs Wellcome Fund Career Award in the Biomedical Sciences, and by an Alfred P. Sloan Research Fellowship.
REFERENCES
Ardlie KG, Kruglyak L, Seielstad M. 2002. Patterns of linkage disequilibrium in the human genome. Nat Rev Genet 3:299–309. Balding DJ. 2006. A tutorial on statistical methods for population
association studies. Nat Rev Genet 7:781–791.
Clarke GM, Carter KW, Palmer LJ, Morris AP, Cardon LR. 2007. Fine mapping versus replication in whole-genome association studies. Am J Hum Genet 81:995–1005.
Colhoun HM, McKeigue PM, Smith GD. 2003. Problems of reporting genetic associations with complex outcomes. Lancet 361:865–872. Devlin B, Roeder K. 1999. Genomic control for association studies.
Biometrics 55:997–1004.
Ewens WJ, Roy Choudhury A, Lewontin RC, Wiuf C. 2007. Two variance results in population genetics theory. Math Popul Stud 14:93–110.
Fagundes NJR, Ray N, Beaumont M, Neuenschwander S, Salzano FM, Bonatto SL, Excoffier L. 2007. Statistical evaluation of alternative
models of human evolution. Proc Natl Acad Sci USA
45:17614–17619.
Gorroochurn P, Hodge SE, Heiman GA, Durner M, Greenberg DA. 2007. Non-replication of association studies: ‘‘pseudo-failures’’ to replicate? Genet Med 9:325–331.
Harpending HC, Batzer MA, Gurven M, Jorde LB, Rogers AR, Sherry ST. 1998. Genetic traces of ancient demography. Proc Natl Acad Sci USA 95:1961–1967.
Heffner RA, Butler IV MJ, Reilly CK. 1996. Pseudoreplication revisited. Ecology 77:2558–2562.
[image:8.595.117.477.82.229.2]Population 2 Population 1
Hirschhorn JN, Altshuler D. 2002. Once and again—issues surround-ing replication in genetic association studies. J Clin Endocrinol Metab 87:4438–4441.
Hirschhorn JN, Daly MJ. 2005. Genome-wide association studies for common diseases and complex traits. Nat Rev Genet 6:95–108. Hirschhorn JN, Lohmueller K, Byrne E, Hirschhorn K. 2002. A
comprehensive review of genetic association studies. Genet Med 4:45–61.
Hudson RR. 2002. Generating samples under a Wright-Fisher neutral model of genetic variation. Bioinformatics 18:337–338.
Hurlbert SH. 1984. Pseudoreplication and the design of ecological field experiments. Ecol Monogr 54:187–211.
Ioannidis JPA. 2007. Non-replication and inconsistency in the genome-wide association setting. Hum Hered 64:203–213.
Ioannidis JPA, Ntzani EE, Trikalinos TA, Contopoulos-Ioannidis DG. 2001. Replication validity of genetic association studies. Nat Genet 29:306–309.
Kruglyak L. 1999. Prospects for whole-genome linkage disequilibrium mapping of common disease genes. Nat Genet 22:139–144. Lin P-I, Vance JM, Pericak-Vance MA, Martin ER. 2007. No gene is an
island: the flip-flop phenomenon. Am J Hum Genet 80:531–538. Lin P-I, Vance JM, Pericak-Vance MA, Martin ER. 2008. Response to
Zaykin and Shibata. Am J Hum Genet 82:796–797.
Lohmueller KE, Pearce CL, Pike M, Lander ES, Hirschhorn JN. 2003. Meta-analysis of genetic association studies supports a contribu-tion of common variants to susceptibility to common disease. Nat Genet 33:177–182.
Marth GT, Czabarka E, Murvai J, Sherry ST. 2004. The allele frequency spectrum in genome-wide human variation data reveals signals of differential demographic history in three large world populations. Genetics 166:351–372.
McCarthy MI, Abecasis GR, Cardon LR, Goldstein DB, Little J, Ioannidis JPA, Hirschhorn JN. 2008. Genome-wide association studies for complex traits: consensus, uncertainty and challenges. Nat Rev Genet 9:356–369.
McVean GAT. 2002. A genealogical interpretation of linkage disequili-brium. Genetics 162:987–991.
Moonesinghe R, Khoury MJ, Liu T, Ioannidis JPA. 2008. Required sample size and nonreplicability thresholds for heterogeneous genetic associations. Proc Natl Acad Sci USA 105:617–622. NCI-NHGRI Working Group on Replication in Association Studies.
2007. Replicating genotype-phenotype associations. Nature
447:655–660.
Neale BM, Sham PC. 2004. The future of association studies: gene-based analysis and replication. Am J Hum Genet 75:353–362. Nordborg M, Tavare´ S. 2002. Linkage disequilibrium: what history has
to tell us. Trends Genet 18:83–90.
Ott J. 2004. Association of genetic loci: replication or not, that is the question. Neurology 63:955–958.
Plagnol V, Wall JD. 2006. Possible ancestral structure in human populations. PLoS Genet 2:972–979.
Pritchard JK, Przeworski M. 2001. Linkage disequilibrium in humans: models and data. Am J Hum Genet 69:1–14.
Redden DT, Allison DB. 2003. Nonreplication in genetic association studies of obesity and diabetes research. J Nutr 133:3323–3326. Schaffner SF, Foo C, Gabriel S, Reich D, Daly MJ, Altshuler D. 2005.
Calibrating a coalescent simulation of human genome sequence variation. Genome Res 15:1576–1583.
Skol AD, Scott LJ, Abecasis GR, Boehnke M. 2006. Joint analysis is more efficient than replication-based analysis for two-stage genome-wide association studies. Nat Genet 38:209–213. Slatkin M. 1994. Linkage disequilibrium in growing and stable
populations. Genetics 137:331–336.
Slatkin M. 2008. Linkage disequilibrium—understanding the evolu-tionary past and mapping the medical future. Nat Rev Genet 9:477–485.
Sokal RR, Rohlf FJ. 1995. Biometry, 3rd edition. New York: Freeman. Sullivan PF. 2007. Spurious genetic associations. Biol Psychiatry
61:1121–1126.
Takahata N. 1993. Allelic genealogy and human evolution. Mol Biol Evol 10:2–22.
Tenesa A, Navarro P, Hayes BJ, Duffy DL, Clarke GM, Goddard ME, Visscher PM. 2007. Recent human effective population size estimated from linkage disequilibrium. Genome Res 17:520–526. Vieland VJ. 2001. The replication requirement. Nat Genet 29:244–245. Voight BF, Pritchard JK. 2005. Confounding from cryptic relatedness in
case-control association studies. PLoS Genet 1:302–311.
Voight BF, Adams AM, Frisse LA, Qian Y, Hudson RR, Di Rienzo A. 2005. Interrogating multiple aspects of variation in a full resequencing data set to infer human population size changes. Proc Natl Acad Sci USA 102:18508–18513.
Wright FA, Huang H, Guan X, Gamiel K, Jeffries C, Barry WT, Pardo-Manuel de Villena F, Sullivan PF, Wilhelmsen KC, Zou F. 2007. Simulating association studies: a data-based resampling method for candidate regions or whole genome scans. Bioinformatics 23:2581–2588.
Yu N, Zhao Z, Fu Y-X, Sambuughin N, Ramsay M, Jenkins T, Leskinen E, Patthy L, Jorde LB, Kuromori T, Li W-H. 2001. Global patterns of human DNA sequence variation in a 10-kb region on chromosome 1. Mol Biol Evol 18:214–222.
Yu K, Chatterjee N, Wheeler W, Li Q, Wang S, Rothman N, Wacholder S. 2007. Flexible design for following up positive findings. Am J Hum Genet 81:540–551.
Zaykin D, Shibata K. 2008. Genetic flip-flop without an accompanying change in linkage disequilibrium. Am J Hum Genet 82:794–796. Zo¨llner S, Pritchard JK. 2007. Overcoming the winner’s curse:
estimating penetrance parameters from case-control data. Am J Hum Genet 80:605–615.
Zo¨llner S, von Haeseler A. 2000. A coalescent approach to study linkage disequilibrium between single-nucleotide polymorphisms. Am J Hum Genet 66:615–628.