Determining Invasive Plant Hot Spots in
Sleeping Bear Dunes National Lakeshore
to Inform Early Detection and Rapid
Response Initiatives
Patrick Canniff
A practicum in partial fulfillment of the requirements for the degree of Master of Science, School for Environment and Sustainability
Acknowledgements
Special thanks to Sleeping Bear Dunes National Lakeshore – National Park Service, Julie Christian, Julia Gehring, Dane Moeggenberg for their support in the development of this project. Michigan Invasive Species Inventory and Network, and Ines Ibanez, PhD –
University of Michigan, School for Environment and Sustainability for support and guidance in the development this project.
Table of Contents
Abstract & Introduction Page 3
Methodology Data Sources
Page 6 Page 6
Data Analysis Page 9
Results Page 11
Discussion Page 13
Conclusion Page 16
Bibliography Page 17
Appendices
Tables & Figures
Abstract:
Management of invasive plant species can be a high continual cost in terms of treatment, therefor prevention and early detection efforts are key to protecting natural areas. A tool in the arsenal of natural resource management: modeling, for invasive species in regions of lessened human impact i.e. in parks and wilderness areas creates opportunities to find trends in dispersal and increased density of invasive species to then pre-emptively assess and promote restoration efforts in order to keep out invaders. In this study “hotspots” were evaluated using the loglikelihood calculated for invasive plant diversity per square meter of trail surveyed in Sleeping Bear Dunes National Lakeshore, and significant environmental variables were assessed. The effort of this project was to determine the utility of invasive plant data collected from an Early Detection and Rapid Response program and subsequent survey during May 2018 - August 2018 for the development of a hot spot detection tool using most common species present on North and South Manitou Island in the National Lakeshore. Model results are limited in their use due to the limits of the data collected which contains high variability due to environmental variables and potential outside confounding factors since no ground-truthing has been evaluated. However, data provided from this project helps indicate regions that may have high potential for invasion and confirms some anecdotal observations of species occurrences. Additionally, recommendations from this project can be utilized to design data collection in future programs that is both rapid and can be utilized more effectively to model, evaluate, and manage invasive species hotspots with more accuracy in the future.
Introduction:
Invasive species are one of the major threats to local biodiversity and ecosystem function (Powell et al 2013). The cost of managing invasive plant species has been estimated to be $120 Billion each year (Pimentel et al. 2005). The most effective management option for prevention of invasive species spread and ensuing damage is the prevention of their establishment in the first place (Sheley et al 2015). Early detection has increasingly become a focus for management in the US, since 2004 the Federal Interagency Committee for the Management of Noxious and Exotic Weeds implemented a National Early Detection and Rapid Response System for Invasive Plants (Westbrooks 2004, FICMNEW 2003). Early detection helps to prevent ecological damage and importantly the rising costs of
management.
An emerging tool in the management of invasive species is modeling for
pivotal for tracking “sleeper” weeds, able to proliferate in novel environments due to climate change factors (Daisy et al. 2013). Management can then be guided by identifying hot spots of invasive plant diversity that can be targeted for early discovery and rapid elimination efforts. Early detention and eradication are the most effective strategies to truncate invasive species spread, and decrease risk of damage to the native community and the cost of
continual management (Simberloff 2013).
Site factors that play into increased invasion risk have been found to be associated with man modified regions, close to urban areas, and roads, or disturbed natural communities and additionally have been considered the best predictor of their arrival with ideal habitat conditions for each individual species (Bazzichetto et al. 2015, Muthukrishnan 2018). However, determining high risk habitats for establishment based on environmental
characteristics via niche modeling for individual species may not always have a clear result. Environmental characteristics may be widely varying due to the propensity for invasive species to exist in generalist-type environmental conditions (Evangelista 2008). Species characteristics also account for increased invasion risk, and may have a mixed proportion of importance in invasion, therefore modeling for invasion should be considered with care as interactions are complicated and can change with different timescales (Van Kleunen et al. 2011). Metrics for invasion are also highly dependent on morphological characteristics that can change in new environments or connected to inherent traits; these have included high biomass production across shade gradients, high rates of propagules, and other species attributes (Moravcová et al. 2015, Muthukrishnan et al. 2018).
The study region for this project was North and South Manitou islands part of Sleeping Bear Dunes National Lakeshore (SLBE) off of northwest coast of the lower peninsula of Michigan, USA (Figure 1). This island system, only foot traffic is allowed, makes this study site ideal for the identification of the environmental variables determining high concentration of invasive plants. Visitors and park rangers can only reach the island via the Manitou Island Transit ferry, with only one port of entry per island; camping is allowed at specific sites on South Manitou, whereas
backcountry camping is allowed on North Manitou; foot traffic is mainly relegated to the trail system; hence trails can easily be surveyed. All these features reduce the number of
confounding factors determining invasive species spread and establishment, allowing a better characterization of the environmental features driving invasions, and potential comparison between islands. We analyzed trail survey data for multiple invasive species with the purpose of identifying areas most likely to host introduced species that could then be targeted for early detection monitoring programs. In particular, We explored which environmental factors are most important to predict the presence and abundance of
non-native and invasive species on the Manitou islands at Sleeping Bear Dunes National Lakeshore.
Methodology
[image:6.612.331.599.207.488.2]In this study we used trail survey data to determine and predict factors that contribute to establishment of invasive species. The method of using trail survey data allows for fast identification of plants along areas that may have high spread potential due to human traffic.
Fig. 1: Upper right inset, lower peninsula of Michigan, USA. Study region of North Manitou (N), and South Manitou (S) islands. ESRI- ArcGIS
N
A combination of trail survey data with environmental data and landcover data was then be used to aid with the identification of areas likely to be colonized by non-native species. Data Sources
Field Survey
The data for this project comes from the National Park Service – Sleeping Bear Dunes National Lakeshore, citizen science data from Michigan Invasive Species and Inventory Network, and US Geological Survey data for an early detection hotspot model (MISIN). The field survey consisted of a direct visual search, and was implemented following specific steps: Upon discovery of an invasive plant, a GPS waypoint was taken. Then a visual search began perpendicular to the GPS location along the trail. Each GPS waypoint was given a unique identifier, and a six-letter genus-species code standard for SLBE (e.g. Epipactus helleborine translates as EPIHEL). Using Garmin Vista HCx GPS units, the final data inputs were strings of 13 characters: four-digit date, three-digit ID, six-digit Genus/Species code. Distance Classes were used to show area of spread relative to the pathway. Densities were represented numerically, while vegetative type and phenology were coded with letters.
Density per distance (Dx) was taken perpendicular from edge of trail or coastline: D1: 00-02 m D2: 02-10 m D3: 10-20 m D4: Over 20 m.
The values 0-4 were used to represent densities at the respective distance class:
0: 0% 1: 1-5% 2: 5-25% 3: 25-50% 4: Over 50%.
Vegetative Type data (T) was divided into three categories:
H: Herbaceous G: Grass W: Woody
V: Vegetative (H/G/W) D: Dead (H/G/W) Se: Seeding/Seedling (H/G/W) Sa: Sapling (W) F: Flowering (H/G/W) M: Mature (W).
Overall in the survey, there were a total of 1,722 GPS observations, which were utilized subsequently in model development after spatial data orientation methods, and are publicly accessible through Michigan Invasive Species Inventory and Network database (MISIN).
Ancillary Data Integration
Arc Geographical Information System (ver. 10.6.1) was used as a geospatial analytical tool in the initial data process to align environmental data with ancillary raster data. The ancillary data included soils, topographic wetness index, and data trail length. All data was 30m2 resolution and compiled utilizing a gridded 90m2 polygon layer from the Fishnet Tool in the Spatial Analyst toolbox.
Landcover was assessed originally for classifications used from the Nation Land Cover Database from the GAP/LANDFIRE National Terrestrial Ecosystems 2011 coverage (GAP/LANDFIRE 2011). The landcovers assessed from the National Land Cover Database were determined to be insignificant and, in an effort, to reduce environmental data variability they were re-classified based on the Michigan Land Cover/Use Classification System to be utilized at a more basic level-II classification and the reclassification is reported in appendix Table 3. (“Michigan Land Cover/Use Classification System”).
The soils layer was retrieved from the USGS National Resource Conservation Survey (NRCS) which included Soil polygon layer at the soil-series level (“NRCS”), and later assessed at a soil order level to reduce variability in the model.
Topographic Wetness Index (TWI) calculated from ArcGIS raster calculator from a bare-earth digital elevation model (with slope raster and flow accumulation as intermediate raster products) from USGS data portal with 30m resolution using calculation below (USGS Science Data Catalog (SDC)”, “Topographic Wetness Index”).
TWI was used as a proxy for soil moisture. In this coastal glacial region there is high sand soil content with perched glacial formed dunes, forested duneland, and a mix of soil conditions and percolation due to topography and hydrology, therefore a metric that includes hydrologic factors may be appropriate and it has been used for vegetative ecology previously (Kopecky et al 2011).
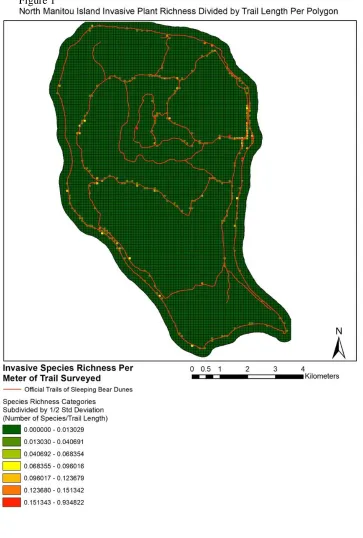
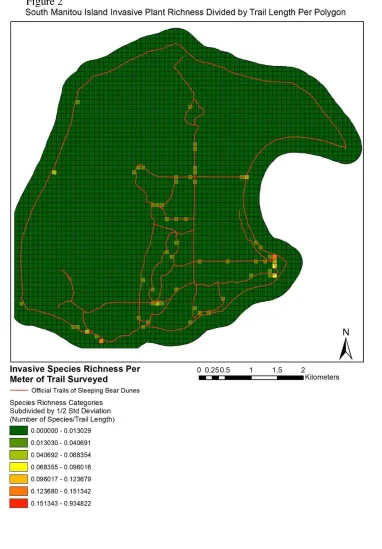
Arc GIS Trail layer data was included from trail layer publicly available from National Park Service, Integrated Resource Management Applications- IRMA website (IRMA, Struthers 1999). This layer was used to normalize the invasive species count data by trail length surveyed in order to utilize the model to evaluate other regions other than those that have trails. The results of this process for number of invasive species per meter of trail surveyed can be seen in Appendix Figure 1 and 2 for NMI and SMI.
Data was integrated using the spatial join tools in ArcGIS. All data was 30m2
resolution and compiled utilizing a gridded 90m2 polygon layer from the Fishnet Tool in the Spatial Analyst toolbox. The non-native species occurrence data was arranged to include 3 by 3 of 30m raster cells for other environmental data sampling and fit using the Fishnet tool to create 90m2 cells containing this information (ESRI 2018). A total of 12332 polygons from the Fishnet tool were created and intersected a with an island buffer of 90 meters from the islands using the NRCS soil polygon outline layer as indication of appropriate terrestrial and aquatic designation. Separation of informative and non-informative data polygons was necessary for data analysis and model building. A total of 1932 polygons of trail data were used that accounted for surveyed trail, lake, and beach data from 12332 polygons total accounting for a study region of approximately 11.10 km2.
The survey methods presented were used for EDRR trail survey and adapted for use in the analysis with two parts, a presence/absence data averaged by fishnet tool polygons and controlled for amount of trail used by species number divided by trail length, as well as an aspect that fits suitability of a polygon site based on these environmental variables.
variability in the model output, and overall likelihood of invasive process establishment in the region (Appendix Table 2).
Previous Model Data
This additional model information is presented to show all environmental variables that were considered in the project including significant environmental variables that may be used in additional projects and programs for predicting invasive species presence. The same methods as above were used for TWI, Soil orders, Land cover using the Michigan-III classification layers, and included two additional variables for Human Impact Distance and island (in the binomial model to predict differences in species presence per island),
respectively. The Human Impact Distance layer was sourced from IRMA and contained locations of Recreation on North and South Manitou Islands that represented official camping and fishing locations (only one fishing location on each island, associated with the inland lakes) (2 on NMI, 4 on SMI) (Struthers K 2001). Subsequently, this layer was used to creation the variable Human Impact Distance by measuring Euclidean distance from each cell centroid to these locations calculated separately for each island. Models resulting from this variable found this to be insignificant and was not included in the final models.
Data analysis
For model development we used hierarchical Bayesian inference with Markov-Chain Monte-Carlo from OpenBUGS(Ver. 3.2.3) software for parameter estimation and to run this model (OpenBUGS 2019, Gelfand et al. 1990, Lund et al. 2009). All models were evaluated using deviance information criterion (DIC), and adj. R2 values (Spiegelhalter 2014).
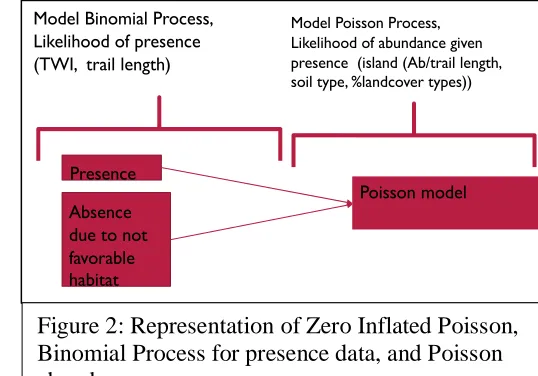
The model we used is a mixed effects model Zero Inflated Poisson which is a two-fold model, where a binomial model is used due to inflated zeros in the distribution of the data, then count data is modelled through a Poisson distribution. First all zeros are separated by positive count data in order to assign occurrence of an invasive plant, then secondary to assign abundance of plant species per trail length and other predictors included in the poisson model (Zuur et al. 2009).
vegetative presence models (Renner et al. 2013, Wang et al. 2018, Aarts et al. 2012). The likelihood from species presence was determined from a binomial process model that subsequently feeds into a logit process model giving the likelihood of species abundance based on predictor variables: soil type (included 21 general soil types classified to series level), topographic wet index (TWI), Island type (1= North Manitou, 2 = South Manitou) and land cover (11 types- USGS classification soil series). The best resulting model is presented here:
𝑁𝑜. 𝑠𝑝𝑒𝑐𝑖𝑒𝑠𝑖~𝑍𝑒𝑟𝑜 𝐼𝑛𝑓𝑙𝑎𝑡𝑒𝑑 𝑃𝑜𝑖𝑠𝑠𝑜𝑛(𝜆𝑖)
𝑙𝑛(𝜆𝑖) = 𝛼𝑆𝑜𝑖𝑙 𝑡𝑦𝑝𝑒 (𝑖)+ 𝑏𝑖 ∗ 𝑇𝑊𝐼 + 𝑢𝑖
Species Presence~ Binomial(𝜔0𝑖)
𝐿𝑜𝑔𝑖𝑡(𝜔0𝑖) =+ w ∗ Trail_Length[i]
Land cover types were included during previous model development and it was
determined that at NLCD vegetation types in the
previous model that these classes were not significant and were removed to develop a better indication of invasion and establishment of these plant species for this model. Later these classes were reclassified to Michigan Landcover Level-III to reduce variability see Appendix Table 3 (“Michigan Land Cover/Use Classification System”). A few vegetation types did become influential with soil types layered at simpler than class III levels, but improvement led to using soil types at the soil order level.
Additional Model Analyses
Model presented below was evaluated containing other relevant variables and is provided for context in the assessment of the other variables that were considered in this model
development.
𝑁𝑜. 𝑠𝑝𝑒𝑐𝑖𝑒𝑠𝑖~𝑍𝑒𝑟𝑜 𝐼𝑛𝑓𝑙𝑎𝑡𝑒𝑑 𝑃𝑜𝑖𝑠𝑠𝑜𝑛(𝜆𝑖)
𝑙𝑛(𝜆𝑖) = 𝛼𝑆𝑜𝑖𝑙 𝑡𝑦𝑝𝑒 (𝑖)+ 𝑏𝑖 ∗ 𝑇𝑊𝐼 + 𝑐𝑖 ∗ 𝐿𝑎𝑛𝑑𝑐𝑜𝑣𝑒𝑟 + 𝑑𝑖 ∗ 𝐻𝑢𝑚𝑎𝑛𝐼𝑚𝑝𝑎𝑐𝑡𝐷𝑖𝑠𝑡𝑎𝑛𝑐𝑒 + 𝑢𝑖
Species Presence~ Binomial(𝜔0𝑖)
𝐿𝑜𝑔𝑖𝑡(𝜔0𝑖) =(𝑖𝑠𝑙𝑎𝑛𝑑 (𝑖))+ w ∗ Trail_Length[i]
Presence
Absence due to not favorable habitat
Poisson model Model Binomial Process,
Likelihood of presence (TWI, trail length)
[image:11.612.325.594.200.388.2]Model Poisson Process, Likelihood of abundance given presence (island (Ab/trail length, soil type, %landcover types))
Results:
Additional Model Results
Additional results from model development are presented due to their insights into significant and nonsignificant environmental variables considered. Due to potential
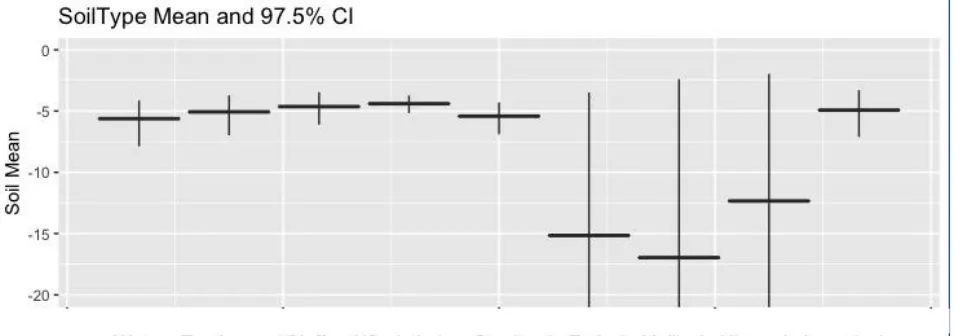
differences between North Manitou and South Manitou Islands from deer populations, visitor stay duration, and activities it made sense to separate the effects of the islands for species presence, however later analysis determined this was not significant for the presence of the invasive species surveyed. There was no significant difference between earlier presence models for the two islands with overlapping 95% Confidence Interval (CI) for NMI, and SMI. Indicating that for this model and evaluation there is no difference between the invasive plant likelihood for presence. The effect of human impact distance in these models was also determined to be insignificant.
There were a few significant variables found for a previous model that were not included in the best fit model. These variables were from the Landcover dataset, the inclusion of these variables increased the DIC by 12.5 points and decreased the resulting Adj. R2 values when included with soil and TWI (Appendix Table 1). The significant landcovers were two types which can include four landcover types if evaluated at two standard deviations
(pvalue=.10, 90% CI). The two landcovers are Hardwood forest and Conifer, and the four include (3 & 7) Wetland, and Grass Forb regeneration. In this same model soil type Mollisols became significantly different from the other soil types, which is typically associated with grassland and are highly fertile soils potentially indicating an ease of invasion for the Forb Grass landcover community.
Discussion:
and abundance of species in the region. The use of Bayesian analysis for this data allows for more data flexibility including estimation of missing variables to be included and use of other survey data or management data to be included in future studies.
There are specific limitations of the model used, specifically due to range of observations for species, for example only one emergent aquatic species (Pharagmites australis) was noted, and very few woody plant species such as Syringa vulgaris, Robinia pseudoacacia, and Populus nigra, therefore this model may not truly represent the selective environmental factors behind all potential shrub and tree species that are present or may become present in the future. The results of this model indicate that there is not a significant difference in presence of invasive plant species between the two islands with overlapping confidence intervals. This may be attributed to the spatial proximity that these islands share which may share similar introduction of invasive plant species and disturbances to their similar soils and vegetation, or due in part to large environmental variability present in aggregation of the data. Additionally, some differences in future models may detect a difference based on the presumption of differing human impacts between the islands; where South Manitou receives day trip visitors from the ferry (higher foot traffic) and has camping only at three campgrounds across the island, North Manitou is mostly wilderness designated and has backcountry camping across the entirety of the island, therefore disturbances of hiking and camping may have similar impact and be spatially distinct between the two. A camping and invasive species study could highlight the effect of backcountry invasives spread. In addition, North Manitou Island has a population of non-native Pennsylvania (originating) deer which forage across the island and may affect the spread certain invasive species and potential for additional presence differences between the islands though once again we did not find any island differences in previous model and in current model.
Examining the loglikelihood map in Figure 3, there is a large portion of the purple regions where there is seemingly very little difference in most of the island data and
loglikelihoods which seems to be associated with higher elevation and lower TWI portions of the Island in blue.
In Figures 5 and 6, the predictions of the model are presented using a standard
deviation value. This method of separation is to help comparatively whether a site has higher or lower invasive species (in terms of number of invasive species per meter trail) potential. We can see in both maps that there are concentrated areas in central common use trail areas the eastern portion of NMI which may be associated with the location of the Manitou Island Transit ferry. Additionally, a large area in the middle of NMI which is associated with Lake Manitou which had a concentrated presence of non-native phragmites and may be driving this hotspot in particular (it is also one of the few aquatic emergent species surveyed). In the central regions of NMI, there are yellow to red portions of areas that also align with former agricultural fields and farmlands through observation, which may be a future relationship to explore in management. There are regions in green which are relatively less prone to invasive species presence and these are in more remote regions of the island that have higher elevation and sloped areas, potentially making them inaccessible to human traffic and spread of
invasives (or less disturbance facilitated invasion of invasive species). In SMI there are also “hot” regions in the area where the ferry and subsequently visitors arrive, on the eastern lower end (south end of Crescent bay). Additionally, there are areas in the interior that are high in the central trails’ areas, and are green as distance to trails increase, and the
slope/elevation increase in the western portion of the island. A hot spot is also associated with Florence lake on the island, potentially due to phragmites and the detection on NMI. In comparison to the initial values of invasives on NMI and SMI, it appears that SMI may have higher potential for invasion based on the analysis presented here.
presence due to human impact. Additionally, soil and landcover layers were used from secondary sources whereas systematic soil sampling and landcover classification on site may help guide more precise data relationships and decrease some of the variability in the model.
In the previous model assessing landcover types, most of the trails are within Hardwood and Conifer landcover with areas on NMI and SMI covered by Hardwood (8 million sq. meters) and Conifer forests (189 thousand sq. m). Therefore, the significance of Hardwood especially may be due in part from the sheer presence of area that is associated with invasive plants species, though additional data collection may prove or disprove these considerations. The inclusion of Wetland and Grass Forb generation areas with 90% CI, can tell us that other wetland attributes other than TWI, the canopy cover, or disturbance (in the case of Grass and Forb areas) likely influence the establishment of invasive plant species as well.
Despite the restrictions on the best fit model, the previous models also contain variables that can provide additional information relevant to future model developments, studies, and invasive species management. Despite a higher DIC value and lower Adj. R2 the results of lesser models can still show environmentally relevant data through significance in variables assessed in model evaluation.
Conclusion:
No single model is superior in all circumstances (Elith et al 2006). This model
accounts for fourteen common species in potentially different stages of invasion, with a trend towards species actively invading and becoming established, or have already been
to combat this issue relative values were compared using standard deviations from the meant to show potential for invasive species presence. To improve similar model development, this study suggests that use of trail survey or other common plant treatment data may be used for presence-absence models and may be improved with the additional refinement of soil, landcover characteristics, and human impact data. The trail survey adapted for this study used presence-only data for species, however, future studies with data points per individual plant may be a more robust adaptation of the model methodology presented in this study. For environmental data improvements, soil data variability could be reduced through systematic plot sampling throughout the study region if a trail survey is conducted, or through sampling the soil within vegetation plots systematically chosen in the study region. Additional
environmental variables may also benefit a future model as shown with previous land cover analysis, there is likely benefits with inclusion of % canopy cover, field measured distance to disturbance (natural or human induced), or indications of native plant richness or diversity in regions which may explain whether occupation by native species may help to prevent
invasive species establishment due to barriers to entry through competition.
With additional model development for rapid data collection and analysis, then the prediction of invasive species abundance across Sleeping Bear Dunes National Lakeshore and other large natural areas could be more accurate in their assessments and rapid in their responses. The results of this effort present the findings that in addition to rapid trail surveys that using a systematic sampling study design may be more robust despite increased time for sampling and design, due to the lengthy model development, computational requirements, and increased data analysis time associated with trail surveys.
Bibliography
Bazzichetto, M., et al. Plant invasion risk: A quest for invasive species distribution modelling in managing protected areas, Ecological Indicators, Volume 95, Part 1, 2018, Pages 311-319, ISSN 1470-160X, https://doi.org/10.1016/j.ecolind.2018.07.046.
Clark, J. S., et al. 2010. High-dimensional coexistence based on individual variation: a synthesis of evidence. Ecological Monographs 80:569–608.
Daisy, E.D., et al. "Next-Generation Invaders? Hotspots for Naturalised Sleeper Weeds in Australia Under Future Climates." PLoS One, vol. 8:12, 2013.
ESRI 2018. ArcGIS Desktop: Release 10.6.1. Redlands, CA: Environmental Systems Research Institute.
Evangelista, P., Kumar, S., Stohlgren, T., Jarnevich, C., Crall, A., Norman, J., & Barnett, D. (2008). Modelling Invasion for a Habitat Generalist and a Specialist Plant Species. Diversity and Distributions, 14(5), 808-817. Retrieved from
http://www.jstor.org.proxy.lib.umich.edu/stable/20172037
FICMNEW- Federal Interagency Committee for the Management of Noxious and Exotic Weeds, "A National Early Detection and Rapid Response System for Invasive Plants in the United States, Conceptual Design" (2003). All U.S. Government Documents (Utah Regional Depository). Paper 129.
GAP/LANDFIRE - U.S. Geological Survey Gap Analysis Program, 20160513, GAP/LANDFIRE National Terrestrial Ecosystems 2011: U.S. Geological Survey, https://doi.org/10.5066/F7ZS2TM0.
Gelfand, A. E. and Smith, A. F. M. (1990) Sampling-based approaches to calculating marginal densities, Journal of the American Statistical Association 85: 398--409 Ibanez, I., J. A. Silander, J. M. Allen, S. A. Treanor, and A. Wilson. 2009. Identifying
hotspots for plant invasions and forecasting focal points of further spread. Journal of Applied Ecology 46:1219–1228.
Ibanez, I., et al. 2014. Integrated assessment of biological invasions. Ecological Applications 24:25-37
Kopecky, M. & Cizkova, S. ( 2010) Using topographic wetness index in vegetation ecology: Does the algorithm matter? Applied Vegetation Science, 13, 450– 459. Lodge, D. M., et al. 2006. Biological invasions: Recommendations for U.S. policy and management. Ecological Applications 16:2035–2054.
“Michigan Land Cover/Use Classification System.” Lansing: Dept. of Natural Resources, 1975.
MISIN - Michigan Invasive Species Information Network, Michigan State University, 10 Apr. 2019, www.misin.msu.edu.
Moravcová, L., Pyšek, P., Vojtěch Jarošík, & Pergl, J. (2015). Getting the right traits: Reproductive and dispersal characteristics predict the invasiveness of herbaceous plant species. PLoS One, 10(4)
doi:http://dx.doi.org.proxy.lib.umich.edu/10.1371/journal.pone.0123634
Muthukrishnan, R., Davis, A. S., Jordan, N. R., & Forester, J. D. (2018). Invasion complexity at large spatial scales is an emergent property of interactions among landscape characteristics and invader traits. PLoS One, 13(5)
doi:http://dx.doi.org.proxy.lib.umich.edu/10.1371/journal.pone.0195892
“NRCS - Natural Resources Conservation Service.” Soil Survey | NRCS Soils, 2018, www.nrcs.usda.gov/wps/portal/nrcs/main/soils/survey/.
“OpenBUGS - License.” OpenBUGS. Copyright (C) 1989, 1991 Free Software Foundation,
Inc. 59 Temple Place - Suite 330, Boston, MA 02111-1307, USA, Contributors: David
Spiegelhalter, Nicky Best, Dave Lunn and Ken Rice, 2019, www.openbugs.net/w/Downloads.
Pimentel, D. et al. 2005. Update on the environmental and economic costs associated with alien-invasive species in the United States. Ecological Economics, 52:273-288.
Powell, K. I., et al. “Invasive Plants Have Scale-Dependent Effects on Diversity by Altering Species-Area Relationships.” Science, vol. 339, no. 6117, 2013, pp. 316–318.,
doi:10.1126/science.1226817.
Renner, I. W. and Warton, D. I. (2013), Equivalence of MAXENT and Poisson Point Process Models for Species Distribution Modeling in Ecology. BIOM, 69: 274-281.
doi:10.1111/j.1541-0420.2012.01824.x
Sheley, R. L., Sheley, J. L., & Smith, B. S. (2015). Economic savings from invasive plant prevention. Weed Science, 63(1), 296-301. Retrieved from
http://proxy.lib.umich.edu/login?url=https://search-proquest-com.proxy.lib.umich.edu/docview/1660906657?accountid=1466
Simberloff, Daniel. (2013). Invasive species : what everyone needs to know /. New York : Oxford University Press, [2013].
Struthers K. 1999. Trails. Sleeping Bear Dunes National Lakeshore. IRMA - https://irma.nps.gov/DataStore/Reference/Profile/1023708
Struthers K. 1999. Recreation. Sleeping Bear Dunes National Lakeshore. IRMA - https://irma.nps.gov/DataStore/Reference/Profile/1023686
“Topographic Wetness Index (TWI).” GIS 4 GEOMORPHOLOGY, 2019, gis4geomorphology.com/topographic-index-model/.
“USGS Science Data Catalog (SDC).” U.S. Geological Survey Science Data Catalog,
data.usgs.gov/datacatalog/#fq=dataType%3A(collection%20OR%20non-collection)&q=*%3A*.
Van Kleunen, M., Schlaepfer, D., Glaettli, M., & Fischer, M. (2011). Preadapted for invasiveness: Do species traits or their plastic response to shading differ between invasive and non-invasive plant species in their native range? Journal of Biogeography, 38(7), 1294-1304. Retrieved from http://www.jstor.org.proxy.lib.umich.edu/stable/20870181
Westbrooks, R. G., “New Approaches for Early Detection and Rapid Response to Invasive
Plants in the United States.” Weed Technology, vol. 18, 2004, pp. 1468–1471.
Yan Wang and Lewi Stone, Understanding the connections between species distribution models for presence-background data, Theoretical Ecology, 10.1007/s12080-018-0389-9, 12, 1, (73-88), (2018).
Zuur, A. F., E. N. Ieno, N. J. Walker, A. A. Saveliev, and G. M. Smith. 2009. Mixed effects models and extensions in ecology with R. Springer ScienceþBusiness Media, New York, New York, USA.
APPENDIX FIGURES/TABLES Table1: Model Evaluations:
Models DIC Adj. R2
Model 1 Soil & TWI
(Best) Zeros: 255.5 0.01843
Model 2 Soil, TWI,
Table2: Included Species
*= Included in Model (14 most common species)
GENUS SPECIES COMMON NAME
Acer platanoides Norway maple
Anthriscus sylvestris Wild chervil
Arctium* minus* Lesser burdock*
Asparagus officinalis Garden asparagus
Berteroa incana Hoary alyssum
Bromus inermis Smooth brome
Centaurea stoebe Spotted knapweed
Chenopodium album Lambsquarters
Cirsium arvense Canada thistle
Convallaria majalis European lily of the valley
Cynoglossum officinale Houndstongue
Daucus carota Queen Anne's lace
Elaeagnus umbellata Autumn olive
Epipactis* Helleborine* Broadleaf helleborine*
Euphorbia cyparissias Cypress spurge
Hemerocallis fulva Orange daylily
Hieracium aurantiacum Orange hawkweed
Hieracium caespitosum Meadow hawkweed
Hypericum* perforatum* Common St. Johnswort*
Hylotelephium telephium Witch's moneybags
Iris pseudacorus Yellow flag iris
Lathyrus latifolius Perennial pea
Leymus arenarius Lymegrass
Leonurus cardiaca Common motherwort
Leucanthemum vulgare Oxeye daisy
Lilium lancifolium Tiger lily
Linaria vulgaris Butter and eggs
Lonicera tatarica Tatarian honeysuckle
Silene coronaria Rose campion
Melilotus* albus* White sweet clover*
Medicago lupulina Black medic
Mentha xpiperita Peppermint
Nepeta cataria Catnip
Phalaris* arundinacea* Reed canarygrass*
Phragmites* australis* Phragmites (Invasive) *
Plantago lancelota Narrowleaf plantain
Plantago major Common plantain
Populus* nigra* Lombardy poplar*
Rhodotypos scandens Black jetbead
Robinia* pseudoacacia* Black locust*
Rumex crispus Curly dock
Rumex* obtusifolius* Bitter dock*
Saponaria* officinalis* Bouncingbet*
Silene latifolia White campion
Solanum dulcamara Bittersweet nightshade
Spiraea xvanhouttei Vanhoutte spirea
Stellaria graminea Grass-like starwort
Syringa* vulgaris* Common lilac*
Taraxacum officinale Common dandelion
Torilis japonica Japanese hedgeparsley
Tragopogon dubius Yellow salsify
Trifolium pratense Red clover
Typha angustifolia Narrowleaf cattail
Veronica* officinalis* Common gypsyweed*
Veronica serpyllifolia Thymeleaf speedwell
Verbascum* thapsus* Common mullein*
Vinca minor Common periwinkle
Vicia* Villosa* Winter vetch*
Table3: Landcover Reclassification for Michigan Land Cover/Use Classification System Level III Categories
0 Mixed (Hardwood and Conifer)
1 Hardwood
2 Wetland
3 Conifer
4 Plantation
5 Hay
6 Grass_Forb
7 Open Water
8 Barren
9 Farmstead
SOIL KEY
Soil Series Abbreviation Grouped by Soil Order
Lake_bluffs Lk 1 Erosion and Bluffs
Emmet-Omena_sandy_loams Es 2 Alfisol
Lake_beaches Lb 3 Lake
Leelanau-East_Lake_loamy_sands Ll 4 Spodosol
East_Lake_loamy_sand Ea 4 Spodosol
Dune_land Du 5 Entisol
Eastport_sand Ed 5 Entisol
Deer_Park_sand Dk 5 Entisol
Mancelona-Richter_gravelly_sandy_loams
Mr 4 Spodosol
Au_Gres-Kalkaska_sands Au 4 Spodosol
Water W 0 Water
Deer_Park-Roscommon_sandss Dr 5 Entisol
Alpena_gravelly_sandy_loam As 6 Mollisol
Houghton-Adrian_mucks Ah 7 Histosol
Wallace-Kalkaska_sands Wk 4 Spodosol
Wind_eroded_land,_sloping Wl 1 Erosion and Bluffs Kalkaska-East_Lake_loamy_sands Ke 4 Spodosol
Kaleva_sand Ka 4 Spodosol
Mancelona_sandy_loam Md 4 Spodosol
Tonkey-Munuscong-Iosco_sandy_loams Tm 8 Inceptisol *Additional soil series were present in
the full (including regions not surveyed) North and South Manitou Island dataset and were reduced to their soil order, except in the case of Water, and a grouped category for Erosion and Bluffs