Computational Models for the Combination of Advice and
Individual Learning
Guido Biele,
aJo¨rg Rieskamp,
a,bRichard Gonzalez
c aMax Planck Institute for Human Development b
Department of Psychology, University of Basel c
Department of Psychology, University of Michigan, Ann Arbor
Received 6 August 2007; received in revised form 2 June 2008; accepted 5 June 2008
Abstract
Decision making often takes place in social environments where other actors influence individuals’ decisions. The present article examines how advice affects individual learning. Five social learning models combining advice and individual learning-four based on reinforcement learning and one on Bayesian learning-and one individual learning model are tested against each other. In two experiments, some participants received good or bad advice prior to a repeated multioption choice task. Receivers of advice adhered to the advice, so that good advice improved performance. The social learning models described the observed learning processes better than the individual learning model. Of the models tested, the best social learning model assumes that outcomes from recommended options are more positively evaluated than outcomes from nonrecom-mended options. This model correctly predicted that receivers first adhere to advice, then explore other options, and finally return to the recommended option. The model also predicted accurately that good advice has a stronger impact on learning than bad advice. One-time advice can have a long-lasting influence on learning by changing the subjective evaluation of outcomes of recommended options.
Keywords: Reinforcement learning; Social learning; Advice taking; Learning model; Decision making
Many decisions are made in a social context, where decision makers can observe others’ decisions or receive advice from other people. Accordingly, it has frequently been argued that we learn how to make decisions from others (e.g., Bandura, 1977; Henrich & McElreath, 2003; Laland, 2001; Schotter & Sopher, 2003; Simon, 1990). Social information seems especially valuable in situations of uncertainty (Festinger, 1954), for instance, when
Correspondence should be sent to Guido Biele, Max Planck Institute for Human Development, Lentzealle 94, 14195 Berlin, Germany. E-mail: [email protected]
Copyright2009 Cognitive Science Society, Inc. All rights reserved. ISSN: 0364-0213 print / 1551-6709 online
decision makers have little knowledge about the judgment domain, when choice options’ outcomes seem similar, or when information about choice options needs to be collected through first-hand experience.
In many real-life situations people learn to make better decisions based on the experi-enced consequences of their own decisions (Barron & Erev, 2003; Busemeyer & Myung, 1992; Denrell, 2005; Hertwig, Barron, Weber, & Erev, 2004; March, 1996). For exam-ple, decision makers learn inference strategies to judge companies’ credit worthiness (e.g., Rieskamp & Otto, 2006) or strategies for social interaction (e.g., Stahl, 1996), con-sumers choose detergents based on their experience with different brands (e.g., Erdem & Keane, 1996), and through experience investors learn how to allocate financial resources (e.g., Goetzmann & Massa, 2002; Rieskamp, 2006a; Rieskamp, Busemeyer, & Laine, 2003).
Empirical evidence suggests that decision makers do not rely exclusively on their own experience in these situations, but they also learn from others. For instance, employees learn how to make decisions from their colleagues (Gibson, 2004), consumers can get advice from
friends or publications such as Consumer Reports; and investors are influenced by other
investors’ decisions (e.g., Roider, Drehmann, & Oechssler, 2007). In the present article, we argue that in decision situations characterized by uncertainty and incomplete knowledge, advice strongly influences people’s learning processes. Specifically, we examine how one-time advice from another person influences individual learning processes in repeated choice tasks.
In the next section, we briefly review research on individual and social learning in decision making. Then we introduce the experimental paradigm we used and report whether decision makers follow advice (Experiment 1). We present the learning models and examine how well they describe behavior of the receivers of advice (henceforth ‘‘receiv-ers’’). Experiment 2 was designed specifically to test the models that best explained the data from Experiment 1. We conclude with a general discussion.
1. Experienced-based decision making and learning
accuracy of various learning models for a two-armed-bandit task with repeated choice between two options. They showed that an exponential smoothing model, which exponen-tially weighs past experiences to determine current expectations, best predicted the repeated choices. Erev and Barron (2005) (see also Rieskamp, 2006b; Rieskamp & Otto, 2006) pro-posed a learning model which assumes that people learn to choose among cognitive strate-gies. Yechiam and Busemeyer (2005) examined the various assumptions of learning models, for example, they compared learning models’ various updating rules for integrating new experiences with accumulated past experience. They found that learning models that assume that choice propensities decay as a function of time alone, independently of whether an option was chosen or not, explained the data better than models which assume that for-getting old experience is limited to the currently updated option. In sum, this research sug-gests that decision making from experience can be aptly described by simple learning models that assume people form choice propensities based on exponentially discounted experience, and that they then decide based on these propensities.
2. Social learning and decision making
A feature common to all the learning models mentioned above is the assumption that learning is based exclusively on individual experience. In contrast, theories of social learning describe how social information influences people’s behavior. Bandura’s (1977) prominent social learning theory assumes that people learn—simple behavior as well as complex concepts—by observation and cognitive modeling (Rosenthal & Zimmerman, 1978; Zimmerman & Rosenthal, 1974).
Past research on social learning has examined the impact of social interaction or face-to-face interaction on learning. Recent research has followed a broader definition of social
learning that includes decision making and learning processes influenced by social
informa-tion gathered from others, and which was not necessarily acquired through any personal
interaction. We follow this broader definition of social learning. Recent social learning research also places stronger emphasis on computational models of social learning. For instance, inspired by Boyd and Richerson’s (1985) theory of gene–culture coevolution, McElreath et al. (2005) proposed a model of imitation learning that combines individual learning with social learning by assuming that a choice option is reinforced through received payoffs and through the observation that others choose that option. Apesteguia, Huck, and Oechssler (2007) examined imitation behavior in repeated social interactions. They reported that the probability of imitating another person increases with the payoff difference between the learner and the other person, so that more successful players are more likely to be imitated (see also Schlag, 1998, 1999).
Rantilla (2000) described how decision makers integrate expert opinions with a model that weights experts’ advice according to the amount of information that advisors had available to generate advice. Yaniv and Kleinberger (2000) found that decision makers gave too little weight to others’ advice, and Yaniv (2004b) reported that more-knowledgeable decision makers discount advice more frequently than less-knowledgeable decision makers. Impor-tantly, Yaniv (2004a,b) pointed out that advice from independent decision makers generally improves performance. In sum, while the experimental tasks and objectives of research on social learning are diverse, a common finding is that people do not rely exclusively on either their own judgment or on received advice, but they combine both.
We provide a complement to existing models of advice taking by explaining how advice affects individual learning. Earlier models of advice taking have focused on single decisions and not on repeated choices, as we do. The work on imitation learning has examined people’s behavior when others’ behavior can be observed on a trial-by-trial basis. In con-trast, we focus on a situation in which the decision maker cannot observe and imitate others’ behaviors but solves the task in isolation after receiving an initial piece of advice. To describe how the individual learning process is affected by advice we propose and test several learning models. Our social learning models are built upon simple learning mod-els because these modmod-els have been successful in describing people’s decisions in repeated choice tasks, as described above.
3. Experiment 1
Experiment 1 examined how social learning influences choice. Participants individually solved a repeated choice task in which they could learn to choose the best alternative. Additionally the participants received advice on how to solve this task. In the experiment, the Iowa Gambling Task (Bechara et al., 1994) was presented to participants. The IGT is a type of armed bandit task in which participants try to obtain high rewards by repeatedly choosing the best of four choice options, which are associated with different payoff distri-butions. Participants receive feedback about the outcomes of their choices to learn which of the several options provides the highest average payoff. The challenge of the IGT lies in the options’ payoff distributions. The options that lead on average to the highest payoffs frequently lead to low gains but do not encounter high losses. In contrast, options that lead on average to low payoffs frequently lead to larger gains but lead to even higher losses.
variance), whereas the other deck had rare but higher losses (high variance). The applied payoff schedule was identical to the schedule introduced by Bechara et al. (1994), which has the property that the decks’ average payoffs are maintained for blocks of 10 choices. A crucial property of this schedule is that losses from the bad decks occur relatively late, so that the bad decks initially seem to be better. Participants usually need at least 20 trials to learn which decks are best, and after that they still frequently choose one of the bad decks (Maia & McClelland, 2004).
Experiment 1 examines whether social learning can improve decision makers’ perfor-mance by helping them detect the good decks earlier and also by increasing their likelihood of choosing good decks later in the task. An important property of the IGT is that the two good decks have identical expected payoffs, so that adherence to advice can be tested by examining how frequently participants stay with the recommended deck in the presence of an equally attractive alternative (henceforth ‘‘corresponding deck’’).
3.1. Design
To examine the effect of social learning, participants performed a computerized version of the IGT with and without advice. Participants in the independent condition performed the task without receiving or giving advice. Participants in the advisor condition performed the IGT without receiving advice, then chose one of several predetermined advice strategies for another participant, and finally performed the IGT again. Participants in the receiver
condi-tion received advice from an advisor and then performed the IGT.1
3.2. Participants and procedure
Ninety participants, mostly students from the Free University of Berlin (54% women; mean age of 25 years), were randomly assigned to the three conditions. The experiment was conducted in sessions with two to six participants. In the independent condition, par-ticipants were instructed that they were taking part in a decision-making experiment in which they would repeatedly choose cards from four card decks. It was then explained that drawing a card would always lead to a gain or a loss, which would be depicted on the back of the card, and that the gain or loss would be added to their account. The instructions also explained that one could learn during the experiment which payoffs were associated with which decks.
After the introduction of the task, participants were told that they would start the task with an initial endowment of 10 euros. They were reminded that they would receive their final account balance minus the 10-euro initial endowment as a variable payment. In addi-tion to performance-contingent payment, all participants received a show-up payment of 5 euros. In the rare case that the final account balance minus the 10-euro initial endowment was negative, participants still received the show-up payment of 5 euros, but they only learned this after the experiment. Finally, participants were briefly instructed about the graphical user interface (see Fig. 1) used to conduct the experiment. After choosing from a deck by clicking on it, the display showed participants the gain (in green) and the loss (in red) associated with the card. At the same time, the overall account was updated with the payoff of the current choice. Participants clicked the ‘‘continue’’ button to go on to the next trial. The minimum time interval between two choices was fixed to 3 s; no upper time limit was set.
[image:6.486.126.352.90.267.2]Advisors received the same information as the independent decision makers, plus addi-tional information about their role as advisors. Specifically, they were first informed that they would advise another participant who would perform the identical task. To be able to evaluate whether receivers actually followed the advice, a set of four feasible recommenda-tions was predefined, namely, ‘‘always choose from deck A’’ (or ‘‘B,’’ or ‘‘C,’’ or ‘‘D’’). The feasible advice was presented to advisors before they made their first 100 choices. Advisors were not informed that they would encounter the same task again after giving the advice (henceforth the second 100 choices). Advisor and receiver always participated in the same session. To communicate advice, an advisor marked his or her advice with a pen on a form, which was then given to the receiver. To motivate advisors and to make them credible to receivers, they received an amount equal to 50% of the receiver’s payoff, in addition to the payoff from their own choices.
Receivers were first provided with the instructions for the IGT and then with a form where one of the feasible lines of advice was marked by an advisor in the same session. Receivers were aware that the advisor was in the same experimental session. To prevent per-sonal communication between advisor and receiver, they were seated in separate cubicles. To clarify the experience and motivation of advisors, receivers were informed that the advi-sor had participated in the same task prior to choosing his or her recommendation, and that the advisor would receive a payment equivalent to 50% of the receiver’s payment from the IGT. As in the other conditions, receivers’ payments varied depending on their performance in the IGT.
3.3. Results
3.3.1. Choices and performance
Participants earned, on average, 5.02 euros (SD = 5.31) in the IGT. Independent decision
makers chose one of the two good decks, on average, in 62% (SD = 14%) of the 100 trials,
which is less than the proportion of 78% (SD= 2%) in which advisors chose one of the
good decks in their last 100 trials, t(29) = 4.13, p < .001,d = 1.06, and less than receivers
with 73% (SD = 17),t(29) = 2.54,p< .001,d = .66. Receivers chose one of the good decks
across their 100 trials more frequently than advisors in their first 100 trials, t(29) = 3.11,
p = .003, d= .8. The advisors chose one of the good decks in 59% (SD= 14) of the first
100 trials and in 78% of the last 100 trials; thus, they improved their performance
signifi-cantly from the first to the second block of 100 trials,t(29) = 4.75,p < .001,d= 1.23.
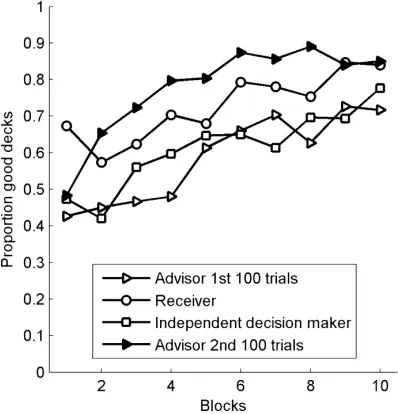
Fig. 2 shows, in blocks of 10 trials each, the proportion of participants who chose one of the two good decks. This proportion declined at the beginning (i.e., 10–20 trials) for all groups, with the exception of the advisors at the beginning of their second 100 trials (i.e., postadvice giving). Fig. 2 also shows that in the first 10 trials receivers performed better than advisors in the beginning of their second 100 trials. However, starting at about trial 15, the receivers performed worse than the advisors, and only at the end of the 100 trials did both groups perform equally well again. In sum, advice generally improved performance, compared to inexperienced participants, with the advantage being especially large in the early trials.
3.3.2. Giving and following advice
A large majority of participants (28; 93%) in the role of advisors gave good advice. Of these 28 advisors, 19 proposed the good deck with a high payoff variance (rare but high losses) and nine proposed the good deck with a low payoff variance (frequent but low
losses). Advisors chose the deck they recommended on average 42% (SD= 19%) of the first
100 trials, indicating that they recommended their preferred deck.
To examine the influence of advice we tested whether receivers chose the recommended deck (regardless of whether the advice was good or bad) more frequently than the corre-sponding deck with the same expected payoff. Receivers chose the good deck with low
vari-ance when it was recommended, on average, in 62% of the trials (SD= 9%), whereas the
for the good deck with high variance was 69% (SD = 9%) when it was recommended but
only 7% (SD= 3%) otherwise. Fig. 3 shows the development of choice proportions over the
100 trials and reveals that adherence to advice declined from the first block (all participants chose the recommended deck in the first round) to the second block and then rebounded to high adherence rates again. We refer to this sequence as the adherence–exploration–adher-ence pattern. Altogether, the results show a strong influadherence–exploration–adher-ence of advice on choices because receivers clearly preferred the recommended deck to the corresponding deck with the same expected payoff.
The analyses show that participants without advice learned to choose the good decks, receivers followed the advice they received, and having received advice gave the receivers an advantage—especially in the early choices. The decline and rebound of the probability with which receivers chose according to the advice suggests that they combined recommen-dations with individual experience to determine which choice to make.
4. Models of learning in repeated choice tasks
[image:8.486.140.339.93.300.2]As reinforcement learning models have been most successful in describing people’s choices in instrumental learning situations (Busemeyer & Stout, 2002; Bush & Mosteller, 1955; Erev & Barron, 2005; Estes, 1950; Gans et al., 2007; Yechiam & Busemeyer, 2005), we concentrate our examination on variants of these models. The learning models we propose are similar to the models suggested by Erev and Roth for learning in experimental
games (Erev, 1998; Erev & Roth, 1998) and by Busemeyer and colleagues for learning in the IGT (Busemeyer & Stout, 2002; Yechiam & Busemeyer, 2005).
In the reinforcement learning task the decision maker repeatedly chooses an optionifrom
a set S¼ f1;2; :::;ng with noptions. Before making a decision, the decision maker might
receive advice to choose an option or options A¼ f1; :::;mg, where A is a subset of
S. Generally, advice can consist of one or several options. After choosing optioniin trialt,
the decision maker receives a payoffpt(i).
4.1. Individual learning
According to the individual reinforcement learning (RL) model proposed here, the deci-sion maker enters the situation with initial propensities to choose the different options. After choosing an option, the resulting payoff is used to update the option’s choice propensity. Independent of choice, the propensities decay with time. Choice probabilities are an increas-ing function of the options’ propensities. Formally, the initial propensity of an option is
q1(i) = 0. After choosing an optioni, the propensitiesq(i) of the options are updated by
qtþ1ðiÞ ¼ ð1/Þ qtðiÞ þrtðiÞ; ð1Þ
where/is a free decay parameter determining the weight of past experiences in the
updat-ing process, withrt(i) = pt(i) for the chosen option andrt(i) = 0 for options not chosen.
[image:9.486.52.446.88.275.2](a) (b)
The probability of choosing an option is defined by
ptðiÞ ¼ekqtðiÞ=
Xn
j¼1
ekqtðjÞ: ð2Þ
To capture the variability in participants’ sensitivity to differences in propensities, the
choice rule is augmented by a sensitivity parameterk(e.g., Yechiam & Busemeyer, 2005).
We further assume that participants who received advice will choose the recommended option in their first trial (28 out of 30 participants in Experiment 1 behaved accordingly). This makes RL a nested version of the more complex social learning models described next
and also makes the RL model a strong competitor of the social learning models.2
4.2. Social learning
The following social learning models combine information received as advice with an individual reinforcement learning process and are, therefore, called advice-reinforcement combination (ARC) models. To specify the ARC models formally, we modify the individual RL model described above by adding mechanisms to it. Because we assume that receivers will attempt to evaluate the recommended option before exploring alternative options, all tested models choose the recommended option in the first trial. Formally, the probability of
choosing an option in the first trial isp(i|i2A) = 1⁄mandp(i|i2A= ) = 0.
4.2.1. ARC-Initial
One way to introduce social information into the individual learning process is to assume that decision makers initially perceive recommended options as more positive than non-recommended options. This assumption is reasonable because advisors usually have more knowledge than receivers (Jungermann & Fischer, 2005). To model the initial preference for the recommended option, we allowed the initial propensity of the recommended option to be higher than for options that were not recommended. Similarly, Camerer, Ho, and Chong (2002) and Hanaki, Sethi, Erev, and Peterhansl (2005) modeled a decision maker’s own past experience by defining initial propensities as a function of the options’ past
payoffs. Formally, the initial propensities for ARC-Initial are defined as q1(i|i2A) = |l|Æi
andq1(i|i2A= ) = 0, whereiis a free parameter determining the extra initial propensity of the
recommended option, andl is the expected payoff from always choosing the best option,
which allows the interpretation ofiindependent of the specific payoff distribution.
4.2.2. ARC-Outcome-bonus
advice to be cooperative behavior, which can also be intrinsically rewarding (Decety, Jackson, Sommerville, Chaminade, & Meltzoff, 2004).
A generally more positive evaluation of outcomes from recommended options can be implemented by adding a constant bonus to every payoff from the recommended option.
Formally, reinforcements for recommended options arert(i|i2A) = pt(i) + |l|Æq, whereqis a
free parameter specifying the additional reinforcement for choosing a recommended option.
4.2.3. ARC-Decay
It can be assumed that recommended options have, due to their prominence, stronger mem-ory traces and are therefore easier to retrieve (Lockhart, 2001). Hence, it should be easier to retrieve information about the past performance of a recommended option. We implement
this assumption by introducing an additional decay parameter /advicefor the recommended
option, which is assumed to be lower than the decay parameter /for all other options. The
important implication of this model is that the accumulation of (negative or positive) propen-sities of the recommended option will be faster, and their reduction as a function of time slower. Formally, the different decay process is implemented by modifying Equation 1 to
qtþ1ðiÞ ¼
i2=A! ð1/Þ qtðiÞ þrtðiÞ
i2A! ð1/adviceÞ qtðiÞ þrtðiÞ :
ð3Þ
4.2.4. ARC-Certainty
The social learning models presented thus far assume that social information directly influences the learning mechanism. Alternatively, as proposed by Festinger (1954), people might generally rely on individual learning and resort to advice only when uncertain about how to evaluate the available options (see also Henrich & Boyd, 1998; Kameda & Nakani-shi, 2002, 2003). We implement reliance on social information in situations of uncertainty by assuming that decision makers choose according to propensities when the variance of propensities is high and choose the recommended option when the variance of propensities is low. To make the social learning parameter independent of payoff magnitudes, reliance on advice is modeled as contingent on the variance of the choice probabilities. Specifically, the choice probabilities are modified, after they are determined by Equation 2, according to the following function:
pðiÞ ¼
rðPÞ<s^i2A!1=m
rðPÞ<s^i2=A!0
rðPÞ s!p
; 8
<
: ð4Þ
wherer(P) is the standard deviation of the choice probabilities in Equation 2 andsis a free
parameter that determines the threshold below which the recommended option is chosen.3
4.2.5. Bayesian advice integration
learning approach they give more weight to recent experiences. It is possible that in the current experiment, which explicitly demands the integration of the prior informa-tion of advice with new evidence, a Bayesian approach could provide a good account of people’s behavior. To investigate this possibility, we also test a Bayesian model that was explicitly suggested for the IGT by Yechiam and Busemeyer (2005). This model uses the following Bayesian updating rule:
qtþ1ðiÞ ¼
/BþNt1ðiÞ
/BþNtðiÞ
qtðiÞ þ 1
/BþNtðiÞ
rtðiÞ; ð5Þ
where Nt(i) is the total number of times option iwas chosen up to round t, and/B is the
weight given to initial expectations. The influence of advice on learning is incorporated in the initial evaluation of the choice options, which is, as in ARC-Initial, assumed to be higher
for the recommended deck,q1(i|i2A) = |l|Æiandq1(i|i2= A) = 0. The Bayesian model uses
the same choice rule (Equation 2) as all other models.
[image:12.486.44.446.474.620.2]4.3. Comparison of social learning mechanisms
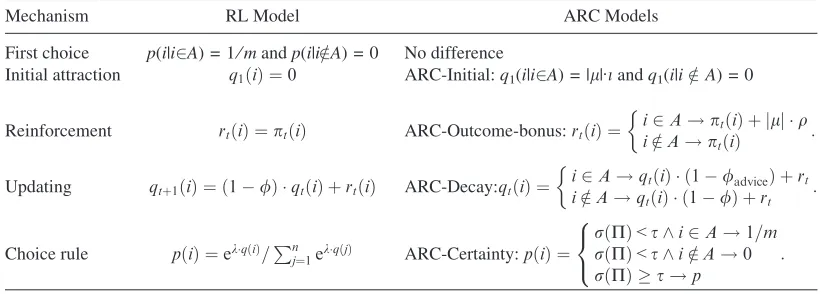
Table 1 summarizes the functions used to describe the ARC models and the RL model. To highlight the differences between the models we examine qualitative and quantitative aspects of the models’ predictions about learning:
[image:12.486.34.453.475.622.2]ARC-Initial assumes that advice mainly affects the initial learning process due to the changed initial propensities of the recommended options. The decay of propensities implies that the influence of advice can rapidly be negligible (depending on the rate of decay). As a result, receivers will also learn over time to deviate from a recommended
Table 1
Differences of the learning and choice mechanisms for the individual reinforcement learning (RL) model and the advice-reinforcement combination (ARC) models: ARC-Initial, ARC-Outcome-bonus, ARC-Decay, and ARC-Certainty
Mechanism RL Model ARC Models
First choice p(i|i2A) = 1⁄mandp(i|i=2A) = 0 No difference
Initial attraction q1ðiÞ ¼0 ARC-Initial:q1(i|i2A) = |l|Æiandq1(i|i2=A) = 0
Reinforcement rtðiÞ ¼ptðiÞ ARC-Outcome-bonus:rtðiÞ ¼ i2A!ptðiÞ þ jlj q
i2=A!ptðiÞ :
Updating qtþ1ðiÞ ¼ ð1/Þ qtðiÞ þrtðiÞ ARC-Decay:qtðiÞ ¼
i2A!qtðiÞ ð1/adviceÞ þrt
i2=A!qtðiÞ ð1/Þ þrt :
Choice rule pðiÞ ¼ekqðiÞ=Pn
j¼1ekqðjÞ ARC-Certainty:pðiÞ ¼
rðPÞ<s^i2A!1=m rðPÞ<s^i2=A!0
rðPÞ s!p
: 8
< :
option when a better alternative is available. The impact of advice depends mainly on the magnitude of the initial propensity for the recommended option as well as the decay parameter. The declining influence of advice also implies that ARC-Initial should have difficulty describing the adherence–exploration–adherence pattern. ARC-Initial influences the learning process in favor of the recommended option in both the gain and the loss domains.
According to the outcome-bonus model, the influence of social information accumu-lates during learning so that its impact is relatively small at first but increases thereaf-ter. Therefore the outcome-bonus model can predict the adherence–exploration– adherence pattern. The model also predicts that the choice of the recommended option increases in the gain and loss domain. With regard to bad advice the outcome-bonus model predicts constant influence on the learning process because the additional rein-forcement for the wrongly recommended option makes it continue to appear better than it actually is. This also implies that when a receiver compares two good options with an identical expected value, then the recommended option will subjectively be perceived more positively, that is, the receiver will not become indifferent to the equally good options.
According to the decay model, advice has a constant influence on the learning process and can explain why receivers come to prefer the recommended option again after an exploratory phase and why in the gain domain receivers adhere to the recommended option in the presence of better alternatives. In the loss domain, the decay model predicts that receivers will tend to avoid recommended options because the slower decay for propensities of this option will maintain negative propensities longer, thus strengthening the advantage of alternative options.
Social learning according to ARC-Certainty depends on the choice options’ similarity, but not on the amount of individual experience. Generally, the model predicts strong social influence when the choice options’ expected outcomes do not differ substantially. ARC-Certainty can predict a preference for the recommended option over a better alternative in cases where the variance across options’ expected outcomes is low, or when payoff differ-ences are not perceived due to high within-option payoff variances.
In the long run, the Bayesian model of advice integration makes similar predictions as ARC-Initial. The important differences are that due to the decay process, ARC-Initial shows higher sensitivity to recent outcomes and the exponential decay in ARC-Initial means that the influence of advice diminishes more quickly than in the Bayesian model.
5. Evaluating models of social learning
5.1. Parameter estimation
The first step needed to evaluate the learning models was to estimate their parameters. We estimated the models’ parameters for each participant separately. We think it is important to model behavior at the individual level, because false conclusions about the dis-tribution of model parameters can be drawn when considering only aggregate data (Estes & Maddox, 2005). A second decision concerned the question of whether the predictions of a model for a person should rely on the past behavior of that person. When using the one-step-ahead approach, the propensities of a learning model for a new trial are updated based on the real choices and payoffs a participant received in the preceding trials. In contrast, when using the simulation approach, the propensities are updated based on the payoffs of the predicted choices. The one-step-ahead approach tends to fit the learning process better because incorrect predictions do not enter the updating process and the model can therefore
describe a broader range of behaviors.4For this reason, we chose the more demanding
simu-lation approach to estimate the models’ parameters, where real choices are only used to determine the model fit but not to determine choices, thus providing a more illuminating test of the model.
For each trial, all models determine the probability with which an individual will choose any option based on past choices and parameter values. We relied on maximum likelihood estimation to find the best parameter values; that is, we searched for the parameter values that maximized the sum of the log likelihood of the observed choices
of the four decks. The sum of the log likelihood is defined as LL¼PTt¼1lnptðkÞ, with
T as the number of trials and pt(k) as the probability with which the model predicts the
actual choice k of the participant in trial t. As the logarithm of zero is minus infinity,
we fixed the minimum choice probabilities in the fitting process to .001. To determine a choice for each trial, one of the options was randomly selected according to the model’s predicted choice probabilities. Due to this random element the model’s predictions for a particular set of parameter values were simulated 50 times, and the average learning process of all 50 simulations was determined. The likelihood of the data was then deter-mined based on the average choice probabilities over the 50 simulations of the complete learning process.
The model parameters were constrained to / 2 [0,1] (for Bayesian updating /B 2
[0,100]) and d 2 [0,1] for the decay parameters,k 2[)5,5] for the sensitivity parameter,
q 2 [0,10] for the additional reinforcement in ARC-Outcome-bonus, i 2 [0,100] for the
higher initial attraction in ARC-Initial, and s 2 [0,.5] for the threshold in ARC-Certainty,
5.2. Model comparison
To evaluate model performance, each model was first compared to a statistical baseline model with three parameters that assumed decision makers always choose according to con-stant choice probabilities, which were determined by the proportion of how often specific decks were chosen by the participants over the 100 trials (e.g., when a participant had cho-sen deck A 50 times the baseline model predicted its choice with a constant probability of .50). Because the baseline model was fitted to the data, it is a strong competitor to the learn-ing models. A learnlearn-ing model will only do better than the baseline model if it accurately describes how people change their behavior over time. To account for differences in model complexity we used the Bayesian information criterion (BIC, see, e.g., Zucchini, 2000) as a
model selection criterion. The BIC is defined as )2 · LL(model) + number of
para-meters ·log(N), with N as the number of predicted choices, and leads to positive values
with smaller values indicating a better fit. We compared each model with the statistical baseline model by determining the baseline model’s BIC value and subtracted the BIC value of the learning model. This BIC difference of the baseline’s BIC minus the learning model’s BIC can be expressed as
DBIC¼2 ½LLðmodelÞ LLðBaselineÞ dlogðNÞ ð6Þ
where d is the difference of a learning model’s number of parameters minus the statistical
baseline model’s number of parameters and with the Log Likelihood computed over all choices. If the learning model predicts the behavior better than the baseline model, then
positive values forDBIC result. The larger the positive values forDBIC the better the
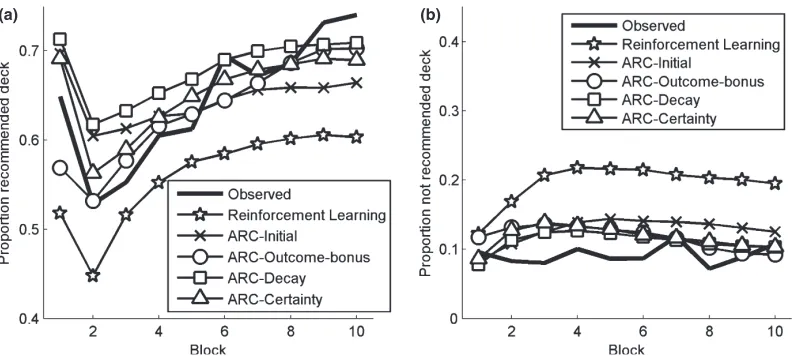
learn-ing model predicts the observed learnlearn-ing process. Fig. 4 shows participants’ choices of the four decks and the predicted choices of the five decay-learning models.
As the first step in model comparison we tested whether the learning models were better than the statistical baseline model. We first examined the merit of the Bayesian advice
inte-gration model. The average negative values of DBIC = )8.29 (Mdn =)5.49,SD = 18.03)
of the Bayesian advice integration model shows that the model does worse in predicting choices than the statistical baseline model. Moreover, it does worse than any of the decay
models. The estimated average parameter values were/= 51.55 (Mdn= 55.64,SD = 5.52)
for the learning rate; c = 5.52 (Mdn= 6.31, SD= 3.41) for the sensitivity; and s = 26.27
(Mdn = 4.32,SD = 34.25) for the higher initial evaluation of the recommended option. This
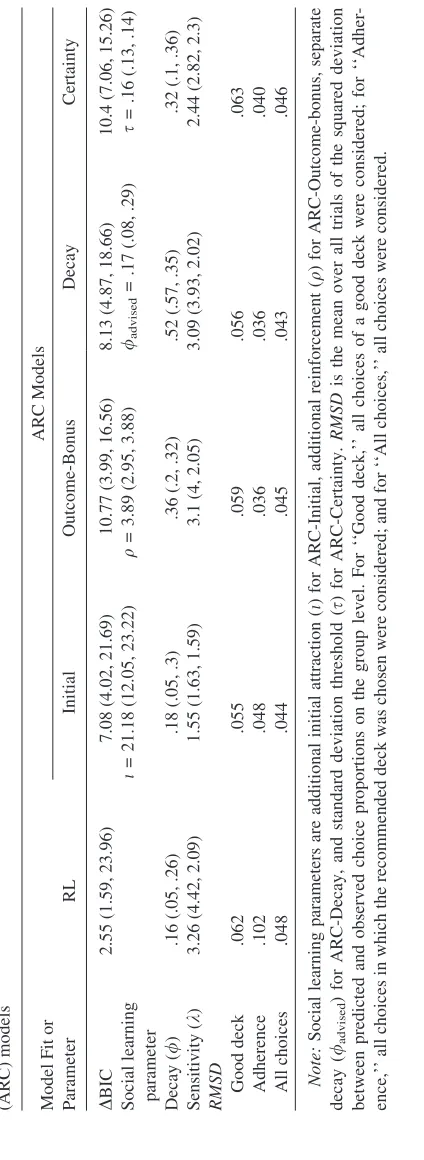
result confirms previous findings that Bayesian learning models do worse in predicting experience-based decision processes in comparison to reinforcement learning models (e.g., Busemeyer & Stout, 2002; Gans et al., 2007; McElreath et al., 2005; Yechiam & Busemey-er, 2005). Due to the poor performance of the Bayesian model we restrict the remainder of the model analysis to the learning models that assume decay processes. Table 2 shows that
the decay models have, on average, positive DBICs, indicating that they performed better
than the statistical baseline model even when taking their complexity into account. We next examined whether the social learning models performed better than the individual RL
model, which had a mean DBIC of 2.55. The mean DBICs for the social learning models
10.4 for ARC-Certainty (see Table 2 for details). The t-tests (Table 3) illustrate that the social learning models describe the learning process better than the individual RL model. Together with the previous finding that the recommended deck was chosen more frequently
than the corresponding deck, this result supports the assumption that a social learning pro-cess describes decision makers’ choices better than purely individual learning.
To examine whether one social learning model outperformed the other ARC models, we
conductedt-tests comparing the models’DBICs (see Table 3). A comparison of the social
learning models shows that the outcome-bonus model has the best fit in describing the observed learning process in comparison to all other models. However, the fit differences are small: ARC-Outcome-bonus is not significantly better than ARC-Certainty, and the
effect sizes of the comparisons with ARC-Initial and ARC-Decay are small (d = .19 and
d = .15, respectively). In sum, the social learning models explain participants’ choices better
than a statistical baseline model and, importantly, better than the individual RL model. Among the social learning models, the outcome-bonus model predicted the observed learn-ing process best. However, the small effect size of the differences in fit between Outcome-bonus and the competing models highlights that Decay and ARC-Certainty also did quite well. This is also reflected in the root mean square deviation
(RMSD) as an alternative goodness-of-fit measurement (see bottom of Table 2).
Considering the social learning parameters, the medianifor ARC-Initial was 12.05—that
is, according to this model the initial attraction for the recommended decks was
approxi-mately 12 times the average payoff from a good deck (.125 cents); the medianqfor
ARC-Outcome-bonus was 2.95—that is, every reinforcement from a recommended deck received a ‘‘bonus’’ that was equivalent to three times the average payoff from a good deck; and the
median/advisedfor ARC-Decay was .08, clearly lower than the decay rate of .57 for options
that were not recommended. In ARC-Certainty the median of the social learning parameter
swas .13. That is, participants chose the recommended option, on average, when the
stan-dard deviation of the choice probabilities was belows= .13.
The social learning models differ from the individual learning model by assuming addi-tional social learning mechanisms. However, we did not only estimate the parameter repre-senting the social mechanism but estimated all parameters for the social learning model to give the models their full power to describe the observed learning processes. A potential drawback of this method is that the social learning models potentially were able to predict
the learning process better due to acombinationof social and standard learning mechanisms.
Therefore, we examined whether the estimated parameters of the individual learning model that are also part of the social learning model differ for the two type of models. The average parameter values for the individual learning model fitted to the independent decision makers
were c= 2.69 (Mdn= 2.32,SD = 2.12) for sensitivity and/ = .29 (Mdn= .14, SD = .33)
for the decay rate. Table 4 shows the results of comparing the standard learning parameters for the independent decision makers with the standard learning parameters for receivers. It becomes clear that the parameters estimated do not differ substantially. The exceptions are the sensitivity parameter for ARC-Initial and the learning rate for ARC-Decay.
Apart from comparing the model fits, one can query whether the models can predict char-acteristic patterns of choices over time. Figs. 2 and 3 show that receivers showed an adher-ence–exploration–adherence choice pattern. ARC model predictions were calculated by first simulating each participant 100 times with the best parameters for this participant and then
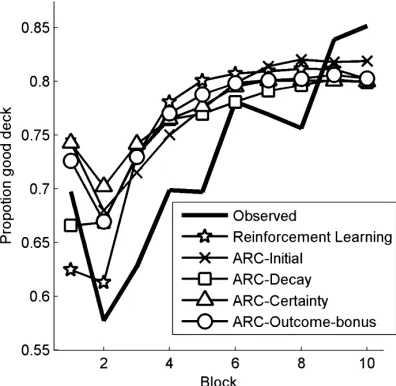
averaging the resulting choice probabilities over all 30 participants.5 Fig. 5 compares the
probabilities of simulated and real participants choosing one of the two good decks in the IGT. To evaluate the correspondence of simulated and observed choices, we calculated
theRMSD(see Table 2) between predicted and observed average probabilities on the group
[image:19.486.43.451.127.210.2]level. The RMSDs for ‘‘good decks’’ indicate that all social learning models predict the
[image:19.486.148.346.277.470.2]Fig. 5. Receivers’ observed and predicted choice proportions for choosing one of the good decks in Experiment 1 (in blocks of 10 trials). The figure shows that the outcome-bonus model and ARC-certainty are best able to capture the nonmonotonic trend of choice probabilities.
Table 4
Mann–WhitneyU-tests for comparing the estimated parameter values for the independent decision makers with parameters estimated for the advice receivers
Parameter RL
ARC Models
Initial Reinforcement Decay Certainty Decay U= 347,
p= .128
U= 343, p= .114
U= 376, p= .274
U= 274, p= .009
U= 429, p= .756 Sensitivity U= 346.5,
p= .126
U= 332.5, p= .082
U= 342.5, p= .111
U= 367.5, p= .222
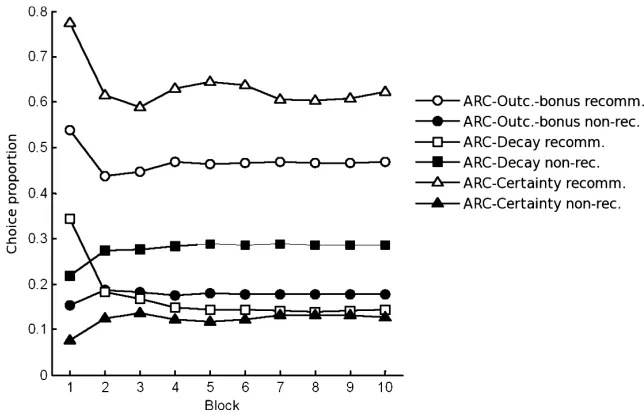
proportion of choices of good decks similarly well (see also Fig. 5). However, this result changes when differentiating the recommended from the nonrecommended option(s). Fig. 6 shows the probabilities of simulated and real participants choosing a good or bad deck, given whether it was recommended or not. For instance, when a participant was advised to choose the good deck C, we calculated the probability that this deck would be chosen and the probability that the corresponding equally good deck D would be chosen. Fig. 6 and the
RMSDs in Table 2 show that the ARC models implementing social learning—especially
ARC-Outcome-bonus, ARC-Decay, and ARC-Certainty—can better account for the adher-ence–exploration–adherence pattern because they are better able to describe the rebound of choices of recommended options after the exploration phase.
5.3. Discussion of Experiment 1
Experiment 1 illustrated that people use advice to improve their decisions. However, only a few receivers (i.e., five) followed the advice for all 100 choices. The majority of receivers chose the recommended option first but then explored the other options, frequently returning to the recommended option later in the experiment. Still, receivers performed better than independent decision makers, who made decisions without receiving or giving advice, and better than participants who had to give advice (advisors). Compared to these groups, receivers were approximately 10% points more likely to choose a good deck. However, receivers (73% chose a good deck) performed worse than participants with their own experience in the same task (78% chose a good deck). In sum, receivers had an advantage over inexperienced decision makers but did worse than experienced individuals (i.e., advisors in their last 100 trials). Surprisingly, advisors did not start with the same deck they recommended to others when they made their decisions in their second 100
[image:20.486.42.438.90.268.2](a) (b)
trials of the IGT. It could be that due to the break between the two parts of the experi-ments advisors expected the environment to change, even though they were told by the experimenters that they would be choosing from the same card decks again. Alternatively, the participants might have learned that the outcomes of the first several cards of the two bad decks were not that bad.
The model comparisons showed that the Bayesian advice integration model could not describe choices well, perhaps because the Bayesian model cannot account for the strong influence of recent outcomes, which is reflected in the high decay parameters estimated for
the decay models (see Table 2). Examining DBICs, we found that the other social learning
models performed better than the pure individual learning model. Of the social learning models, we found that ARC-Initial was, on average, least able to describe participants’ choices. This is reflected in the worst fit and more importantly, in the weaker ability of ARC-Initial to account for the characteristic adherence–exploration–adherence choice pat-tern of many participants. It is less clear which of the three remaining social learning models did best in predicting the learning process. Even though ARC-Outcome-bonus had a better fit than Decay and Certainty, the difference was small compared to the ARC-Initial model. Therefore, we designed Experiment 2 to provide a more specific test of the best models that emerged in Experiment 1. A peculiarity of Experiment 1 was that partici-pants rarely received bad advice; therefore, in Experiment 2 we additionally examined how bad advice influences learning, and whether the social learning models can describe learning after bad advice.
6. Experiment 2
Experiment 2 focused on a comparison of Outcome-bonus, Decay, and ARC-Certainty by testing their predictions with a strong generalization test (Busemeyer & Wang, 2000). For this test we used the estimated parameter values from Experiment 1 to determine the models’ predictions for the new learning situation in Experiment 2.
For a test to be strong, it is desirable to find a situation in which the three models make different qualitative predictions. Such a situation occurs for a task in which all decks have negative expected payoffs. Specifically, the outcome-bonus model predicts that participants will still prefer the recommended deck. In contrast, ARC-Decay predicts that individuals should avoid the recommended option because of the lower decay rate for a recommended deck. The decay model invokes slower forgetting of negative payoffs, which means that pro-pensities remain negative for a longer time after losses. Compared to the recommended option, the other options will appear more attractive because the higher decay rate implies a short memory for the negative payoffs.
ARC-Outcome-bonus and ARC-Certainty both predict that receivers will prefer the rec-ommended deck over the corresponding decks. However, only ARC-Certainty explicitly predicts stronger adherence to advice when receivers are more uncertain about which options are better. Uncertainty can be expressed by the effect size of the payoff difference
calculated as the difference in payoffs from good and bad decks divided by the standard deviation of the pooled payoffs from all options.
In sum, to create a situation in which the three social learning models make qualitatively different predictions in Experiment 2, a task was required in which all four options would pre-dominantly lead to negative payoffs, allowing a distinction between the decay model and the outcome-bonus model. Additionally, the payoff difference between good and bad decks should have a small effect size, allowing a distinction between ARC-Certainty and ARC-Outcome-bonus. In line with these demands we devised a payoff schedule with negative expected
payoffs and an effect size ofd = .15 for the payoff difference between good and bad decks.
To determine the models’ quantitative predictions before running the experiment, we applied a nonparametric bootstrapping procedure. Specifically, the choices of a virtual participant in Experiment 2 were simulated by using the parameters from one randomly
selected real participant from Experiment 1.6 With these parameter values learning and
[image:22.486.77.399.366.574.2]choices over the 100 trials was determined 100 times, and the simulated participant’s expected choice probabilities for each trial were determined as the mean over the 100 simu-lations. To obtain average choice probabilities for one ‘‘virtual experiment,’’ the parameters of 30 randomly selected participants (with replacement) from Experiment 1 were matched with random advice, so that on average 50% of the advice was good. The models’ predic-tions in Experiment 2 were determined by averaging over 5,000 virtual experiments. Fig. 7 displays the three models’ predictions for adherence to advice in Experiment 2.
6.1. Design
Experiment 2 used a learning task similar to that used in Experiment 1. The key differ-ence was the payoff schedule: average payoffs in Experiment 2 were –10 eurocents for the bad decks and –7 eurocents for the good decks, with a standard deviation of 20 eurocents for all decks. Payoffs were randomly drawn from a discrete approximation of a normal dis-tribution, and mean and standard deviation of payoffs were maintained in blocks of 15 trials; we call this the standard payoff schedule. Participants started with an initial endowment of 12.5 euros and made 105 choices.
One result from Experiment 1 was that participants rarely received bad advice. Pilot tests for Experiment 2 revealed that it was difficult to find a payoff schedule under which approxi-mately half of the participants would learn which were the better decks and, hence, give good advice. Therefore, we made the task for 20 of the 30 advisors in Experiment 2 more difficult by manipulating their payoff schedule (henceforth, nonstandard advisors) so that approxi-mately half of the participants would receive good advice and the other half bad advice. The manipulation consisted of subtracting 5 eurocents from every payoff from a good deck in the first 30 trials, and adding 5 eurocents to the same deck in 30 randomly selected trials from the
last 75 trials.7As in Experiment 1, the task was performed by advisors, receivers, and
inde-pendents, with the latter two always choosing from the standard payoff schedule.
6.2. Participants and procedure
Eighty participants, mostly students from the Free University of Berlin (55% women, mean age 25 years), were randomly assigned to the three conditions. Thirty participants were advisors, 30 were receivers, and 20 were independents. As in Experiment 1 partici-pants received information only about the stochastic nature of the payoff distribution, and no information about the domain (gain or loss) or variability of the payoffs. With two excep-tions, the experimental procedure was identical to Experiment 1. First, the similarity of decks for advisors and receivers was expressed as decks having the same average payoff, instead of describing them as being identical, because in the case of the advisors, the good decks started with lower expected outcomes and thereafter improved. Second, participants’ variable payoff was calculated without subtracting the initial endowment because the expected payoff for all decks was negative.
6.3. Results
6.3.1. Choices and performance
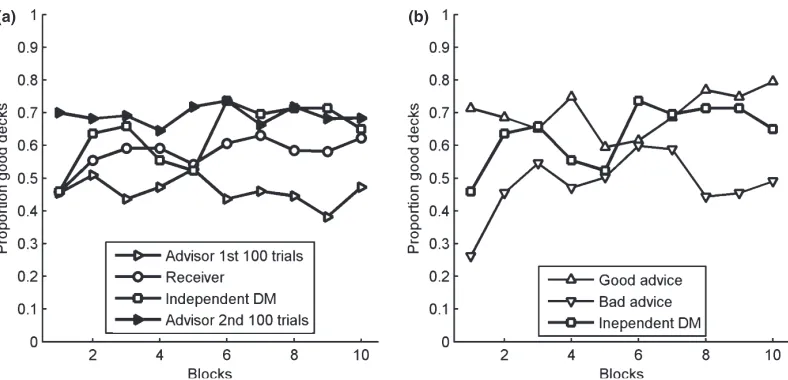
Participants earned, on average, 3.83 euros (SD = 1.9). Fig. 8 shows the proportion of
participants who chose one of the two good decks and shows that the task in Experiment 2 was more difficult for most participants because the average proportion of participants choosing a good deck was, compared to Experiment 1, lower throughout the task. The 10
standard advisors chose a good deck, on average, in 60% (SD= 17%) of their first 100 trials
good deck, on average, in 39% (SD = 12%) of their first 100 trials and in 42% (SD= 40%) of their second 100 trials. This poorer performance of nonstandard advisors was expected because their task was more difficult. Of the receivers, 13 received the good advice to choose from the good decks and the remaining 17 received bad advice. The 13 receivers of
good advice chose a good deck, on average, in 69% (SD = 15%) of their trials, the 17
receivers of bad advice chose a good deck 48% (SD= 20%) of the time, and the
independents chose a good deck in 63% (SD = 12%) of their trials. Comparing advisors,
receivers, and independents, we found that receivers of good advice performed better than
those who received bad advice,t(28) = 3.08,p = .005,d= 1.1, but not better than
indepen-dents, t(31) = 1.25, p = .22, d = .45, or advisors in their second 100 trials, t(21) = .03,
p = .97, d = .01. Receivers of bad advice performed worse than independent decision
makers,t(35) = 2.73,p = .01,d = .9.
Over all trials, independent participants chose one of the good decks, on average, in 67%
(SD = 13%) of the trials, which is significantly higher than 50%, t(19) = 4.71, p < .001,
d = 1.05, and suggests that they learned which decks produced lower losses. They also
chose one of the good decks in 70% (SD= 9%) of the last 50 trials, which suggests the same
conclusion. In sum, participants’ choices show that the manipulation successfully made the task more difficult for nonstandard advisors. In the more difficult task in Experiment 2, the receivers benefited less from the advice, due to frequent bad advice. Independents still learned to choose the good decks.
6.3.2. Giving and following advice
Three of 10 standard advisors and 14 of 20 nonstandard advisors (with a more difficult task) recommended choosing a bad deck. Most advisors recommended the deck they had
[image:24.486.43.437.89.279.2](a) (b)
chosen most frequently (on average in 35%, SD= 14%, of the trials), indicating that they recommended the deck they preferred themselves. Fig. 9 displays the proportion of receivers who chose the recommended or the corresponding deck (see also Table 5). To test the influ-ence of the quality of advice, we performed a repeated measures analysis of variance, with the quality of advice (good vs. bad) as a between-subjects factor, advice (recommended deck vs. corresponding deck) as a within-subject factor, and the choice frequency of recom-mended and corresponding decks as a dependent variable. Participants who received good
advice chose the recommended deck in on average 55% of all trials (SD= .19) and the
cor-responding deck in only 15% of all trials (SD= .13). When receiving bad advice the
corre-sponding choice proportions were 37% (SD = .19) for choosing the recommended option
and 15% (SD = .08) for choosing the corresponding deck.
The statistically significant main effect for advice, F(1,28) = 47.51,p < .001, g2= .63,
shows that the recommended deck was chosen more frequently than the corresponding deck.
The statistically significant main effect for quality of advice, F(1,28) = 6.38, p = .017,
g2= .19, shows that receivers adhered more to advice when it was good. The interaction
between quality of advice and advice was not statistically significant, F(1,28) = 3.78,
[image:25.486.141.354.94.312.2]p = .063, g2= .12, and the small effect size suggests that the probability of choosing the corresponding deck was not substantially influenced by the quality of advice. The larger effect size for advice in comparison to the effect of the quality of advice, indicates that par-ticipants’ choices were more influenced by advice than by the payoffs from choosing the decks.
6.3.3. Model comparison
According to the outcome-bonus model, participants who received bad advice should choose a bad deck more often than participants who received no advice. This can also be assumed for the certainty model, because the high variance of payoffs from decks was high, so that participants should rely on advice. In contrast, the decay model predicts that receiv-ing bad advice should decrease the probability that receivers will choose the recommended bad deck. As Fig. 8 depicts, unlike the prediction from the decay model, participants who received bad advice chose the good decks less frequently than independent decision makers. Further, as predicted by the outcome-bonus model and ARC-Certainty, receivers chose a nonrecommended deck less frequently than the recommended deck, contrary to the decay model’s prediction. Finally, the proportions of choices of the recommended decks did not increase substantially from Experiment 1 to Experiment 2, as predicted by the certainty model. Hence, the examination of the qualitative predictions speaks in favor of the out-come-bonus model.
Additionally, to compare the models quantitatively, we examined how well they pre-dicted participants’ choices. The models’ predictions were simulated as described above, except that parameter values from participants in Experiment 1 were randomly matched with real recommendations from Experiment 2. To compare the models, we examined how well the models predicted the choices of the recommended deck and the corresponding deck with the same expected payoff. Fig. 10 shows the observed and simulated choice
propor-tions and illustrates that the outcome-bonus model (RMSD = .048) predicted the preference
for the recommended decks better than ARC-Decay (RMSD = .22) and also better than
ARC-Certainty (RMSD= .133). ARC-Certainty overestimated the influence of social
[image:27.486.48.446.412.595.2](a) (b)
learning in Experiment 2. Table 5 shows that ARC-Outcome-bonus predicted mean choice proportions better than ARC-Decay and ARC-Certainty and also predicted the standard deviations of choice proportions within a group observed in Experiment 2. Thus, the generalization test supports the outcome-bonus model as the best social learning model considered.
To investigate whether good advice is treated differently from bad advice, we performed the same bootstrapping procedure as above, separately for receivers of good and bad advice. Table 5 shows the results of these simulations, which demonstrate that with good advice the outcome-bonus model predicted adherence to advice well, whereas the decay model under-estimated adherence as well as the proportion of choices of good decks, and ARC-Certainty overestimated both. With bad advice ARC-Decay again underestimated adherence to advice and again chose—as predicted—a nonrecommended deck more frequently than the recom-mended deck. ARC-Certainty clearly overestimated adherence to advice and, hence, pre-dicted low proportions of choices of the good decks. To a lesser degree this was also true for the outcome-bonus model, which, nevertheless, still correctly predicted stronger adher-ence to good than to bad advice, even though the predicted differadher-ence of 4% is smaller than the observed difference of 18%. In sum, the comparison of the models’ predictions for good and bad advice also shows that the outcome-bonus model is the best social learning model among the set of tested models.
6.3.4. Discussion of Experiment 2
Experiment 2 allowed us to examine social learning in a situation in which the best social learning models from Experiment 1 made different predictions. We found again that receiv-ers generally used advice. Supporting the results in Experiment 1, we found that advice had a greater impact on receivers’ choices compared to the payoffs they received from their choices. Furthermore, good advice improved performance and bad advice harmed perfor-mance.
Experiment 1 showed that advisors did not choose the decks that they had recommended when they started with their second 100 trials. In contrast, advisors in Experiment 2 did do so. This suggests that participants trusted the instructions, and that advisors in Experiment 1 had learned that one could choose from the bad decks in the early trials without risking high losses.
Experiment 1 showed that different participants are best modeled by different learning models. As the models were not fitted to participants in Experiment 2, it is not possible to classify participants by model. We nevertheless suggest that of the models considered, the outcome-bonus model is not only best on average but also best describes most participants. This argument is consistent with the finding that participants who received bad advice did not chose the bad decks less frequently at the end of the experiment; instead the choice pro-portion of the bad decks stayed constant for the last 70 trials. In contrast to this empirical observation, ARC-Initial and ARC-Decay predict a decreasing choice probability. Interest-ingly, in contrast to Experiment 1, no participant in Experiment 2 followed the advice in all 100 trials. While this could be a coincidence, participants in Experiment 2 experienced losses in most trials, and this might have stimulated a stronger exploration of alternative options. In sum, Experiment 2 clearly supports the outcome-bonus model as the best of the models considered to describe the social learning process because it predicted adherence to advice, conditional on the quality of advice, and also predicted the variance of choice proportions.
7. General discussion
We examined social learning in the context of repeated choices from experience. We aimed to answer three questions: Do people use advice? Does taking advice improve deci-sion performance? How can social learning be best described? To answer these questions, we observed choices in tasks with repeated choice among four options and tested one model of individual and five models of social learning.
First, we found that receivers used advice as evidenced by the fact that they chose the rec-ommended deck more frequently than the corresponding deck with the same average payoff. Moreover, in Experiment 2, receivers even followed the bad advice to choose decks with the lowest expected payoff. The influence of advice was also visible in task performance: as in Experiment 1, receivers of good advice performed better than independent decision mak-ers, who were, in turn, better than participants receiving bad advice. The poor performance of receivers of bad advice in Experiment 2 shows that social influence can distract people from solving a task on the basis of individual learning. However, participants adhered more to good advice than to bad advice, showing that individual learning still played a role. Over-all, this suggests that individual experience was combined with the social information to inform choices.
7.1. Social learning models
initially evaluated more positively, compared to alternative options. ARC-Outcome-bonus assumes that payoffs from recommended options lead to stronger reinforcement. The decay model assumes that propensities of recommended options decay more slowly. ARC-Certainty assumes that people choose the recommended options when the propen-sities of options are similar. Finally, the Bayesian model assumes that the recommended choice option has a higher prior expected reward and uses Bayes’ rule to integrate new information.
Experiment 1 showed that three of the five social learning models—ARC-Outcome-bonus, ARC-Decay, and ARC-Certainty—described choices better than the statistical base-line model and the individual reinforcement learning model. The Bayesian model did worse than the statistical baseline model and all other social learning models, so it is disqualified as an appropriate description of the observed learning process.
In Experiment 2 ARC-Outcome-bonus, ARC-Decay, and ARC-Certainty were further tested against each other using a modified version of the IGT with negative average payoffs and high payoff variance between and within choice options. In this situation, the three best models identified in Experiment 1 made diverging predictions. In accord only with the pre-dictions of ARC-Outcome-bonus and ARC-Certainty, participants consistently chose the recommended option, which in the case of bad advice means that they did not find the best option. Whereas ARC-Certainty generally overestimated adherence to advice, the outcome-bonus model correctly predicted that adherence to advice is higher when advice is good and also predicted the variance of choice proportions in Experiment 2. In sum, the experiments show that decision makers adhere to advice, that good advice helps and bad advice harms learning, and that the outcome-bonus model provides the best description of the social learning process.
When social learning diverges from individual learning, social information ought to influ-ence individual learning in a different way than one’s own experiinflu-ence. The finding that ARC-Initial and the Bayesian model did not adequately model the learning process indicates that accurate models do not assume that advice only influences the decision makers’ initial preference, as assumed by models of individual learning that account for decision makers’ prior experience (Camerer et al., 2002; Hanaki et al., 2005). The conclusion that advice influences learning differently from one’s own experience is also supported by the finding that advisors in their second 100 trials behaved differently from receivers. As Figs. 2 and 8 show, receivers explored alternative options longer than advisors did in their second 100 choices.
to poorer performance than an individual learning process under no social influence. In sum, social information determines choices briefly at the beginning of a task, and more strongly and persistently after the exploration phase.
As the results in Experiment 2 show, participants’ dependence on the quality of advice has the disadvantage of impairing performance when advice is bad. Hence, decision makers should possess mechanisms to attenuate the effect of bad advice; for instance, they should be very selective when choosing advisors. Whereas our study was arranged so that participants could assume that advisors were competent, the experiments of Yaniv and Kleinberger (2000) and Luan et al. (2004) showed that, if possible and necessary, receivers reacted sensitively to the quality of advice. They disregarded advice from advisors who repeatedly gave bad advice, thus hedging the sensitivity of their social learning mechanism to bad advice. Experiments by Celen, Kariv, and Schotter (2005), Kameda and Nakanishi (2003), and Yaniv (2004a) showed that even naı¨ve participants tend to give useful advice, and that social learning generally improves performance.
7.2. Limitations of the learning models
Our models describe the social learning process at the computational level, but some questions remain open due to limitations in our experiments. One unresolved issue is whether all decision makers can be described with the same model or whether people have qualitatively different learning processes. Results in Experiment 1 suggest that different participants are best described with different models, whereas the analysis of Experiment 2 suggests the ARC-Outcome-bonus model predicted the behavior of most receivers well. The good performance of ARC-Outcome-bonus in predicting mean and variance of choice prob-abilities in Experiment 2 suggests that this model is sufficient to predict most individuals’ behavior. To explore whether stable individual heterogeneity in learning processes exists, for which different learning models are required, it will be necessary to examine partici-pants’ behavior when performing the same basic task repeatedly.
Experiments in which participants perform tasks with different payoff distributions could also help remedy a second limitation, namely, that our selection of ARC-Outcome-bonus is based on two specific payoff distributions. These distributions vary important payoff charac-teristics (positive and negative expected values and different levels of payoff variance), but many other distributions exist and for some of them ARC-Outcome-bonus makes counterin-tuitive predictions. For instance, if the payoff for option A is always 20 and for option B in
99% of the cases is 21 and in 1% of the cases)1,000, then an advisor with enough
experi-ence would recommend choosing option A. Here ARC-Outcome-bonus makes the counter-intuitive prediction that people would converge to choose option A after a short exploration phase, whereas ARC-Certainty would predict that choices converge on option B (until the first negative payoff is experienced). These counterintuitive predictions are worth studying in order to generalize the reported findings.
to the general inability of ARC-Outcome-bonus to explain their behavior. Rather, underesti-mation occurred because nearly all participants in Experiment 1 received good advice, and so individual and social learning usually pointed in the same direction, allowing for rela-tively high values for the social learning parameters. The high social learning parameter val-ues might then have suppressed ARC-Outcome-bonus’s individual learning component in the simulations used to predict behavior in Experiment 2.
A final limitation concerns all the learning models tested. As Figs. 5 and 6 illustrate, the models predicted (to different degrees) the general trend of participants’ choices but were less able to account for local fluctuations in choice probabilities that also characterized the learning process. The smoothness of the models’ predicted curves results, in part, from aver-aging across 5,000 simulations. Beyond that, the higher variance in the observed data might indicate that learning includes more than simple reinforcement processes.
7.3. Generalization to other learning situations
The generalizability of these results depends partly on how advice is given in other con-texts and the incentives involved. In the experiments presented here, receivers were advised to choose a particular option and were aware that advisors were paid according to the receiv-ers’ performance. One might question whether advice that is less strict might lead to less adherence to advice. Using a similar task, Biele, Rieskamp, Krugel, and Heekeren (unpub-lished data) found that when participants were advised to ‘‘mostly choose’’ one particular option, adherence to advice was still generally high even though fewer receivers exclusively chose the recommended option. Furthermore, in our experiments the receivers were aware that the advisors benefit from receivers’ decisions. We used the advisors’ performance-dependent payment to signal the advisors’ motivation to receivers, but we cannot exclude the possibility that this manipulation led to a specific evaluation of outcomes consistent with ARC-Outcome-bonus. However, we argue that the outcome-bonus model describes a rea-sonable mechanism to incorporate advice, even when advisors are not rewarded. According to ARC-Outcome-bonus, social information will especially influence behavior in difficult learning situations where the difference in payoffs between available options is smaller than the additional reinforcement through advice following. Additionally this model will, for good advice, also speed up learning when the payoff difference between options is already large. By contrast, the second-best model, ARC-Certainty will increase the probability of choosing the recommended option only when learning is difficult. Assuming additionally that people usually receive good advice or quickly identify bad advisors (Yaniv, 2004a), this suggests that integrating individual and social information according to ARC-Outcome-bonus would be more adaptive than according to ARC-Certainty, because it speeds up learn-ing even when learnlearn-ing is not particularly difficult.