2019 International Conference on Computer Science, Communications and Big Data (CSCBD 2019) ISBN: 978-1-60595-626-8
DP-LRT: An Urban Short-term Traffic Speed Forecasting Method
Based on Data Driven
Yu-long HU
1,2,*and Lun LUO
21School of Earth and Space Sciences, Peking University, Beijing, China 2China Transport Telecommunications & Information Center, Beijing, China
*Corresponding author
Keywords: Short-term traffic forecasting, Urban traffic, Likelihood ratio test.
Abstract. Until recently, most short-term traffic speed forecasting algorithms have been applied on freeway, arterial or corridor. Short-term traffic speed forecasting on urban road network formed a more complex problem than freeway predictions due to constraints such as signalization. This paper proposes a Date Pattern and Likelihood Ratio Test statistics based (DP-LRT) method for urban short-term traffic speed forecasting from large scale taxi GPS data. Experiment showed that the proposed method reduced the mean absolute percent error and improved the prediction success rate compared with K-NN method, which was a representative data-driven method.
Introduction
Urban short-term traffic forecasting is a hot topic in the studies of transportation and plays a vital element in the fields of smart city and urban computing, which aims at predicting the evolution of urban traffic over time horizons ranging from few seconds to few hours.
The approaches used in short-term traffic forecast can be broadly classified into four categories: naive, parametric, non-parametric, and hybrid. Naive approaches refer to models that provide simple estimate of traffic in the future, e.g., historic averages. Parametric approaches refer to models-based techniques which require a set of fixed parameter values as part of the mathematical or statistical equations they utilize, e.g., analytical models, macroscopic or microscopic models [1], time series analysis models [2,3]. Most of these methods are plagued by their assumption of considering parametric models and have been shown to perform poorly under unstable traffic conditions, complex road settings, as well as when faced with extensive datasets with both structured and unstructured data [4,5]. Non-parametric methods are primarily data-driven and use empirical algorithms to provide predictions, e.g., approaches based on data analysis [6,7] and neural network techniques [8,9].
Given the fact that there are a variety of models developed for short-term traffic forecast, it is difficult to determine which method is most suitable for a particular situation. Various researchers have concluded that the performance of data-driven model is better compared to parametric model when faced with complex traffic conditions, because they are more suitable for learning more complex data [4,6].However, in spite of the advantages, existing data-triven methods such as K-NN only concentrates on a single section of a highway and lacks the observation on the whole area of a city [4].
Methodology
Date Pattern Method. In this research, the expected traffic speed refers to the mean historical traffic speed based a certain date pattern. A date pattern represents a series of historical dates. Since the daily traffic information in the city will be slightly different, the historical data of different dates will have different traffic speed expectations, which will exert impact on the forecasting results. To reduce forecasting error and improving forecasting success rate, this research classifies the date pattern into four types: ADs (all days), WHDs (workdays or holidays), SWDs (same day of a week) and PTDs (previous two days). The four abbreviations separately represent selecting data on different historical dates.
Forecasting Based on LRT. Considering the recent works of which used LRT statistics to describe traffic patterns and find the anomalous region[10], we use the likelihood ratio test method to predict a traffic speed range with statistical significance for each grid of urban after calculating the expected traffic speed based on the selected date pattern:
Given a data set X, the model distribution f(X, θ), a null hypothesis H0: Θ0 and an alternate
hypothesis H, LRT is the statistic:
λ =𝑠𝑢𝑝{𝐿(𝜃|𝑋):𝜃∈𝛩0}
𝑠𝑢𝑝{𝐿(𝜃|𝑋):𝜃∈𝛩} (1)
Where L() is the likelihood function. θ is a set of parameters coming from complete parameter space Θ and null parameter space Θ0. This statistic is computed by first computing a maximum
likelihood estimate (MLE) under both parameter spaces Θ0 and Θ, and then computing the ration of
the likelihood obtained via the two MLEs [11]. Under mild regularity conditions, the asymptotic distribution of Λ(X) = -2logλ follows a 2
distribution with k degrees of freedom, where k is the number of free parameters. For a given confidence level and a given degree of freedom k, e.g.,
=5%, k=1, the value of the 2 is 3.84. The probability of Λ(X)<3.84 is 95%:
P(Λ(X) < 3.84) = 95% (2) The traffic speed n obeying Poisson distribution [12]:
P(X = 𝑛) =𝑒−𝑚𝑛!𝑚𝑛 (3) m is the parameter of the distribution. So, the likelihood of any given grid G is:
L(𝑛|𝐺) =𝑒−𝑚𝑛!𝑚𝑛 (4) The MLE of m is expected value under null parameter space Θ0. and it is real value under complete
parameter space Θ. So, the LRT statistic of grid G is:
λ𝐺 =𝐿(𝑛𝐿(𝑛|𝐺)0|𝐺)=𝑒
−(𝑛0)(𝑛0)𝑛/𝑛!
𝑒−(𝑛)(𝑛)𝑛/𝑛! = (
𝑛0
𝑛)
𝑛
𝑒(𝑛−𝑛0) (5) n0 is the expected value given by Date Pattern method. The Λ of grid G is given by:
Λ𝐺 = −2 ln λ𝐺 = 2 𝑛ln (𝑛𝑛
0) + 2(𝑛0− 𝑛) (6) With the following formula:
2 𝑛ln (𝑛𝑛
0) + 2(𝑛0− 𝑛) = 3.84 (7) We can get the confidence interval of n, [nmin, nmax], which representing the probability of the
traffic speed falling within the interval is 95%:
statistically significant range. For example, when k0 is 10, 50, 100, respectively, the confidence
intervals of the k are showed in Table 1:
Table 1. The confidence intervals of each traffic speed expectation.
k0 (km/h) Confidence Intervals (km/h)
10 5-17
50 37-65
100 82-121
Measuring Performance. This paper used MAPE (Mean Absolute Percentage Error), SR (Successful Rate) and HFSR (Historical Forecasting Successful Rate) to Measure the performance of the proposed urban traffic forecast method. MAPE provides the forecast error in terms of percentage difference between the observed and predicted traffic speed. SR represents for a certain timeslot, the proportion of the number of successfully predicted grids to the total number of predicted grids. HFSR represents for a certain grid, the proportion of the number of successfully predicted timeslots to the total number of predicted timeslots. The forecast method which provides the least MAPE and the highest SR, HFSR can be identified as an optimal method.
MAPE =𝑛1∑ |𝐹𝑖−𝑂𝑖
𝑂𝑖 | × 100%.
𝑛
𝑖=1 (9)
SR = 𝑆𝑔
𝑁𝑔× 100%. (10)
HFSR = 𝑆𝑡
𝑁𝑡× 100%. (11) Where Fi is the forecast traffic speed of ith timeslot grids. Oi is the observed traffic speed of ith
timeslot grids. n is the total number of grids. Ng is the total number of grids. Sgis the number of grids
which are forecasted successful. Nt is the total number of timeslots. St is the number of timeslots
which are forecasted successful.
Experiments and Results
Data-driven urban traffic speed forecast method demands a comprehensive analysis of data and exploration of temporal and spatial characteristics of urban traffic. The GPS data in the present research are collected from more than 12000 taxi in Beijing metropolitan area on the days of November 2012, located at 139.703°-40.210° N, 16.082°-116.726° E. The collected data contains more than 972 million GPS records with more than 30 million per day.
Choosing a Suitable Date Pattern. Since the daily traffic speed in the city will be slightly different, selecting the historical data of different dates will get different traffic speed expectations, which will exert impact on the forecasting results. It is of necessity to make comparison among testing results in different date patterns to select one with minimum forecasting error and maximum forecasting successful rate.
Figure 1. Comparison of forecast with using different date patterns.
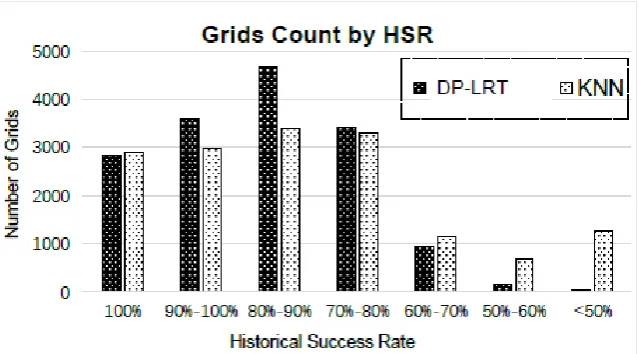
[image:4.595.101.496.335.467.2]Comparing the Results with Enhanced K-NN. To evaluate the performance of the proposed method, the results of DP-LRT proposed in this paper are compared with those from the enhanced K-NN (set key parameter K=5) [4]. Figure 2 shows the forecast error and success rate from the proposed approach and K-NN by time of the day. As shown in the figure, the proposed approach is able to provide traffic speed forecasting with lower prediction errors. Figure 3 shows the number of grids of different HFSR of the two methods and proves that the method proposed in this paper shows more accuracy in forecasting more urban areas.
Figure 2. Comparison of forecast with enhanced K-NN by time of day.
Figure 3. Comparison the number of grids by different historical forecasting success rate with enhanced K-NN.
Summary
[image:4.595.139.459.496.673.2]week) and PTDs (previous two days). A statistically significant range of traffic speed was predicted based on Likelihood ratio test (LRT) in one data pattern. Different from previous short-time traffic forecasting studies, it can not only make predictions on traffic speed in different urban areas but also identify the level of intensity of traffic periodicity in different areas, by which urban design and administration can be facilitated with clear direction. For instance, more sensors could be installed in areas with weak periodicity to intensify monitoring and traffic anomaly could be easily traced in areas with strong periodicity, which bring convenience to further studies on traffic anomaly detection.
Acknowledgement
This research was financially supported by the National Natural Science Foundation of China (No.91646207) and National Key R&D Program of China (No.2017YFC0822003).
References
[1] Fowe A J, Chan Y. A microstate spatial-inference model for network-traffic estimation[J]. Transportation Research Part C Emerging Technologies, 2013, 36(11):245-260.
[2] Guo J, Huang W, Williams B M. Adaptive Kalman filter approach for stochastic short-term traffic flow rate prediction and uncertainty quantification[J]. Transportation Research Part C, 2014, 43:50-64.
[3] Wang X, Fan T, Li W, et al. Speed variation during peak and off-peak hours on urban arterials in Shanghai[J]. Transportation Research Part C: Emerging Technologies, 2016, 67:84-94.
[4] Habtemichael F G, Cetin M. Short-term traffic flow rate forecasting based on identifying similar traffic patterns[J]. Transportation Research Part C, 2016, 66:61-78.
[5] Vlahogianni E I, Karlaftis M G, Golias J C. Short-term traffic forecasting: Where we are and where were going[J]. Transportation Research Part C Emerging Technologies, 2014, 43(1).
[6]Pascale A, Deflorio F, Nicoli M, et al. Motorway speed pattern identification from floating vehicle data for freight applications[J]. Transportation Research Part C: Emerging Technologies, 2015, 51:104-119.
[7]Shi Q, Abdel-Aty M. Big Data applications in real-time traffic operation and safety monitoring and improvement on urban expressways[J]. Transportation Research Part C: Emerging Technologies, 2015:S0968090X15000777.
[8] Li C S, Chen M C. Identifying important variables for predicting travel time of freeway with non-recurrent congestion with neural networks[J]. Neural Computing and Applications, 2013, 23(6):1611-1629.
[9] Wang J, Shi Q. Short-term traffic speed forecasting hybrid model based on Chaos–Wavelet Analysis-Support Vector Machine theory[J]. Tramsportation Research Part C Emerging Technologies, 2013, 27(2):219-232.
[10]Pang L, Chawla S, Liu W, et al. On detection of emerging anomalous traffic patterns using GPS data[J]. Data & Knowledge Engineering, 2013, 87(9):357-373.
[11]Wu M, Song X, Jermaine C, et al. A LRT framework for fast spatial anomaly detection[C]//Acm Sigkdd International Conference on Knowledge Discovery & Data Mining. DBLP, 2009.