R E S E A R C H A R T I C L E
Open Access
An administrative data validation study of the
accuracy of algorithms for identifying rheumatoid
arthritis: the influence of the reference standard
on algorithm performance
Jessica Widdifield
1*, Claire Bombardier
1, Sasha Bernatsky
2, J Michael Paterson
1,3,4, Diane Green
3, Jacqueline Young
3,
Noah Ivers
1,3,5, Debra A Butt
1, R Liisa Jaakkimainen
1,3,6, J Carter Thorne
7and Karen Tu
1,3Abstract
Background:We have previously validated administrative data algorithms to identify patients with rheumatoid arthritis (RA) using rheumatology clinic records as the reference standard. Here we reassessed the accuracy of the algorithms using primary care records as the reference standard.
Methods:We performed a retrospective chart abstraction study using a random sample of 7500 adult patients under the care of 83 family physicians contributing to the Electronic Medical Record Administrative data Linked Database (EMRALD) in Ontario, Canada. Using physician-reported diagnoses as the reference standard, we computed and compared the sensitivity, specificity, and predictive values for over 100 administrative data algorithms for RA case ascertainment.
Results:We identified 69 patients with RA for a lifetime RA prevalence of 0.9%. All algorithms had excellent specificity (>97%). However, sensitivity varied (75-90%) among physician billing algorithms. Despite the low prevalence of RA, most algorithms had adequate positive predictive value (PPV; 51-83%). The algorithm of
“[1 hospitalization RA diagnosis code] or [3 physician RA diagnosis codes with≥1 by a specialist over 2 years]”had a sensitivity of 78% (95% CI 69–88), specificity of 100% (95% CI 100–100), PPV of 78% (95% CI 69–88) and NPV of 100% (95% CI 100–100).
Conclusions:Administrative data algorithms for detecting RA patients achieved a high degree of accuracy amongst the general population. However, results varied slightly from our previous report, which can be attributed to differences in the reference standards with respect to disease prevalence, spectrum of disease, and type of comparator group.
Keywords:Rheumatoid arthritis, Health administrative databases, Validation study, Sensitivity and specificity, Predictive values, Diagnostic test
* Correspondence:[email protected] 1
University of Toronto, Toronto, 200 Elizabeth St 13EN-224, Toronto, ON M5G 2C4, Canada
Full list of author information is available at the end of the article
Background
Validation of health administrative data algorithms for identifying patients with different health states is an im-portant step in accurately using these data for secondary research [1]. Validation studies of administrative data algo-rithms often lack consistent methodology which can also make interpretation difficult [2]. For rheumatologic dis-eases of relatively low prevalence, researchers often sample patients from specialty clinics in order to increase the prevalence of case patients in their validation samples. However, this approach may elevate positive predictive values (PPV) and limit the generalizability of study results as not all patients receive continuous specialty-based care. In order to establish the optimal approach to identifying patients using administrative data, a population-based sample should be used, such that the disease prevalence in the validation cohort can approximate the prevalence of disease in the population [3,2].
Previously, we evaluated the accuracy of administrative data algorithms among a sample of 450 rheumatology clinic patients, in whom the prevalence of rheumatoid arthritis (RA) was 33%. We demonstrated that adminis-trative data algorithms are highly accurate in identifying RA patients under active rheumatology care [4]. While these results are promising, it is not known whether the algorithms we tested perform equally well amongst the general population.
In Canada, primary care physicians act as‘gate-keepers’ for access to specialists. Thus, primary care medical re-cords represent a valuable resource for administrative data validation studies, as these records provide a closer ap-proximation of population-based disease prevalence.
Thus, our primary objective was to reassess the accur-acy of administrative data algorithms for identification of RA patients using diagnoses documented within the medical records of primary care physicians, and to com-pare our results with those of a previous study in which we used the medical records of rheumatologists as the reference standard [4].
Methods
Setting and design
In Ontario, all 13 million residents are covered by a uni-versal, single-payer, public health insurance including hos-pital care and physicians’ services. A retrospective chart abstraction study was performed among a random sample of patients seen in primary care clinics to identify patients with and without RA. These patients were then linked to health administrative data to test and validate different combinations of physician billing, hospitalization and pharmacy data to identify RA patients within administra-tive data. This study was approved by the Sunnybrook Health Sciences Centre Research Ethics Board, and a
waiver of patient consent was obtained as all analyses were performed on de-identified patient records.
Participant selection
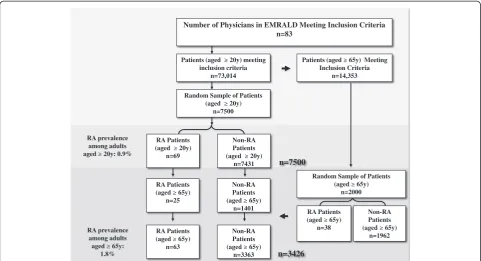
We used the Electronic Medical Record Administrative data Linked Database (EMRALD) [5]. Clinically relevant information contained in the patients’charts includes all physician office visits, information on the patient’s current and past medical history, laboratory test results, prescrip-tions, specialist consultation letters, discharge summaries and diagnostic tests. We studied 83 physicians represent-ing both urban and rural Ontario. A random sample of 7500 patients aged 20 years or older and 2,000 patients aged 65 years or older as of December 31, 2010 were drawn from 73,014 qualifying patients. Patients were in-cluded if they had a valid health insurance number and date of birth, had at least one visit in the previous year, and were rostered to (enrolled in) the physician’s practice. The latter criteria was required to ensure enough clinical information to verify disease status.
Data abstraction
Using a standardized data abstraction tool, 9500 patients had their entire medical record screened by one of five trained abstractors to identify whether any had evidence of inflammatory arthritis. To assess the intra- and inter-rater reliability of chart abstractors, an initial 10% sample of charts was abstracted a second time by the same abstractor and once by a different abstractor. Kappa scores for inter-and intra-rater reliability exceeded 0.85 indicating good agreement for all five chart abstractors. Then, one abstractor (JW) reviewed the records of patients who, based on initial screen, were identified as possibly having inflammatory arth-ritis. The purpose of the second screen was to verify whether these patients had a diagnosis of RA, and whether a rheumatologist, orthopedic surgeon or internist had confirmed it. In addition, the abstractor verified drug history [i.e., prescription for non-steroidal anti-inflammatory drugs (NSAIDS), glucocorticosteroids, disease-modifying anti-rheumatic drugs (DMARDs), or biologics], and whether patients satisfied elements of RA classification criteria [6,7]. Results of serology and acute phase reactants tests were also obtained from both laboratory test fields within the electronic medical records (EMR) and specialist con-sultation notes. All trained chart abstractors were blinded to the administrative data diagnoses codes for all patients.
Reference standard
(e.g., serology, joint involvement, or treatment) but with-out a supporting specialist consultation note. Additionally, patients were flagged as ‘possible RA’cases if the record mentioned RA but lacked supporting evidence, or if the record had a “query RA” diagnosis. These ‘possible RA’ cases were used in a sensitivity analysis surrounding our reference standard definition of RA in which both definite RA and possible RA cases were grouped together.
Health administrative data sources
Once patients were classified as having or not having RA according to our reference standard, administrative data were obtained for these patients for the period April 1, 1991 to March 31st2011 (the years for which administra-tive data were available during the study period). We used the Ontario Health Insurance Plan (OHIP) Database [8] to identify physician billing diagnosis codes. Physicians are reimbursed by submitting claims to OHIP for medical ser-vices provided. One diagnosis code, representing the main
‘reason for the visit’, is provided with each claim. These diagnoses are coded according to a modification of the 8th revision of the International Classification of Diseases (ICD) [9]. Hospital visits were identified using the Canadian Institute for Health Information Discharge Abstract Data-base (CIHI-DAD), which contains detailed information regarding all hospital admissions, and the National Ambu-latory Care Reporting System (NACRS), which records all hospital-based and community-based ambulatory care for day surgery and emergency rooms (ERs) [10]. Hospital data prior to 2002 have diagnoses coded in ICD-9 [9] and can contain up to 16 diagnoses recorded per hospital en-counter. Hospitalizations and ER encounters after 2002 are coded using ICD-10, and each record contains up to 25 diagnoses per encounter. For patients aged 65 years or older, medication exposures for DMARDS, biologics, and glucocorticosteroids, were determined using the pharmacy claims database of the Ontario Drug Benefit (ODB) Pro-gram [11]. Information on physician specialty for the billing claims was obtained by linking the Institute for Clinical Evaluative Sciences Physician Database (IPDB) with the OHIP database [12]. Musculoskeletal specialists were identified as rheumatologists, orthopedic surgeons, and internal medicine specialists. The OHIP Registered Persons Database (RPDB) contains a single unique record for each health care beneficiary that enables the linkage of these datasets in an anonymous fashion using encrypted health insurance numbers [13]. All data reside and all ana-lyses were performed at the Institute for Clinical Evalu-ative Sciences (www.ices.on.ca).
Test methods
Results are reported using the modified Standards for Reporting of Diagnostic Accuracy (STARD) criteria [14,3]. Our methodological approach and study conduct complies
with recent recommendations on the reporting and study design of administrative data validation studies [2].
Algorithm testing
Algorithms were derived using combinations of physician billing diagnosis (ICD 714), primary and secondary hos-pital discharge diagnosis (ICD9 714; ICD10 M05-M06), prescription drug claims (for DMARDs, biologics, and glu-corticosteroids), by varying windows between diagnosis codes or the period in which diagnosis codes appeared, and whether the services were rendered by a musculoskel-etal specialist. Additionally, we tested algorithms with exclusion criteria in which diagnosis codes for ‘other rheumatology conditions’ appeared after a diagnosis of RA, or for which an RA diagnosis code was not provided when a patient was seen by a rheumatologist. The‘other rheumatology diagnoses’ included: osteoarthritis, gout, polymyalgia rheumatica, other seronegative spondyloar-thropathy, ankylosing spondylitis, connective tissue disorder, psoriasis, synovitis/tenosynovitis/bursitis, and vasculitis. All algorithms were tested on the entire sample except those involving prescription drug claims, which were lim-ited to patients aged 65 years and older. The algorithms were applied to all administrative data for the study period (up to March 31, 2011).
Statistical analysis
Descriptive statistics were used to characterize the study population. We computed the sensitivity, specificity, posi-tive predicposi-tive value (PPV) and negaposi-tive predicposi-tive value (NPV) of each algorithm with corresponding 95% confi-dence intervals (CI). Details of the how these measures were computed are illustrated in Table 1 [2]. Algorithms were first ranked according to highest PPV, followed by highest sensitivity and specificity. All analyses were per-formed on de-identified data using SAS version 9.2 (SAS Institute, Cary, North Carolina).
Sample size
and add an additional 2000 patients aged 65 and older for our analyses restricted to seniors.
Results
The 83 physicians included in this study were in practice an average of 18.4 years, and they had used an EMR an average of 5.9 years (standard deviation, SD 3.2). The average patient time on the EMR was 5 years (range 2– 23.5). Analyses were performed on 7500 patients aged 20 years and older and 3426 patients aged 65 years and older. The average age of the 7500 patients in the adult cohort was 49 (SD 17, range: 20–98) years.
Using our reference standard definition, we identified 69 RA patients for a lifetime RA prevalence of 0.9% for patients aged 20 years and older (Figure 1). Amongst the RA cases, almost two thirds were female (64%) and the average age was 61.9 (SD 13.7) years. Amongst the 3426 patients aged 65 years and older, 63 (1.8%) patients had RA. Sixty-five percent were female and their average age was 76.3 (SD 6.8) years.
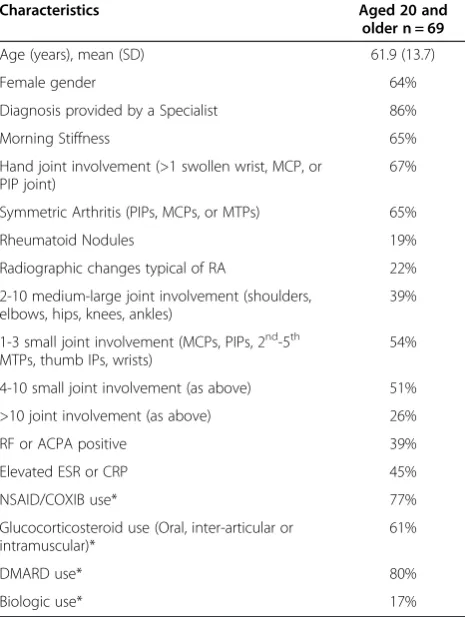
Clinical characteristics of the 69 RA patients are shown in Table 2. Most RA patients (86%) had documentation of an RA diagnosis by a specialist. Most RA patients also had documentation of bilateral joint involvement and small joint synovitis. Seropositivity (for rheumatoid factor and/ or anti-ccp) was documented for 39% of RA patients and elevated acute phase reactants (i.e. erythrocyte sedimenta-tion rate or c-reactive protein) were documented for 45%. DMARDs were the most commonly reported RA drug ex-posures and were present in 80% of patients.
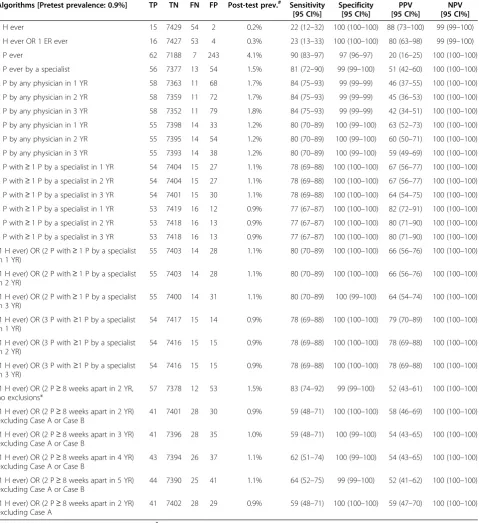
[image:4.595.56.550.101.170.2]Sensitivity, specificity, and predictive values for selected administrative data algorithms are reported in Table 3. Al-gorithms selected for reporting are based on those com-monly in use by researchers. Access to the complete set of over 100 additional algorithms is available through the corresponding author. All algorithms had excellent specifi-city (97-100%). However, the sensitivity of the physician billing algorithms varied (77-90%). Despite the low preva-lence of RA in the primary care records, algorithms for identifying RA patients had at least modest PPV (51-83%), which improved substantially with the requirement for
Table 1 Methods to computing measures of diagnostic accuracy
Reference standard Pre−test prevalence¼ TPþFN TPþFPþFNþTN
RA cases Non-cases
Administrative data Positive True Positive (TP) False Positive (FP) PPV¼
TP TPþFP
Negative False Negative (FN) True Negative (TN) NPV¼ TN FNþTN
Sensitivity¼ TP
TPþFN Specificity ¼ FPTNþTN Post−test Prevalence¼TPþFPTPþþFNFPþTN
Non-RA Patients (aged ≥ 65y)
n=1962 RA Patients
(aged ≥ 65y) n=38
Random Sample of Patients (aged ≥ 65y)
n=2000 Patients (aged ≥ 20y) meeting
inclusion criteria n=73,014
Random Sample of Patients (aged ≥ 20y)
n=7500
Number of Physicians in EMRALD Meeting Inclusion Criteria n=83
RA Patients (aged ≥ 20y)
n=69
Non-RA Patients (aged ≥ 20y)
n=7431
RA Patients (aged ≥ 65y)
n=25
Non-RA Patients (aged ≥ 65y)
n=1401
RA Patients (aged ≥ 65y)
n=63
Non-RA Patients (aged ≥ 65y)
n=3363
Patients (aged ≥ 65y) Meeting Inclusion Criteria
n=14,353
RA prevalence among adults aged ≥ 20y: 0.9%
RA prevalence among adults aged ≥ 65y:
1.8% n=3426
n=7500
[image:4.595.57.539.452.713.2]musculoskeletal specialist billings. Varying the duration of the observation window for diagnosis codes had little im-pact on the accuracy of the algorithms. The addition of time restrictions between diagnosis codes (e.g., diagnosis codes≥8 weeks apart) and exclusion criteria also did not improve algorithm performance.
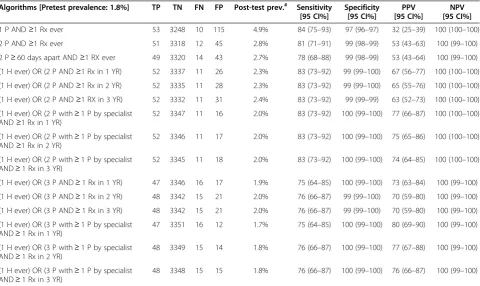
Among seniors (Table 4), the requirement for an RA drug exposure slightly improved the PPV, although the 95% CIs overlapped with those for the algorithms ex-cluding RA drugs.
After ranking algorithms by our a priori definition, the algorithm to meet this criteria was: “[1 hospitalization RA code] OR [3 physician RA diagnosis codes (claims) with≥1 by a specialist in a 2 year period]” which had a sensitivity of 78% (95% CI 69–88), specificity of 100% (95% CI 100–100), PPV of 78% (95% CI 69–88) and NPV of 100% (95% CI 100–100).
When we varied the definition of our reference stand-ard to include all possible RA patients, the prevalence increased from 0.9% to 1.3%. When the algorithms were
retested including these patients, there was a trend to-ward decreasing sensitivity. There was no effect on spe-cificity or NPV, however PPV slightly increased with more RA patients classified in the reference standard.
Discussion
Our findings show that, in the primary care setting, most administrative data algorithms for RA had high specificity. We found that incorporating specialist diagnosis codes in-creased PPV (51-83%), and requiring multiple RA codes increased both specificity and PPV. However increasing the duration of the observation window to identify RA codes or varying the time between RA codes had little im-pact on algorithm performance. In addition, incorporating RA drugs only slightly improved PPV, hospitalization codes alone had poor sensitivity, and use of more complex cases definitions involving exclusion criteria did not im-prove algorithm performance.
Overall, we have comprehensively evaluated the accuracy of administrative data algorithms that were measured rela-tive to the reference standards of two independent valid-ation samples using the diagnoses documented within medical charts of rheumatologists (previously reported) [4] and family physicians (reported here). After testing admin-istrative data algorithms and ranking algorithms according to performance characteristics, the optimal algorithm identified for identifying RA patients in both samples was identical. The algorithm of “[1 hospitalization RA code] OR [3 physician RA diagnosis codes with≥1 RA code by a specialist in a 2 year period]”had a sensitivity of 78%, spe-cificity of 100%, PPV of 78% and NPV of 100% when using our primary care reference standard. When we independ-ently validated this algorithm among a random sample of 450 patients seen in rheumatology clinics [4], it demon-strated a sensitivity of 97%, specificity of 85%, PPV of 76% and NPV of 98%.
While we identified the same algorithm as optimal in both settings, we did not achieve identical results, which can be attributed to differences in the study samples (ref-erence standards) with respect to disease prevalence, spectrum of disease, and type of comparator group. For example, 33% of patients had RA within the rheumatology sample [4] versus 0.9% within the primary care sample. The spectrum of disease (clinical characteristics) in our rheumatology sample included contemporary RA patients under active rheumatology care and treatment, compared to patients with a lifetime RA diagnosis who may only be currently receiving active primary care. The type of com-parator group (non-cases) in our rheumatology study in-volved patients with other rheumatologic diagnoses, in contrast to our primary care patients who are healthy or have other diagnoses.
[image:5.595.57.290.113.422.2]In both samples, algorithm sensitivity was computed only among study subjects with RA, and specificity was
Table 2 Clinical characteristics and drug exposures for RA patients
Characteristics Aged 20 and
older n = 69
Age (years), mean (SD) 61.9 (13.7)
Female gender 64%
Diagnosis provided by a Specialist 86%
Morning Stiffness 65%
Hand joint involvement (>1 swollen wrist, MCP, or PIP joint)
67%
Symmetric Arthritis (PIPs, MCPs, or MTPs) 65%
Rheumatoid Nodules 19%
Radiographic changes typical of RA 22%
2-10 medium-large joint involvement (shoulders, elbows, hips, knees, ankles)
39%
1-3 small joint involvement (MCPs, PIPs, 2nd-5th MTPs, thumb IPs, wrists)
54%
4-10 small joint involvement (as above) 51%
>10 joint involvement (as above) 26%
RF or ACPA positive 39%
Elevated ESR or CRP 45%
NSAID/COXIB use* 77%
Glucocorticosteroid use (Oral, inter-articular or intramuscular)*
61%
DMARD use* 80%
Biologic use* 17%
*Prescribed by any physician (specialist or primary care physician).
Abbreviations:MCPsmetacarpophalangeal joints,PIPsproximal interphalangeal joints,MTPsmetatarsophalangeal joints,IPsinterphalangeal joints,DMARD
disease-modifying anti-rheumatic drug,NSAIDnon-steroidal anti-inflammatory drug,COXIBCOX-2 selective inhibitor,RFRheumatoid Factor,ACPAanti– citrullinated protein antibody,ESRerythrocyte sedimentation rate,CRP
computed among those without RA. Sensitivity and spe-cificity do not depend on the prevalence of the RA in the study population, but they can vary across popula-tions [16]. For example, sensitivity or our administrative
[image:6.595.60.540.102.626.2]data algorithm was excellent (>97%) at identifying con-temporary RA under active rheumatology care [4]. In contrast, sensitivity was moderately good (78%) at iden-tifying RA patients with a lifetime diagnosis of RA (who
Table 3 Test characteristics of multiple algorithms among patients≥20 y
Algorithms [Pretest prevalence: 0.9%] TP TN FN FP Post-test prev.# Sensitivity [95 CI%]
Specificity [95 CI%]
PPV [95 CI%]
NPV [95 CI%]
1 H ever 15 7429 54 2 0.2% 22 (12–32) 100 (100–100) 88 (73–100) 99 (99–100)
1 H ever OR 1 ER ever 16 7427 53 4 0.3% 23 (13–33) 100 (100–100) 80 (63–98) 99 (99–100)
1 P ever 62 7188 7 243 4.1% 90 (83–97) 97 (96–97) 20 (16–25) 100 (100–100)
1 P ever by a specialist 56 7377 13 54 1.5% 81 (72–90) 99 (99–100) 51 (42–60) 100 (100–100)
2 P by any physician in 1 YR 58 7363 11 68 1.7% 84 (75–93) 99 (99–99) 46 (37–55) 100 (100–100)
2 P by any physician in 2 YR 58 7359 11 72 1.7% 84 (75–93) 99 (99–99) 45 (36–53) 100 (100–100)
2 P by any physician in 3 YR 58 7352 11 79 1.8% 84 (75–93) 99 (99–99) 42 (34–51) 100 (100–100)
3 P by any physician in 1 YR 55 7398 14 33 1.2% 80 (70–89) 100 (99–100) 63 (52–73) 100 (100–100)
3 P by any physician in 2 YR 55 7395 14 54 1.2% 80 (70–89) 100 (99–100) 60 (50–71) 100 (100–100)
3 P by any physician in 3 YR 55 7393 14 38 1.2% 80 (70–89) 100 (99–100) 59 (49–69) 100 (100–100)
2 P with≥1 P by a specialist in 1 YR 54 7404 15 27 1.1% 78 (69–88) 100 (100–100) 67 (56–77) 100 (100–100)
2 P with≥1 P by a specialist in 2 YR 54 7404 15 27 1.1% 78 (69–88) 100 (100–100) 67 (56–77) 100 (100–100)
2 P with≥1 P by a specialist in 3 YR 54 7401 15 30 1.1% 78 (69–88) 100 (100–100) 64 (54–75) 100 (100–100)
3 P with≥1 P by a specialist in 1 YR 53 7419 16 12 0.9% 77 (67–87) 100 (100–100) 82 (72–91) 100 (100–100)
3 P with≥1 P by a specialist in 2 YR 53 7418 16 13 0.9% 77 (67–87) 100 (100–100) 80 (71–90) 100 (100–100)
3 P with≥1 P by a specialist in 3 YR 53 7418 16 13 0.9% 77 (67–87) 100 (100–100) 80 (71–90) 100 (100–100)
(1 H ever) OR (2 P with≥1 P by a specialist in 1 YR)
55 7403 14 28 1.1% 80 (70–89) 100 (100–100) 66 (56–76) 100 (100–100)
(1 H ever) OR (2 P with≥1 P by a specialist in 2 YR)
55 7403 14 28 1.1% 80 (70–89) 100 (100–100) 66 (56–76) 100 (100–100)
(1 H ever) OR (2 P with≥1 P by a specialist in 3 YR)
55 7400 14 31 1.1% 80 (70–89) 100 (99–100) 64 (54–74) 100 (100–100)
(1 H ever) OR (3 P with≥1 P by a specialist in 1 YR)
54 7417 15 14 0.9% 78 (69–88) 100 (100–100) 79 (70–89) 100 (100–100)
(1 H ever) OR (3 P with≥1 P by a specialist in 2 YR)
54 7416 15 15 0.9% 78 (69–88) 100 (100–100) 78 (69–88) 100 (100–100)
(1 H ever) OR (3 P with≥1 P by a specialist in 3 YR)
54 7416 15 15 0.9% 78 (69–88) 100 (100–100) 78 (69–88) 100 (100–100)
(1 H ever) OR (2 P≥8 weeks apart in 2 YR, no exclusions*
57 7378 12 53 1.5% 83 (74–92) 99 (99–100) 52 (43–61) 100 (100–100)
(1 H ever) OR (2 P≥8 weeks apart in 2 YR) excluding Case A or Case B
41 7401 28 30 0.9% 59 (48–71) 100 (100–100) 58 (46–69) 100 (100–100)
(1 H ever) OR (2 P≥8 weeks apart in 3 YR) excluding Case A or Case B
41 7396 28 35 1.0% 59 (48–71) 100 (99–100) 54 (43–65) 100 (100–100)
(1 H ever) OR (2 P≥8 weeks apart in 4 YR) excluding Case A or Case B
43 7394 26 37 1.1% 62 (51–74) 100 (99–100) 54 (43–65) 100 (100–100)
(1 H ever) OR (2 P≥8 weeks apart in 5 YR) excluding Case A or Case B
44 7390 25 41 1.1% 64 (52–75) 99 (99–100) 52 (41–62) 100 (100–100)
(1 H ever) OR (2 P≥8 weeks apart in 2 YR) excluding Case A
41 7402 28 29 0.9% 59 (48–71) 100 (100–100) 59 (47–70) 100 (100–100)
All Ages: N = 7500 patients (69 RA and 7431 non-RA);#
include patients under active rheumatology care, but also patients whose symptoms may have resolved, and are no longer seeking RA care). When we varied our definition of RA based on levels of evidence in the primary care charts (i.e., varied the spectrum of disease in our cohort), more strict definitions of RA according to the reference stand-ard increased sensitivity, whereas more liberal definitions of RA (such as allowing any mention of RA with no sup-porting evidence, or those with a query RA diagnosis) de-creased sensitivity of the administrative data algorithms. Thus, defining an a priori reference standard to classify in-dividuals with RA has implications for validation study methodology. For instance, patients who fulfill strict clas-sification criteria, such as the 1987 RA criteria [17], may have more advanced disease (patients with longer disease duration, or more active disease requiring multiple phys-ician visits) and have a greater chance of being detected by administrative data algorithms. This finding was also observed in a review of studies that tested administrative data algorithms amongst RA patients who were required to meet strict classification criteria: these patients had a higher sensitivity in comparison to patients who were clas-sified by more liberal criteria (such as an RA diagnosis documented in the medical record) [2].
On the other hand, as specificity is computed only among those without RA, the type of patients included in the non-RA comparator group (as defined by the ref-erence standard) can influence the estimates of specifi-city. The lower specificity observed amongst non-RA patients in the rheumatology clinic study (85% versus 100% specificity observed amongst the primary care sample), is reflective of the patients without RA in the rheumatology clinic sample are individuals with other rheumatologic diagnoses (which may resemble RA, and/or who at one point in time may have been considered a pos-sible RA patient, and then evolved into a more clear diag-nosis, such as systemic lupus). In contrast, the comparator group of individuals without RA in our primary care sam-ple included patients with other conditions (unrelated to RA), which improved the specificity. This observation has implications for research that seeks to identify population-based algorithms with high specificity. Furthermore, it em-phasizes the importance of reporting the characteristics of the patients in the comparator group to inform proper in-terpretation of specificity estimates.
[image:7.595.58.539.100.386.2]While sensitivity and specificity are dependent on the characteristics of patients with and without the disease, re-spectively, predictive values depend on disease prevalence,
Table 4 Test characteristics of multiple algorithms among patients aged≥65 y Algorithms [Pretest prevalence: 1.8%] TP TN FN FP Post-test prev.# Sensitivity
[95 CI%]
Specificity [95 CI%]
PPV [95 CI%]
NPV [95 CI%]
1 P AND≥1 Rx ever 53 3248 10 115 4.9% 84 (75–93) 97 (96–97) 32 (25–39) 100 (100–100)
2 P AND≥1 Rx ever 51 3318 12 45 2.8% 81 (71–91) 99 (98–99) 53 (43–63) 100 (99–100)
2 P≥60 days apart AND≥1 RX ever 49 3320 14 43 2.7% 78 (68–88) 99 (98–99) 53 (43–64) 100 (99–100)
(1 H ever) OR (2 P AND≥1 Rx in 1 YR) 52 3337 11 26 2.3% 83 (73–92) 99 (99–100) 67 (56–77) 100 (100–100)
(1 H ever) OR (2 P AND≥1 Rx in 2 YR) 52 3335 11 28 2.3% 83 (73–92) 99 (99–100) 65 (55–76) 100 (100–100)
(1 H ever) OR (2 P AND≥1 RX in 3 YR) 52 3332 11 31 2.4% 83 (73–92) 99 (99–99) 63 (52–73) 100 (100–100)
(1 H ever) OR (2 P with≥1 P by specialist AND≥1 Rx in 1 YR)
52 3347 11 16 2.0% 83 (73–92) 100 (99–100) 77 (66–87) 100 (100–100)
(1 H ever) OR (2 P with≥1 P by specialist AND≥1 Rx in 2 YR)
52 3346 11 17 2.0% 83 (73–92) 100 (99–100) 75 (65–86) 100 (100–100)
(1 H ever) OR (2 P with≥1 P by specialist AND≥1 Rx in 3 YR)
52 3345 11 18 2.0% 83 (73–92) 100 (99–100) 74 (64–85) 100 (100–100)
(1 H ever) OR (3 P AND≥1 Rx in 1 YR) 47 3346 16 17 1.9% 75 (64–85) 100 (99–100) 73 (63–84) 100 (99–100)
(1 H ever) OR (3 P AND≥1 Rx in 2 YR) 48 3342 15 21 2.0% 76 (66–87) 99 (99–100) 70 (59–80) 100 (99–100)
(1 H ever) OR (3 P AND≥1 Rx in 3 YR) 48 3342 15 21 2.0% 76 (66–87) 99 (99–100) 70 (59–80) 100 (99–100)
(1 H ever) OR (3 P with≥1 P by specialist AND≥1 Rx in 1 YR)
47 3351 16 12 1.7% 75 (64–85) 100 (99–100) 80 (69–90) 100 (99–100)
(1 H ever) OR (3 P with≥1 P by specialist AND≥1 Rx in 2 YR)
48 3349 15 14 1.8% 76 (66–87) 100 (99–100) 77 (67–88) 100 (99–100)
(1 H ever) OR (3 P with≥1 P by specialist AND≥1 Rx in 3 YR)
48 3348 15 15 1.8% 76 (66–87) 100 (99–100) 76 (66–87) 100 (99–100)
Seniors 65+: N = 3426 patients (63 RA and 3363 non-RA);#
in addition to sensitivity and specificity. An important finding of our study is that our optimal algorithm had vir-tually the same PPV (78%) in both studies. Our primary care sample had an RA prevalence reflective of that of the general population (0.9%) in comparison to the rheuma-tology sample which had a study RA prevalence of 33% [4]. However, there was variation among the PPV esti-mates ranging from 51-83% amongst our primary care sample, and ranging from 55-80% amongst the rheumatol-ogy sample. The PPV estimates improved substantially with the requirement of increasing the number of diagno-sis codes and including musculoskeletal specialist codes for RA. In addition to differences in prevalence estimates in both samples, specificity differed, with all algorithms tested within our primary care sample achieving very high (≥97%) specificity. In general, for conditions that are present in a minority of the study population (such as our primary care sample), specificity has a greater impact than sensitivity on PPV. However specificity alone is not the sole factor increasing PPV amongst the primary care sam-ple, as all algorithms with high specificity would have moderately good PPV. A more likely explanation is that the preferred algorithm identified fewer false positives in both settings, as having fewer false positives increases PPV. This is likely owing to the nature of RA manage-ment, which often involves referral to a specialist, frequent physician visits and a non-curative long disease course. These observations suggest that patients with prevalent (long-term) chronic conditions may have a higher probabil-ity of being identified by the use of similar administrative data algorithms owing to the disease course, management practices, and frequency of physician visits. This finding may be further supported by the concordance between our results and those from algorithms for case ascertainment of diabetes [17], hypertension [18], and other chronic dis-eases with substantially higher prevalence than RA.
This study has both strengths and limitations. Patients were randomly sampled from primary care physician re-cords and we tested many more permutations of admi-nistrative data algorithms than other studies. We also conducted rigorous chart reviews. However, misclassifica-tion of RA is a potential risk if there is lack of documenta-tion in the medical record, such as a failure to capture all specialist consultation notes. Further, clinical characteris-tics for the RA patients may be under-documented in pri-mary care clinical records. Recognizing this challenge, we opted to include all physician-reported diagnoses to define our reference standard, as our retrospective study design can make it difficult to determine true disease status. However, our present findings extend those of previous re-search performed using the General Practice Rere-search Database, which also found a sensitivity of 80% for pa-tients with 3 RA diagnosis codes [19]. Further, as the pur-pose of our study was to test the accuracy of algorithms
for classifying RA patients within administrative data, we were unable to confirm the validity of the diagnosis of RA itself (whether doctors were correctly diagnosing RA). However, the majority of RA patients had specialist notes to confirm RA.
Another potential limitation is that our findings are de-rived from patients who have a regular source of primary care. Consequently, our results may not be generalizable to patients who do not have a regular primary care phys-ician. Although almost ten million Ontarians (that is, over 80% of the population) are now rostered to a primary care physician [20,21], we acknowledge this limitation and opted to include inpatient RA diagnosis codes in our final preferred administrative algorithm, even though alone these codes had low sensitivity (22%) and offered little im-provement over physician-billing algorithms. The addition of an inpatient RA code to“3 physician RA claims with≥1 by a specialist in a 2 year period” may subsequently in-crease the sensitivity of our algorithm when it is applied to the entire population since hospitalization data may be needed to pick up RA cases who either have no regular physician, or who are followed by the approximately 5% of Ontario physicians who are salaried (and who do not ne-cessarily contribute to billing data) [22].
In addition, while the overall goal was to recommend the optimal algorithm for use in Ontario, we report the re-sults of numerous algorithms so that researchers can be better informed by choosing the case definition best suit-able for their study populationsandstudy purpose. Due to different characteristics inherit to different administrative databases it would be imprudent to suggest preferred algo-rithms for use outside of Canada, where other researchers may be better informed on the characteristics of their own databases under study. Rather, algorithms should be se-lected based on study purpose and feasibility and weigh the relative importance of accuracy measures that is most important to a particular study. Incorrectly choosing the wrong algorithm or prioritizing the wrong accuracy meas-ure can lead to misclassification, which can lead to re-duced power, loss of generalizability, as well as increased bias, and possibly study cost [23].
Conclusions
Our study demonstrates that administrative data algo-rithms can detect RA patients who receive regular primary care with a high degree of accuracy. However, accuracy varied slightly with the use of an alternative reference standard. Our findings will inform future population-based research and will serve to improve arthritis research surveillance activities across Canada and abroad.
Competing interests
non-profit research corporation funded by the Ontario Ministry of Health and Long-Term Care (MOHLTC). The opinions, results and conclusions are those of the authors and are independent from the funding sources. No endorsement by ICES or the Ontario MOHLTC is intended or should be inferred. We thank Brogan Inc., Ottawa for use of their Drug Product and Therapeutic Class Database.
Authors’contributions
JW, CB, SB, JMP, NI, DAB, RLJ, JCT and KT participated in the design of the study. JW, DG and JY performed the statistical analysis. All authors participated in interpreting results, drafting the manuscript and approved the final manuscript.
Acknowledgements
First and foremost, we wish to thank all the family physicians who provide data to the Electronic Medical Record Administrative data Linked Database (EMRALD). We would like to thank our five chart abstractors for their work: Nancy Cooper, Abayomi Fowora, Diane Kerbel, Anne Marie Mior and Barbara Thompson and assistance from Myra Wang and Robert Turner at the Institute for Clinical Evaluative Sciences (ICES) and Drs. Vandana Ahluwalia, William Osler Health Center; Dr. George Tomlinson and Dr. Susan Jaglal, University of Toronto; and Dr. Jeffrey Curtis, University of Alabama at Birmingham for their external review. We also wish to thank Siobhan O'donnell of the Public Health Agency of Canada for her critique of the work Dr. Bombardier holds a Canada Research Chair in Knowledge Transfer for Musculoskeletal Care (2002–2016) and a Pfizer Research Chair in Rheumatology. Dr. Bernatsky holds a career award from theFonds de la recherche en santé du Québec(FRSQ). Dr. Ivers holds a CIHR Fellowship Award in Clinical Research and a Fellowship Award from the Department of Family and Community Medicine, University of Toronto; and Dr. Tu holds a CIHR award in the Area of Primary Care (2011–2013).
Significance and innovations
•Administrative data algorithms have a high degree of accuracy of detecting RA patients within a general population.
•Accuracy of administrative data algorithms varied slightly with the use of an alternative reference standard, which can be attributed to differences in the study samples (reference standards) with respect to disease prevalence, spectrum of disease, and type of comparator group.
•Defining an a priori reference standard to classify individuals has implications for validation study methodology. Our study also emphasizes the importance of reporting the characteristics of both the case patients and the types of patients in comparator group to inform proper interpretation of sensitivity and specificity estimates, respectively. •Researchers should acknowledge the potentially generalizeability of the
performance characteristics of administrative data algorithms which may have been influenced by the reference standard used in the validation process.
Author details
1University of Toronto, Toronto, 200 Elizabeth St 13EN-224, Toronto, ON M5G 2C4, Canada.2McGill University, Montreal, QC, Canada.3Institute for Clinical Evaluative Sciences, Toronto, ON, Canada.4McMaster University, Hamilton, ON, Canada.5Women’s College Hospital, Toronto, ON, Canada.6Sunnybrook Health Sciences Centre, Toronto, ON, Canada.7Southlake Regional Health Centre, Newmarket, ON, Canada.
Received: 16 December 2013 Accepted: 10 June 2014 Published: 23 June 2014
References
1. Bernatsky S, Lix L, O’Donnell S, Lacaille D, CANRAD Network:Consensus statements for the use of administrative health data in rheumatic disease research and surveillance.J Rheumatol2013,40:66–73. 2. Widdifield J, Labrecque J, Lix L, Paterson JM, Bernatsky S, Tu K, Ivers N,
Bombardier C:A systematic review and critical appraisal of validation studies to identify rheumatic diseases in health administrative databases.Arthritis Care Res2013,65:1490–1503.
3. Benchimol EI, Manuel DG, To T, Griffiths AM, Rabeneck L, Guttmann A: Development and use of reporting guidelines for assessing the quality of validation studies of health administrative data.J Clin Epidemiol2011, 64:821–829.
4. Widdifield J, Bernatsky S, Paterson JM, Tu K, Ng R, Thorne JC, Pope JE, Bombardier C:Accuracy of Canadian health administrative databases in identifying patients with rheumatoid arthritis: a validation study using the medical records of rheumatologists.Arthritis Care Res (Hoboken)2013,65:1582–1591. 5. Tu K, Mitiku TF, Ivers NM, Guo H, Lu H, Jaakkimainen L, Kavanagh DG, Lee
DS, Tu JV:Evaluation of Electronic Medical Record Administrative data Linked Database (EMRALD).Am J Manag Care2014,20:e15–e21. 6. Arnett FC, Edworthy SM, Bloch DA, Mcshane DJ, Fries JF, Cooper NS, Healey
LA, Kaplan SR, Liang MH, Luthra HS, Medsger TA, Mitchell DM, Neustadt DH, Pinals RS, Schaller JG, Sharp JT, Wilder RL, Hunder GG:The American Rheumatism Association 1987 revised criteria for the classification of rheumatoid arthritis.Arthritis Rheum1988,31:315–324.
7. Aletaha D, Neogi T, Silman AJ, Funovits J, Felson DT, Bingham CO 3rd, Birnbaum NS, Burmester GR, Bykerk VP, Cohen MD, Combe B, Costenbader KH, Dougados M, Emery P, Ferraccioli G, Hazes JM, Hobbs K, Huizinga TW, Kavanaugh A, Kay J, Kvien TK, Laing T, Mease P, Ménard HA, Moreland LW, Naden RL, Pincus T, Smolen JS, Stanislawska-Biernat E, Symmons D,et al: 2010 Rheumatoid arthritis classification criteria: an American College of Rheumatology/European League Against Rheumatism collaborative initiative.Arthritis Rheum2010,62:2569–2581.
8. Ontario Health Insurance Plan: The Program.Toronto: Ontario Ministry of Health and Long-Term Care; 2008. http://www.health.gov.on.ca/en/public/programs/ohip/. 9. World Health Organization:International Classification of Diseases, Ninth
Revision Clinical Modification.Geneva: World Health Organization; 1988. 10. CIHI:Canadian Institute for Health Information, The CIHI Data Quality
Framework.Ottawa, Ont: CIHI; 2009.
11. Ontario Drug Benefit: The Program.Toronto: Ontario Ministry of Health and Long-Term Care; 2008. http://www.health.gov.on.ca/en/pro/programs/ drugs/odbf_mn.aspx. (Accessed April 2012).
12. Chan B, Schultz S:Supply and Utilization of General Practitioner and Family Physician Services in Ontario.Institute for Clinical Evaluative Sciences: Toronto, ON; 2005.
13. Improving Health Care Data in Ontario. ICES Investigative Report.Toronto: Institute for Clinical Evaluative Sciences; 2005.
14. Bossuyt PM, Reitsma JB, Bruns DE, Gatsonis CA, Glasziou PP, Irwig LM, Moher D, Rennie D, de Vet HC, Lijmer JG, Standards for Reporting of Diagnostic Accuracy Group:Standards for Reporting of Diagnostic Accuracy. The STARD statement for reporting studies of diagnostic accuracy: explanation and elaboration.Ann Intern Med2003,138:W1–W12. 15. Crowson CS, Matteson EL, Myasoedova E, Michet CJ, Ernste FC, Warrington
KJ, Davis JM 3rd, Hunder GG, Therneau TM, Gabriel SE:The lifetime risk of adult-onset rheumatoid arthritis and other inflammatory autoimmune rheumatic diseases.Arthritis Rheum2011,63:633–639.
16. Koepsell T, Weiss N:Epidemiologic Methods: Studying the Occurrence of Illness.New York, NY: Oxford University Press; 2003.
17. Hux JE, Tang M:Patterns of Prevalence and Incidence of Diabetes.Toronto: Institute for Clinical Evaluative Sciences; 2003.
18. Tu K, Campbell NR, Chen ZL, Cauch-Dudek KJ, McAlister FA:Accuracy of administrative databases in identifying patients with hypertension. Open Med2007,1:e18–e26.
19. Thomas SL, Edwards CJ, Smeeth L, Cooper C, Hall AJ:How accurate are diagnoses for rheumatoid arthritis and juvenile idiopathic arthritis in the general practice research database?Arthritis Rheum2008,59:1314–1321. 20. Glazier R, Zagorski B, Rayner J:Comparison of Primary Care Models in Ontario
by Demographics, Case Mix and Emergency Department Use, 2008/09 to 2009/ 10.Toronto: Institute for Clinical Evaluative Sciences; 2012.
21. Kralj B, Kantarevic J:Primary Care in Ontario: Reforms, Investments and Achievements.Ontario Medical Review; 2012. Available online: www.oma.org/Resources/Documents/PrimaryCareFeature.pdf.
22. MD Physician Services Inc:Canadian Medical Association: Physician Remuneration Options.Ottawa, ON, Canada: 2011. Available Online: md.cma.ca.
23. Chubak J, Pocobelli G, Weiss NS:Tradeoffs between accuracy measures for electronic health care data algorithms.J Clin Epidemiol2012, 65:343–349. e2.
doi:10.1186/1471-2474-15-216
Cite this article as:Widdifieldet al.:An administrative data validation study of the accuracy of algorithms for identifying rheumatoid arthritis:
the influence of the reference standard on algorithm performance.BMC