Open Access
Research article
Changes in Chopart joint load following tibiotalar arthrodesis: in
vitro analysis of 8 cadaver specimen in a dynamic model
A Suckel*
1, O Muller
1, T Herberts
2and N Wulker
1Address: 1Orthopaedic Department, Tubingen University Hospital, Hoppe-Seyler Str. 3, 72076 Tubingen, Germany and 2Department of Medical
Biometry, University of Tubingen, Westbahnhofstrasse 55, 72070 Tubingen, Germany
Email: A Suckel* - [email protected]; O Muller - [email protected]; T Herberts - [email protected]; N Wulker - [email protected]
* Corresponding author
Abstract
Background: In the current discussion of surgical treatment of arthroses in the ankle joint, arthrodesis is in competition with artificial joint replacement. Up until now, no valid biomechanical findings have existed on the changes in intraarticular loads following arthrodesis. One argument against tibiotalar arthrodesis is the frequently associated, long-term degeneration of the talonavicular joint, which can be attributed to changes in biomechanical stresses.
Methods: We used a dynamic model to determine the changes in intraarticular forces and peak-pressure in the talonavicular joint and in the calcaneocuboid joint on 8 cadaver feet under stress in a simulated stance phase following tibiotalar arthrodesis.
Results: The change seen after arthrodesis was a tendency of relocation of average force and maximum pressure from the lateral onto the medial column of the foot. The average force increased from native 92 N to 100 N upon arthrodesis in the talonavicular joint and decreased in the calcaneocuboid joint from 54 N to 48 N. The peak pressure increased from native 3.9 MPa to 4.4 MPa in the talonavicular joint and in the calcaneocuboid joint from 3.3 MPa to 3.4 MPa. The increase of force and peak pressure on the talonavicular joint and decrease of force on the calcaneocuboid joint is statistically significant.
Conclusion: The increase in imparted force and peak pressure on the medial column of the foot following tibiotalar arthrodesis, as was demonstrated in a dynamic model, biomechanically explains the clinically observed phenomenon of cartilage degeneration on the medial dorsum of the foot in the long term. As a clinical conclusion from the measurements, it would be desirable to reduce the force imparted on the medial column with displacement onto the lateral forefoot, say by suitable shoe adjustment, in order to achieve a more favourable long-term clinical result.
Background
The surgical treatment of ankle joint arthrodeses is cur-rently a subject of hot debate, where many authors view arthrodesis as the standard treatment [1-3]. Providing patients with endoprosthetics is a promising alternative
and, with the improvement of recent component designs, there are reports of successful long-term outcomes [4] and unexpectedly good results upon return to sporting activity [5]. In the event of a failed endoprosthesis, a problematic situation arises, characterized by significant loss of bone,
Published: 8 August 2007
BMC Musculoskeletal Disorders 2007, 8:80 doi:10.1186/1471-2474-8-80
Received: 7 December 2006 Accepted: 8 August 2007
This article is available from: http://www.biomedcentral.com/1471-2474/8/80
© 2007 Suckel et al; licensee BioMed Central Ltd.
a high pseudoarthrosis rate and bad clinical results [6]. Thus, the modern prosthetic – with its relative advantage of retention of function and good clinical results acpanied by the potential of an outcome fraught with com-plications – is in competition with the tried and tested arthrodesis. Here, the reliably attainable lack of pain in the medium-term posed against the threat of long-term joint degeneration in the subtalar and transverse hindfoot joint ranks high on the list of current interests [2,7,8], and until now, there has been no clear evidence of either an alternative treatment or even a less drastic therapy regime. In light of this situation, a biomechanical understanding of the complex hindfoot anatomy is especially important. A possible change in the distribution of forces and peak pressure loads in the Chopart joint has so far not been reliably documented, and it is our intention to investigate these effects after simulated tibiotalar arthrodesis in a real-istic dynamic cadaver model and thus to add a biome-chanically substantiated basis to the current debate.
Methods
Eight macroscopically and roentgenographically normal foot specimens were tested comparing tibiotalar arthode-sis vs. nativ situation on a dynamic gait simulator. The stance-phase of walking was simulated from heel-contact to toe-off. Ground reaction forces were simulated by a tilt-ing angle- and force-controlled translation stage upon which a pressure measuring platform was mounted (EMED SF1, Novel GmbH, Munich, Germany). Force were applied to the tendons of the foot flexor and extensor muscle groups by cables attached to an additional set of six force-controlled hydraulic cylinders (GHS GmbH, Ils-feld-Auenstein, Germany). Tibial rotation was produced by an electrical servo motor (Megatorque Motor System, NSK Ltd., Tokyo). The foot simulator functions inversely and was described previously [9]. The pressure measuring platform (50 by 30 cm, 1 sensor/cm2) upon which the
foot „walked“ was mounted on a hydraulically activated translation platform. The platform was elevated by means of a force-controlled hydraulic cylinder which was pro-grammed and calibrated to simulate the vertical compo-nent of the ground reaction force. The translation stage was further allowed to move freely in the medial-lateral, and anterior-posterior directions. The platform was tilted by a second angle-controlled hydraulic cylinder in order to simulate tibial inclination (sagittal plane tibial versus ground angle).
Lower limb specimens were obtained by transection at approximately mid-tibial length. Soft tissues were removed to roughly 4 cm above the ankle joint. The ten-dons of the lower-leg muscles were blunt dissected free of the leg to allow attachment via clamps to cable pulls by means of which force was applied. Nine tendons of the foot were simulated with six hydraulic cylinders: the
tri-ceps surae, tibialis posterior, flexor hallucis longus and flexor digitorum longus combined, tibialis anterior, per-oneus longus and brevis combined, and combined exten-sor digitorum longus and extenexten-sor hallucis longus.
The proximal ends of the specimen tibia and fibula were prepared clear to the surface of the bone and potted in their relative anatomical positions in a cold-curing meth-ylmethacrylate resin (Technovit 4071, Heraeus Kulzer, GmbH, Wehrheim, Germany). The potted tibia and fibula were mounted concentrically and vertically oriented in an aluminium tibia mounting cylinder using centring screws. Neutral rotation of the tibia was defined prior to testing by turning the mounting cylinder to orient the foot in 12° of external rotation with respect to the long axis of the pressure measuring platform.
Physiological gait was simulated from heel strike (0%) to toe-off (100%) over a standardised time of 60 s (fig. 1). Activation patterns for normal gait were used to prescribe forces for each simulated muscle, as was reported before [9]. Based on previous experiments the muscle force for each tendon was set at: Achilles tendon – 780 N at 70% stance phase, tibialis posterior – 225 N at 75%, peroneal tendons – 132 N at 70%, flexor hallucis – 90 N at 85%, tibialis anterior – 66 N at heel contact and extensors of toes – 19 N at 90%. This took into account deviation from normal physiology caused by lack of function of the intrinsic muscles and a wide range of variation in physio-logic walking patterns. All specimen were axial loaded with 35 kg to prevent damage of the arthrodesis and to avoid disconnection of the tendon-clamps, this load was tested in previous studies and shown unproblematic for stability of the model.
Intraarticular pressure was measured with resistive pres-sure sensors (K-scan sensor, map 4201, Tekscan Inc., Bos-ton, MA). The sensor sheets with a thickness of 0.3 mm consists of 264 different sensors arranged in an 11 by 24 matrix with a spatial resolution of 1,8 mm and a maxi-mum pressure range of 2000 PSI (i.e. 13,8 MPa). The pres-sure values were recorded with the manufactures software (Iscan) with a recording rate of 2 Hz for a time span of 60 seconds to achieve 120 pressure frames. Raw data were then exported as ASCII-Files and further analyzed in Mat-Lab (TheMathwork Inc, Natick, MA).
the experiments, the position was closely followed by the investigators in order to exclude displacement of the sen-sors during foot motion. Each experiment was performed with five repetitions. The applied load of the joint was characterized by the time course of the force acted upon the sensor area for each pressure frame and the maximum peak pressure value (mpp) within each frame. Mean val-ues for the time course of the 5 repetitions and the 95%-confidence interval were calculated to visualize possible differences in the time course of force and mpp graphi-cally.
Tibiotalar arthrodesis was performed with a stabile fixa-tion using external fixator without removing the cartilage. One pin was placed in the distal tibia and another two pins were placed in the talus body. The pins were con-nected under maximal compression in a triangle construc-tion medial and lateral. Each specimen was checked for
correct placement of the pins using x-ray images and checked for stability under load application prior to start the nativ measuring cycles before fixing the foot in the model, free movement of the neighbouring joints was controlled as well. An additional pin was placed in the tuber calcanei for later study of subtalar arthrodesis. Spe-cial concern was taken not to affect tendon-gliding by the Steinmann pins
Measurements were taken first for nativ load for five cycles with the fixateur pins still in situ. After completing the nativ measuring the pins were connected to simulate tibi-otalar arthrodesis without changing the simulating condi-tions to get same condicondi-tions for the five arthrodesis runs. Tibial rotation, muscleforce simulation and ground react-ing forces were not changed.
The data were analyzed using the statistical software JMP IN 5.1 (SAS Institute Inc., Cary, NC, USA). For each of the 8 feet and each of the 5 replications, the measurements consisted of the values for force and peak pressure for 120 points in time. As dependent variables, we took the mean of the 120 values of the force and the maximum of the 120 peak pressures to get overall values for the whole stance phase. Since these were not normally distributed, we used the Box-Cox transformation of the data to obtain normally distributed data with equal variances. An analy-sis of variance was performed with the state (native vs. arthrodesis), the joint, their interaction and the length of the foot as fixed factors and the foot number as random factor. Furthermore, an analysis of variance was carried out for each joint separately, now with the state and the length of the foot as fixed factors and the foot number as random factor. For obtaining the median and 95% confi-dence intervals (95% CI), the means and 95% CIs of the Box-Cox transformations were transformed back.
Results
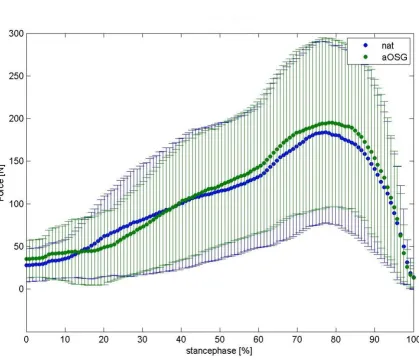
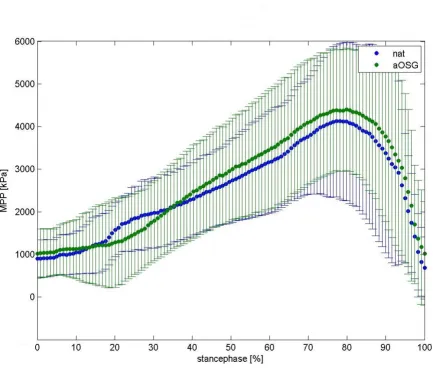
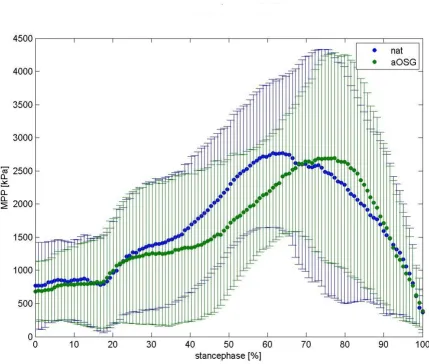
We present a mean normalised time course for the force values in the talonavicular joint in figure 2 and in calcane-ocuboid joint in figure 3. Differences between native feet and arthrodeses are shown in colour for each moment of the stance phase. The mean time course of maximum peak pressure (MPP) is presented in figure 4 for the talonavicu-lar joint and in figure 5 for the calcaneocuboid joint.
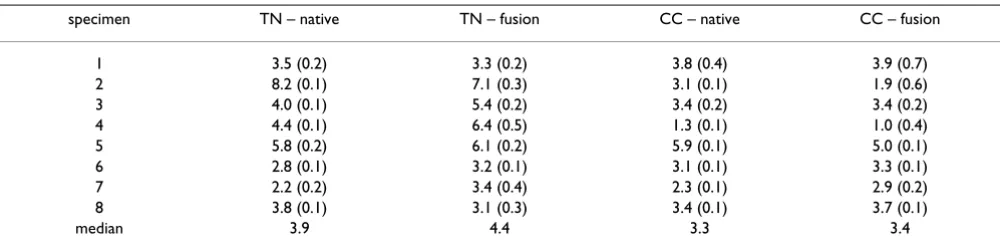
The values for median force during stance phase of both parts of Chopart's joint for 8 foot specimen is given in table 1 as well as for maximum peak pressure in table 2.
Effects of tibiotalar arthrodesis on the talonavicular joint
We observed a varied increase in intraarticular force and peak pressure in the talonavicular joint following arthro-desis. The median force changed from a native value of 92 N (95% CI: 64 N–145 N) to 100 N (95% CI: 69 N–164 N)
[image:3.612.55.295.84.409.2]Simulated gait cyclus over full stance of 60 sec
Figure 1
upon arthrodesis. Over all feet, the increase in force on the talonavicular joint was statistically significant (p = 0.027), while we also saw a significant increase in the peak pres-sure (p = 0.0005) from native 3.9 MPa (95% CI: 3.1 MPa– 5.7 MPa) to 4.4 MPa (95% CI: 3.5 MPa–6.2 MPa).
Effects of tibiotalar arthrodesis on the calcaneocuboid joint
In the calcaneocuboid joint, we recorded lower values for force upon arthrodeses, the effect was statistically signifi-cant (p = 0.029). We observed a median decrease from the native load, from 54 N (95% CI: 28 N–91 N) to 48 N
(95% CI: 24 N–82 N) upon arthrodesis; regarding intraar-ticular peak pressure, we saw a change from native 3.3 MPa (95% CI: 2.7 MPa–4.4 MPa) to 3.4 MPa (95% CI: 2.6 MPa–4.2 MPa). This effect was not significant (p = 0.098).
Change in stress distribution between talonavicular and calcaneocuboid joints
Our measurements indicate a tendency of relocation of the force onto the talonavicular joint after arthrodesis with a reduction of the force on the calcaneocuboid joint. Overall, this relocation of force is statistically not signifi-cant (p-value of interaction: 0.30). The effect of the
[image:4.612.93.513.90.450.2]relo-Mean curve of force of 8 foot-specimen, talonavicular joint
Figure 2
cation of maximum peak pressure onto the talonavicular joint is also not detectable with statistical significance (p = 0.11).
In our experiment, there is a trend correlating the size of the foot preparations with the imparted force, where larger preparations in the model produced higher values than smaller preparations regarding the sum of the two parts of the Chopart joint (p = 0.0043). There is no statis-tically significant correlation of peak pressure with foot size (p = 0.07).
Discussion
The transfer of force from the tibia to the ground when walking is imparted through an extension/flexion move-ment of the foot against the lower leg and also an ever-sion/inversion movement in the hindfoot and an
abduction/adduction movement in the forefoot. Previous examinations show here that about 4/5 of the extension/ flexion movement is imparted through the ankle joint and 1/5 through the Chopart joint [9]. The latter can greatly increase the extent of movement in the case of arthrodesis in individual cases; this is associated with greater stress on the joint [3,11]. The mobility of the foot, in terms of dorsiflexion and plantar flexion, is given at about 10° for each following tibiotalar arthrodesis, which has been described as sufficient for normal walking [12]. Furthermore, a change in the movement axis between foot and lower leg in the stance phase due to arthrodesis was demonstrated, with a greater than 100% increase in tibia rotation and hindfoot inversion and eversion [12,13]. This observation explains the increased stress in the medial column of the foot that we measured in our exper-iments. Due to the increased calcaneal eversion in
dorsi-Mean curve of force of 8 foot-specimen, calcaneocuboid joint
Figure 3
flexion, the foot rolls – in the case of lacking mobility – off over the medial column, especially since a forceful push-off position in a plantar flexion position can no longer be naturally achieved in the case of a fused ankle joint.
The complex anatomy of the Chopart joint, with a ball-and-socket articulation at the medial column of the foot and a saddle articulation at the lateral column, is an expe-dient biomechanical construction for accomplishing the complex tasks of the foot, namely optimally adapting to uneven surfaces upon first heel contact and forcefully pushing the foot off the ground at the end of the walk cycle. The locking mechanism of the Chopart joint upon calcaneal inversion was described by Elftman 1960 [14]. This locking was attributed to divergence of the transverse
axes of the talonavicular joint and the calcaneocuboid joint in the case of calcaneal inversion or plantar flexion. In contrast, the joint is loose upon eversion of the hind-foot or dorsal flexion caused by parallel alignment of the joint axes [15]. This anatomical feature allows optimal adaptation of the foot at the beginning of the rolling motion immediately after contact of the heel with the ground. We observed that this locking effect of the Cho-part joint is supported by an active spreading-out move-ment of the dorsal, convex head of the talus and of the plantar convex part of the calcaneocuboid joint, measura-ble by a pressure increase dorsal in the talonavicular joint and plantar in the calcaneocuboid joint at the push-off phase [16] and it is easy to understand that this locking mechanism is compromised by the described
[image:6.612.82.516.82.450.2]biomechan-Mean curve maximum peak pressure (mpp) of 8 foot-specimen, talonavicular joint
Figure 4
Table 1: Differences of force transfer in Chopart's-joint
specimen TN – native TN – fusion CC – native CC – fusion
1 146 (15.4) 89 (5.3) 64 (10.5) 43 (11.8)
2 94 (11.2) 95 (3.6) 8 (1.4) 3 (1.8)
3 70 (5.1) 114 (6.4) 32 (2.0) 71 (3.0)
4 102 (2.0) 184 (22.0) 19 (1.5) 15 (1.4)
5 246 (3.3) 209 (14.0) 97 (7.1) 63 (7.6)
6 42 (1.2) 42 (1.2) 87 (1.9) 55 (2.9)
7 45 (1.1) 58 (4.6) 63 (1.6) 73 (3.6)
8 90 (0.9) 80 (7.0) 75 (3.4) 80 (8.4)
median 92 100 54 48
Results for 8 specimen, mean force of 5 measuring cycles of talonavicular joint (TN) and calcaneocuboid joint (CC), native situation vs. ankle fusion
Mean curve maximum peak pressure (mpp) of 8 foot-specimen, calcaneocuboid joint
Figure 5
ical changes with a resulting insufficiency of the joint sta-bilisation during push-off. This effect may even provide more stress on the talonavicular joint.
Since it is not possible to make in-vivo measurements of intraarticular pressures or analyse the imparted forces in people, the biomechanical joint stresses must be simu-lated in a model. In this regard, computer simulations and cadaver experiments are possible approaches. Cadaver experiments are thus, even in the present study, only a model in the simulation of physiological processes and thus limitations of their meaning must be taken into account. An essential advantage of our experiment is the ability of the test apparatus to simulate even extrinsic ten-don pull on the foot. As such, our simulation is a test setup that corresponds more closely to reality than previ-ously published experiments. The inability of earlier cadaver experiments to simulate this has been described as significantly disadvantageous [13].
We observed much interindividual variance among our preparations. This can be explained by the fact that the preparations were of different sizes, and a fluctuation of the results in the range of 100% can be reasonably explained by different individual anatomic conditions, such as body weight. We were able to make a statistical correlation between imparted force and foot size. Since we activated the same muscles in all preparations, we assume relatively too high measurements for the smaller feet and too low measurements for the larger feet. After averaging the results, we obtained a realistic average value.
One specific possibility for error in our experiments was the possibility that forces were being imparted off to the side of the pressure films, which cannot be ruled out with absolute certainty in the narrow joints, even after careful preparation and placement of the films.
Determining force and pressure conditions in the articula-tions of the hindfoot is technically difficult. In a previous
study the loads on the subtalar joint and the talonavicular joint following tibiotalar arthrodesis were determined in a servohydraulic test machine [17]. The Fuji pressure films used were the same thickness as our Texscan films at 0.3 mm, thus in principle it must be taken into account that the film could become stuck in the joint; furthermore, unintentional slipping is also conceivable [18]. Also, the effect of the intrinsic foot musculature has not been fac-tored into the model, but can be assumed to be minimally relevant in the examination of a hindfoot articulation. The reproducibility of the individual measurements in our test was predominantly very good. The potential error in observing the forces arises in the analysis of the native values; the error is eliminated, however, in the compari-son of the native values with the arthrodesis.
Conclusion
[image:8.612.55.555.99.224.2]After tibiotalar arthrodesis, we measured inconsistent interindividual changes in the Chopart joint. The imparted force and, consequently, the peak pressure both rise on the medial column of the foot in the talonavicular joint and the force fall on the lateral column in the calca-neocuboid joint. When seen in connection with the clini-cally observed and scientificlini-cally described adaptation processes – with an increase in the degree of movement in the talonavicular joint after ankle joint arthrodesis, increased tibial rotation and increased calcaneal eversion – this biomechanical fact impressively explains the appearance of cartilage degeneration on the medial dor-sum of the foot. The increase in peak pressure after tibio-talar arthrodesis at the point of highest loading during the forceful push-off phase of the foot must be particularly problematic. As a conclusion of our experiment, it would be desirable to reduce the force imparted on the medial column that results from arthrodesis, with lateral reloca-tion of the imparted force. Further clinical investigareloca-tions are required to test such an effect, say, by simple shoe adjustment with support of the lateral forefoot or a restric-tion of hindfoot eversion after tibiotalar arthrodesis, the objective being to improve the long-term results.
Table 2: Differences of peak-pessure in Chopart's-joint
specimen TN – native TN – fusion CC – native CC – fusion
1 3.5 (0.2) 3.3 (0.2) 3.8 (0.4) 3.9 (0.7)
2 8.2 (0.1) 7.1 (0.3) 3.1 (0.1) 1.9 (0.6)
3 4.0 (0.1) 5.4 (0.2) 3.4 (0.2) 3.4 (0.2)
4 4.4 (0.1) 6.4 (0.5) 1.3 (0.1) 1.0 (0.4)
5 5.8 (0.2) 6.1 (0.2) 5.9 (0.1) 5.0 (0.1)
6 2.8 (0.1) 3.2 (0.1) 3.1 (0.1) 3.3 (0.1)
7 2.2 (0.2) 3.4 (0.4) 2.3 (0.1) 2.9 (0.2)
8 3.8 (0.1) 3.1 (0.3) 3.4 (0.1) 3.7 (0.1)
median 3.9 4.4 3.3 3.4
Publish with BioMed Central and every scientist can read your work free of charge "BioMed Central will be the most significant development for disseminating the results of biomedical researc h in our lifetime."
Sir Paul Nurse, Cancer Research UK
Your research papers will be:
available free of charge to the entire biomedical community
peer reviewed and published immediately upon acceptance
cited in PubMed and archived on PubMed Central
yours — you keep the copyright
Submit your manuscript here:
http://www.biomedcentral.com/info/publishing_adv.asp
BioMedcentral
Competing interests
The author(s) declare that they have no competing inter-ests.
Authors' contributions
AS: planning, writing and leading the study; TH: statistical analyses and support in mathematical preparation of the complex interpretation of data; OM: Preparation of the data writing MatLab programms to interpret raw data and creates figures; NW: organized financial support and con-structed the testing apparatus
Acknowledgements
We thank Peter Langenstein and Marco Koriller for their help on obtaining the data and deutsche Arthrosehilfe e.V. for their financial support of the experiment.
References
1. Ahlberg A, Henricson AS: Late results of ankle fusion. Acta Orthop Scand 1982, 52:103-105.
2. Coester LM, Saltzman CL, Leupold J, Pontarelli W: Long-term results following ankle arthrodesis for post-traumatic arthri-tis. J Bone Joint Surg 2001, 83-A:219-228.
3. Takakura Y, Tanaka Y, Sugimoto K, Akiyama K, Tamai S: Long-term results of arthrodesis for osteoarthritis of the ankle. Clin Orthop Relat Res 1999, 361:178-185.
4. Anderson T, Montgomery F, Carlsson A: Uncemented STAR
total ankle prostheses. J Bone Joint Surg 2004, 86-A(Suppl 1):103-111.
5. Valderrabano V, Pagenstert G, Horisberger M, Knupp M, Hintermann B: Sports and recreation activity of ankle arthritis patients before and after total ankle replacement. Am J Sports Med
2006, 34:993-999.
6. Hopgood P, Kumar R, Wood PL: Ankle arthrodesis for failed total ankle replacement. J Bone Joint Surg 2006, 88:1032-1038. 7. Morgan CD, Henke JA, Bailey RW, Kaufer H: Long-term results of
tibiotalar arthrodesis. J Bone Joint Surg 1985, 67-A:546-550. 8. Schaap EJ, Huy J, Tonino AJ: Long-term results of arthrodesis of
the ankle. Int Orthop 1990, 14:9-12.
9. Hurschler C, Emmerich J, Wulker N: In vitro simulation of stance phase gait part I: Model verification. Foot Ankle Int 2003, 24:614-622.
10. Lundberg A, Goldie I, Kalin B, Selvik G: Kinematics of the ankle/ foot complex: plantarflexion and dorsiflexion. Foot Ankle 1989, 9:194-200.
11. Grass R, Rammelt S, Endres T, Zwipp H: Reorientierende Arthro-dese des oberen Sprunggelenkes in der 4-Schrauben Tech-nik. Orthopäde 2005, 34:1209-1215.
12. Hintermann B, Nigg BM: Influence of arthrodeses on kinematics of the axially loaded ankle complex during dorsiflexion/ plantarflexion. Foot Ankle Int 1995, 16:633-636.
13. Valderrabano V, Hintermann B, Nigg BM, Stefanyshyn D, Stergiou P: Kinematic changes after fusion and total replacement of the ankle. Part 2: Movement transfer. Foot Ankle Int 2003, 24:888-896.
14. Elftman H: The transverse tarsal joint and its control. Clin Orthop 1960, 16:41-46.
15. Inman VT: The joints of the ankle Baltimore: Williams and Wilkins; 1976.
16. Suckel A, Langenstein P, Herberts T, Muller O, Reize P, Wulker N: Chopart's joint load during gait. Gait Posture 2007 in press. 17. Wayne JS, Lawhorn KW, Davis KE, Prakash K, Adelaar RS: The
effect of tibiotalar fixation on foot biomechanics. Foot Ankle Int
1997, 18:792-797.
18. Martinelli L, Hurschler C, Rosenbaum D: Comparison of capaci-tive versus resiscapaci-tive joint contact stress sensors. Clin Orthop Relat Res 2006, 447:214-220.
Pre-publication history
The pre-publication history for this paper can be accessed here: