Research Notes
Younger and older households in the crisis
Quarterly Economic Commentary – Spring 2013| 53
ESRI Research Note 2013/1/4
Younger and older households in the crisis
Petra Gerlach-Kristen
This Note analyses how the financial crisis has affected younger and older households in Ireland. Using data from the Household Budget Survey, for which the Central Statistics Office has recently released the data collected in 2009/10, we examine how household consumption has responded and show that the financial crisis has affected younger households much more than older ones. We then go on to analyse why consumption of young households has declined so dramatically. The data show that unemployment, arrears and negative equity affect younger households more than older households. This may make it more difficult for them to smooth consumption.
Consumption
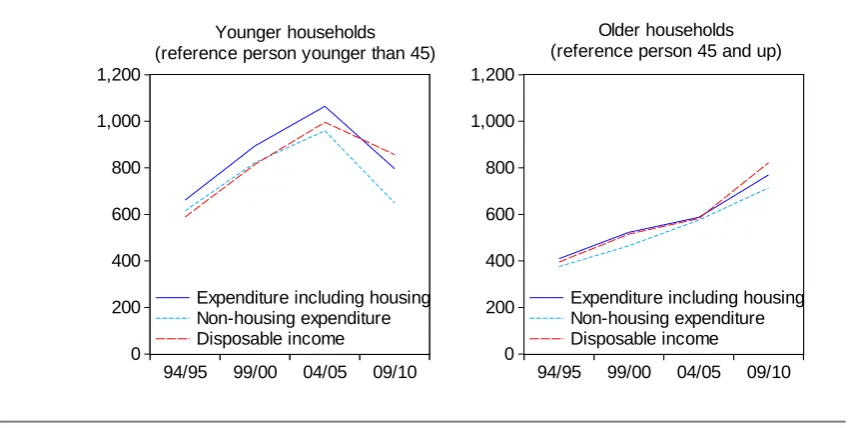
Figure 1 presents average weekly income and consumption for households with a head below 45 years of age in the left plot and for households with a head aged 45 and up in the right plot. By choosing a split at 45, we capture almost exactly half of the Irish households in each of the plots. The data cover the last four HBS waves and are inflation adjusted to the 2010 price level. We plot both expenditure including and excluding housing costs.
FIGURE 1 Weekly income and consumption by age group, 1994/95 to 2009/10
0 200 400 600 800 1,000 1,200
94/95 99/00 04/05 09/10 Expenditure including housing Non-housing expenditure Disposable income
Younger households (reference person younger than 45)
0 200 400 600 800 1,000 1,200
94/95 99/00 04/05 09/10 Expenditure including housing Non-housing expenditure Disposable income
Older households (reference person 45 and up)
[image:3.595.73.507.508.722.2]The contrast between the two population groups is striking. Income and consumption increase roughly steadily for the average household over the age of 45 from 1994/95 to 2009/10. To a certain extent, this increase is due to a rise in the average education level of older households. While in 1994/95, the average household reference person over the age of 45 had a primary school education only, by 2009/10 he/she had higher secondary education.1
In sharp contrast to the increase in earning and expenditure of older households over the last two decades, there has been a large drop in income and consumption for the younger average household in the crisis. Between the 2004/05 survey and that of 2009/10, real disposable income decreased by 14 per cent, real consumption including housing by 25 per cent and excluding housing by 32 per cent.
This decline in the consumption by young households is large, both by international standards and in a historical comparison.2 Also, the fact that
consumption has declined by more than income stands in contrast with standard economic theory, which predicts that consumption evolves more smoothly than income (see Friedman, 1957, on the permanent income hypothesis). If in a severe crisis permanent income expectations decline, consumption adjusts downwards.3
However, the drop of actual income in the crisis will virtually always be larger than the decline in permanent income. Consequently, consumption should decline less than actual income and be smoothed instead.
Theory offers two explanations for why households may not smooth consumption. First, they may not be able to access loans or have earlier savings that help them maintain consumption when income temporarily decreases. The literature refers to a household that finds access to bank finance impossible as facing credit constraints. Second, they may build up savings in anticipation of future problems in accessing credit. The literature calls these buffer-stock savings (see e.g. Deaton, 1991, and Carroll, 1992). These savings can be used either to finance future consumption or to reduce the likelihood of credit constraints binding in the future, for instance by deleveraging.
Credit constraints arise for households that represent a large risk for banks. For instance, banks will be hesitant to approve loans for households with a history of
1 Callan et al. (2013) examine the impact of the crisis on the Irish income distribution and also find that older households have suffered least. In part, this reflects that state social welfare pensions were not cut, whereas pay-cuts for active workers have been more common.
2 For an international comparison of declines in consumption during the crisis, see O’Connell et al. (2013).
3 It is possible that younger households, not having known earlier hardship, corrected their permanent income
Quarterly Economic Commentary – Spring 2013| 55
payment problems, i.e. households that have been in arrears. Households that have little collateral to offer, such as those in negative equity, also represent credit risk for banks. Finally, banks are cautious approving loans for households that have become unemployed but would like to avoid a major reduction in their consumption levels.
The question then is: Is the decline in consumption of younger households related to their being more exposed to unemployment, arrears and negative equity? This Note suggests that this seems to be the case. Gerlach-Kristen (2013) presents a formal analysis.
Unemployment
The Quarterly National Household Survey records for the period in which the 2009/10 HBS interviews were conducted an overall unemployment rate rising from 12.9 per cent to 14.1 per cent. The HBS provides data that allow a detailed analysis by household characteristics.
Figure 2 shows what fraction of households are affected by unemployment. We perform this analysis by household age and size and by whether the head or other household members are unemployed. The first two columns show the unemployment rate for single households by age group. Singles under the age of 45 had an unemployment rate of 14.2 per cent in 2009/10. The rate for older singles was less than half of that, namely 5.6 per cent. It is not surprising that younger individuals more often become unemployed, since they have less experience. Also, firms tend to lay off first those employees whom they hired last, who are typically younger than the average staff member.
FIGURE 2 Unemployment by age group and household size, 2009/10 HBS 0% 4% 8% 12% 16% 20% Younger households Older households P e rc e n ta g e o f h o u s e h o ld s a ff e c te d b y u n e m p lo y m e n t H o u s e h o ld w it h 1 g ro w n -u p , u n e m p lo y e d H o u s e h o ld w it h 2 g ro w n -u p s , re fe re n c e p e rs o n u n e m p lo y e d H o u s e h o ld w it h 2 g ro w n -u p s , o th e r u n e m p lo y e d H o u s e h o ld w it h 3 g ro w n -u p s , re fe re n c e p e rs o n u n e m p lo y e d H o u s e h o ld w it h 3 g ro w n -u p s , 1 o th e r u n e m p lo y e d H o u s e h o ld w it h 3 g ro w n -u p s , 2 o th e rs u n e m p lo y e d
Note: Analysis accounts for grossing factors capturing the representativeness of the individual households. n denotes the number of household members over the age of 13.
Overall, younger household reference persons are more likely to be unemployed than older heads. Since the head’s income in a household typically is the highest, his/her unemployment has in most cases the largest effect on a household’s finances. If credit constraints make a smoothing of consumption impossible and if there are no previous savings to draw down, the higher unemployment rate of young household reference persons may explain part of the drop in consumption for this population group. Moreover, if young households realise that they are particularly likely to become unemployed, buffer-stock savings to prepare for this eventuality reduce aggregate consumption further.
Arrears and negative equity
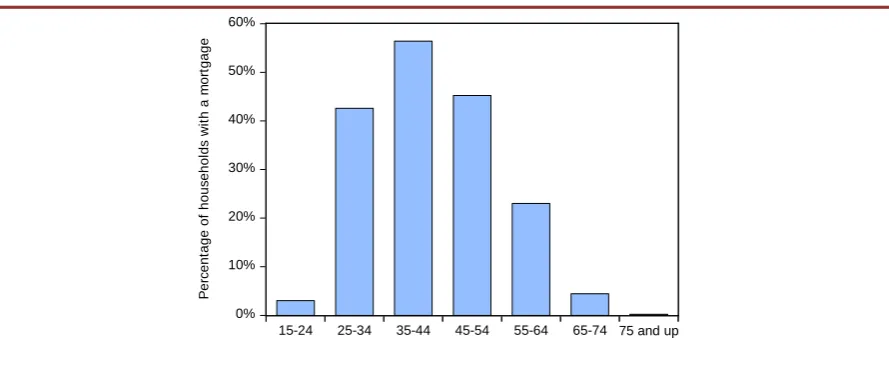
The collapse of Irish house prices has put mortgage households under pressure. Figure 3 helps gain a sense on how common mortgages are across age groups. Mortgages are most prevalent in the 35-44 year bracket, with more than half of households in this group having a mortgage. About 43 per cent of the households aged 25 to 34, and 45 per cent of those aged 45 to 54 are mortgage holders as well. There are few households in retirement age that have a mortgage.4 Given
4 The outstanding mortgage amount also is likely to differ by age group, with old households having paid back much of
[image:6.595.76.520.91.373.2]Quarterly Economic Commentary – Spring 2013| 57
this age profile, it seems likely that arrears and negative equity are concentrated in the younger part of the population as well.
FIGURE 3 Age profile of households with mortgages, 2009/10 HBS
0% 10% 20% 30% 40% 50% 60%
15-24 25-34 35-44 45-54 55-64 65-74 75 and up
P
e
rc
e
n
ta
g
e
o
f
h
o
u
s
e
h
o
ld
s
w
it
h
a
m
o
rt
g
a
g
e
Note: Analysis accounts for grossing factors capturing the representativeness of the individual households interviewed.
Kennedy and McIndoe Calder (2011) report for the end of 2010 a 30-days arrears rate of 12.3 per cent. The HBS questionnaire does not ask interviewees if they are in mortgage arrears. However, it asks mortgage households how large a mortgage payment they made in the month of the HBS interview. By construction, mortgage households that made no payment are in arrears. However, the measure of arrears constructed this way does not capture households that made only a partial payment or those that paid in the interview month but not earlier. This approach therefore underestimates the incidence of arrears.
[image:7.595.78.523.151.337.2]FIGURE 4 Age profile of mortgage households in arrears, 2009/10 HBS
0% 1% 2% 3% 4% 5% 6% 7%
15-24 25-34 35-44 45-54 55-64 65-74 75 and up
P
e
rc
e
n
ta
g
e
o
f
m
o
rt
g
a
g
e
h
o
u
s
e
h
o
ld
s
i
n
a
rr
e
a
rs
Note: Arrears capture only mortgage households that made no mortgage payment at all in the interview month. Analysis accounts for grossing factors capturing the representativeness of the individual households interviewed.
It is possible that the high incidence of arrears among young households is related to unemployment.5 Households get mortgages while in work and typically
assuming constant or growing incomes. If the household reference person loses his/her job, the mortgage payments often exceed income, and arrears result. Gerlach-Kristen (2013) shows that large pay-cuts, which again may mainly affect younger individuals that are less established in their job more than older staff, also can cause arrears. Compatible with this, McCarthy and McQuinn (2011) find that the mortgage repayment-to-income ratio is particularly high for young households.
Is negative equity more common among young households, too? Kennedy and McIndoe Calder (2011) report that 30.6 per cent of all mortgage holders were in negative equity at the end of 2010. The HBS does not contain a variable capturing negative equity, but Duffy and O’Hanlon (2013) analyse data from the Census 2011 by household age. Figure 5 replicates their numbers, which use a slightly different definition of age brackets. It can be seen that negative equity is most common for households in the under 30 bracket, followed by those aged between 30 and 39.
The finding that young households are most likely to be in negative equity is not surprising given that households that purchase a house/apartment tend to be young and that the fall in prices affects those households first that bought most recently.
5 Central Bank of Ireland (2012) shows in Box 6 that households in arrears are more often unemployed than those that
Quarterly Economic Commentary – Spring 2013| 59
FIGURE 5 Age profile of mortgage households in negative equity, from Duffy and O’Hanlon (2013)
0% 10% 20% 30% 40% 50%
under 30 30-39 40-49 50-59 60 and up
P
e
rc
e
n
ta
g
e
o
f
m
o
rt
g
a
g
e
h
o
u
s
e
h
o
ld
s
i
n
n
e
g
a
ti
v
e
e
q
u
it
y
Note: Negative equity estimates by age group, from Duffy and O’Hanlon (2013), derived from Census 2011 data. Conclusions
Households typically smooth consumption. This means that they try to maintain their standard of living if income declines temporarily. Even if longer-term income expectations decline, consumption does normally not decrease by more than income. However, young households in Ireland dramatically reduced their consumption below income after the onset of the financial crisis.
This Note shows that this drop in consumption stands in contrast to the experience of older households, whose average expenditure did not decline. Younger and older households earned and spent about the same sums in 2009/10. While some of this may represent a natural convergence given the rise in average education levels of the older half of the population, we argue that it is also due to young households facing credit constraints and building up savings in anticipation of these. In particular, credit constraints are likely to bind for households that are unemployed, in arrears or in negative equity. Using household budget data, we construct age profiles and show that young households are indeed more likely to be facing credit constraints than older ones.
best address the disproportionate impact the crisis has had on Ireland’s young households.
References
Callan, Tim, Brian Nolan, Clare Keane, Michael Savage and John R. Walsh (2013), Crisis, response and distributional impact: The case of Ireland, ESRI Working Paper 456. Carroll, Christopher (1992), The buffer-stock theory of saving: some macroeconomic
evidence, Brookings Papers on Economic Activity 2, 61-156. Central Bank of Ireland (2012), Macro-Financial Review, 2012:II.
Deaton, Angus (1991), Saving and liquidity constraints, Econometrica 59(5), 1221-1248. Duffy, David and Niall O’Hanlon (2013), Negative equity in the Irish housing market:
Estimates using loan level data, mimeo.
Friedman, Milton (1957), A theory of the consumption function, Princeton: Princeton University Press.
Gerlach-Kristen (2013), The effect of unemployment, arrears and negative equity on consumption: Ireland in 2009/10, ESRI Working Paper 457.
Kennedy, Gerard and Tara McIndoe Calder (2011), The Irish mortgage market: Stylised facts, negative equity and arrears, Central Bank of Ireland Research Technical Paper 12/RT/11.
McCarthy, Yvonne and Kieran McQuinn (2011), How are Irish households coping with their mortgage repayments? Information from the Survey on Income and Living Conditions, The Economic and Social Review 42(1), 71–94.