R E S E A R C H A R T I C L E
Open Access
TLR2 stimulation impairs anti-inflammatory
activity of M2-like macrophages, generating
a chimeric M1/M2 phenotype
Lilian Quero
1,2*, Edveena Hanser
1,2, Tobias Manigold
1,2, André N. Tiaden
1,2and Diego Kyburz
1,2Abstract
Background:Toll-like receptors (TLRs) and macrophages play an important role in rheumatoid arthritis (RA). Currently, it is not clear whether inflammatory M1 or anti-inflammatory M2 predominate among the resident macrophages in the synovium. In the present study, we set out to investigate the impact of TLR stimulation on monocyte-derived M1 and M2 macrophage function and phenotype by mimicking the exposure to abundant TLR agonists as occurs in the context of RA. The response of macrophage subsets to TLR2 and TLR4 activation was evaluated on cluster of differentiation (CD) marker profile; cytokine secretion; gene expression; and NF-κB, interferon regulatory factors 3 and 7 (IRF3/7), and mitogen-activated protein kinase (MAPK) activation.
Methods:Human monocytes were isolated from peripheral blood of healthy individuals and patients with RA and differentiated into M1-like and M2-like macrophages by granulocyte-macrophage colony-stimulating factor (GM-CSF) and macrophage colony-stimulating factor (M-CSF), respectively. Cells were either (1) stimulated with TLR ligands Pam3 or lipopolysaccharide (LPS) or (2) classically activated via interferon (IFN)-γ/LPS. Cytokine production was measured by enzyme-linked immunosorbent assay, and gene expression was measured by qPCR. Cells were stained for CD markers and analyzed by fluorescence-activated cell sorting. NF-κB, IRF3/7, and MAPKs were detected by Western blotting.
Results:Monocyte-derived macrophages of healthy donors (HD) or patients with RA displayed comparable subset-specific phenotypes upon exposure to TLR agonists. CD14 and CD163 marker expression on M2 macrophages did not
change upon TLR2 and TLR4 engagement. By contrast, M2 gene markersHMOX1,FOLR2, andSLC40A1were decreased.
Importantly, M2 macrophages derived from HD or patients with RA showed both a decreased ratio of interleukin (IL)-10/IL-6 and IL-10/IL-8 upon stimulation with TLR2 ligand Pam3 compared with TLR4 ligand LPS. Gene expression of TLR2 was increased, whereas TLR4 expression was decreased, by TLR ligand stimulation. MAPKs p38, extracellular signal-regulated kinase 1/2, and c-Jun N-terminal kinase were activated more strongly in M2 than in M1 macrophages by Pam3 or LPS.
Conclusions:We show that the anti-inflammatory activity of M2 macrophages is reduced in the presence of abundant TLR2 ligands without significant changes in cell surface markers. Thus, the classical M1/M2 paradigm based on cellular markers does not apply to macrophage functions in inflammatory conditions such as RA.
Keywords:TLRs, Monocytes, Macrophages, Cytokines, Gene expression, CD markers, NF-κB, MAPKs, IRF3/7, Rheumatoid arthritis
* Correspondence:[email protected]
1Experimental Rheumatology, University Hospital Basel, Basel, Switzerland 2Department of Biomedicine, University of Basel, Petersplatz 10, 4051 Basel,
Switzerland
Background
Rheumatoid arthritis (RA) is characterized by synovial inflammation [1] as well as the production of autoanti-bodies such as rheumatoid factor and antiautoanti-bodies against self-proteins (anticitrullinated peptide antibodies [ACPA]) that underwent citrullination, a posttranslational modifi-cation generated by the peptidylarginine deiminase [2]. The synovial tissue in inflamed joints undergoes hyperpla-sia and forms the so-called pannus [3]. It is well described that activated synovial fibroblasts within the pannus strongly contribute to inflammation and tissue dege-neration [4–6]. Furthermore, there is an infiltration of immune cells, such as B cells, T cells, dendritic cells, and macrophages, into the synovium. These activated in-flammatory cells produce cytokines, chemokines, matrix metalloproteinases (MMPs), and osteoclast-promoting factors [7–9], resulting in perpetuation of the inflam-mation, cartilage damage, and bone destruction that are characteristic of RA.
Toll-like receptors (TLRs) have been shown to con-tribute to the inflammatory response in RA [10, 11]. A few TLRs (TLR2, TLR3, TLR4) have been found to be upregulated in synovial tissue in RA [12] but not in osteoarthritis [13, 14] or in synovial versus peripheral monocytes from patients with RA [15]. Upregulation of TLR2 and TLR4 has been demonstrated in synovial macrophages from patients with RA but not in monocyte-derived macrophages from healthy donors (HD) [16]. Synovial macrophages from patients with RA
also showed increased tumor necrosis factor (TNF)-α
and interleukin (IL)-8 expression, mediated through TLR2 and TLR4, compared with macrophages from pa-tients with other forms of inflammatory arthritis.
Granulocyte-macrophage colony-stimulating factor
(GM-CSF) and macrophage colony-stimulating factor (M-CSF) expression are known to be upregulated at sites of inflammation and autoimmunity [17], and both are in-creased in synovial fluid (SF) of patients with RA. Speci-fically, elevated levels of TNF-αand IL-1βin patients with RA can promote the production of GCSF as well as M-CSF by synovial fibroblasts and chondrocytes [17–19]. Several studies and reports have demonstrated that GM-CSF-, interferon (IFN)-γ-, lipopolysaccharide (LPS)-, and TNF-α-differentiated monocytes display inflammatory M1 properties, whereas M-CSF, immunoglobulin G (IgG), IL-10, IL-4, and IL-13 lead to anti-inflammatory M2 macro-phages [20, 21]. Furthermore, cluster of differentiation 14 (CD14) and CD163 [20] as well as gene markers such
as heme oxygenase 1 (HMOX1), folate receptor β
(FOLR2), or solute carrier family 40 member 1 (SLC40A1) characterize anti-inflammatory M2 macro-phages [22, 23]. Resident macromacro-phages in RA were shown to exhibit a more M1-like proinflammatory ac-tivity; however, they also express M2 markers such as
CD163 or HMOX1[24, 25]. Hence, it remains unclear
whether classical M1 or M2 or an as yet undefined macrophage population predominates numerically and functionally in RA [19, 26, 27]. The process of M1 and M2 polarization displays a high grade of plasticity [28], and the phenotype and activation state of polarized macrophages can be altered in a special local micro-environment or can even be reversed under patho-physiological conditions. In our study, we aimed at assessing the functional plasticity of conventional macrophage subsets under inflammatory conditions usually present in RA, such as abundant TLR ligands in synovia as a result of increased tissue damage [1]. We
therefore investigated “naive” monocytes from
peri-pheral blood of healthy individuals or patients with RA and differentiated them into M1-like and M2-like mac-rophages in vitro by using GM-CSF or M-CSF, respect-ively. These polarized macrophage populations were then challenged with different TLR ligands (Pam3, LPS) and compared with classical cytokine activation via IFN-γ/LPS. To evaluate the functional and phenotypical reaction of the generated M1 and M2 subsets on TLR stimulation, we assessed cytokine release, expression of characteristic gene markers, and alteration in cell sur-face markers.
We report that TLR2 engagement impairs the anti-inflammatory activity of M2-like macrophages derived from healthy or RA monocytes without changing the ex-pression profile of the conventional M2 cell surface markers CD14 and CD163, but altering the expression
of M2-specific gene markers HMOX1, FOLR2, and
SLC40A1toward an M1-specific profile. Thus, our study implies the emergence of a “chimeric” M2 subset that exerts decreased anti-inflammatory functions and pos-sibly even constitutes a factor that promotes the inflam-matory conditions in a disease setting such as RA.
Methods
Isolation, in vitro differentiation, and stimulation of monocytes and monocyte-derived macrophages
standard medium [RPMI 1640, 10% FCS, 1% glutamine, 1% antibiotics, 1% 4-(2-hydroxyethyl)-1-piperazineetha-nesulfonic acid (HEPES)] in the presence of 50 ng/ml GM-CSF or M-CSF (PeproTech, Hamburg, Germany), respectively, for 8–10 days. Freshly prepared GM-CSF
and M-CSF medium was added every 2–3 days. For
M0, CD14+ separated cells were either directly
proc-essed for surface marker staining or kept in standard
medium for 1–3 days for subsequent TLR stimulation
experiments. Stimulation of cells was performed for
24 h with 300 ng/ml Pam3CysSerLys4 (Pam3),
100 ng/ml LPS, or 10 μg/ml polyinosinic-polycytidylic acid [poly(I:C)] (all from InvivoGen, San Diego, CA,
USA). We used IFN-γ/LPS (20 ng/ml and 100 ng/ml,
respectively; PeproTech) as a macrophage activation control.
Fluorescence-activated cell sorting analysis
After stimulation, cells were washed once with cold fil-tered PBS/0.5% bovine serum albumin (fluorescence-ac-tivated cell sorting [FACS] buffer) and stained with fluorescently labeled antibodies CD14-allophycocyanin-cyanine 7 (APC-Cy7), CD163-fluorescein isothiocyanate (FITC), CD206-BV421, CD86-phycoerythrin (PE), and
CD80-FITC (all from BD Biosciences, Allschwil,
Switzerland) for 30 minutes on ice in the dark. Cells were then washed three times with FACS buffer and fixed with 1% formaldehyde in FACS buffer. Cells were analyzed by FACS (BD Fortessa; BD Biosciences, San Jose, CA, USA) using FlowJo software (FlowJo, Ashland, OR, USA) for analysis. Results are presented as either the percentage of positive stained cells among the total cell population or as mean fluorescence intensity (MFI), calculated as ΔMFI = MFIspecific surface marker−MFI
corre-sponding unstained control and normalized to the basal MFI
of unstained control cells.
Gene expression
Monocytes (M0) or M1- and M2-differentiated macro-phages were cultured in 24- or 48-well plates with 270,000 cells/well or 150,000 cells/well, respectively, and stimulated as described above. RNA was isolated using the miRNeasy Micro kit (Qiagen, Hilden, Germany), and 1μg total RNA was reverse-transcribed with the RealM-asterScript SuperMix Kit (5Prime GmbH, Hilden,
Germany). Gene expression of TLR2, TLR3, TLR4,
HMOX1, FOLR2, and SLC40A1 was measured by qRT-PCR using TaqMan StepOnePlus (Applied Biosystems/ Thermo Fisher Scientific, Foster City, CA, USA). Values
were normalized to ubiquitin C (UBC) or TATA-box
binding protein (TBP) messenger RNA (mRNA) levels
and are presented as 2−ΔCT.
Enzyme-linked immunosorbent assay
Cells were cultured in either 48- or 96-well plates with either 150,000 cells/well or 50,000 cells/well, respect-ively. After stimulation, supernatants were collected and cytokine, chemokine, and MMP3 release was measured by enzyme-linked immunosorbent assay (ELISA) (IL-6, IL-8, IL-1β, and TNF-αELISAs, eBioscience, San Diego, CA, USA; MMP3 ELISA, R&D Systems, Minneapolis, MN, USA). Values are presented either as concentration in picograms per milliliter or as a ratio.
Western blot analysis
Monocytes (4 × 10⁶) were cultured in 60 × 15-mm dishes under M1- or M2-like differentiation conditions as de-scribed above and stimulated either (1) for 1 h to assess nuclear shuttling of NF-κB and interferon regulatory fac-tors 3 and 7 (IRF3/7) or (2) for 30 minutes for mitogen-activated protein kinase (MAPK) phosphorylation detec-tion. Whole-cell protein extracts were isolated by adding
300 μl of lysis buffer containing 50 mM HEPES
(pH 7.5), 450 mM NaCl, 15% glycerol, 2 mM ethylenedi-aminetetraacetic acid, 1 mM phenylmethylsulfonyl fluor-ide (PMSF), and freshly added protease/phosphatase inhibitor cocktail (Cell Signaling Technology, Danvers, MA, USA). Protein was harvested by incubation on a roller shaker for 10 minutes and subsequent centrifuga-tion for 30 minutes at 14,000 rpm. For nuclear extrac-tion, cells were washed with cold PBS and lysed with lysis buffer containing 10 mM HEPES (pH 7.9), 1.5 mM
MgCl2, 10 mM KCl, 1 mM PMSF, 5 mM dithiothreitol
(DTT), and 0.1% IGEPAL (Sigma-Aldrich, Buchs, Switzerland) with freshly added protease/phosphatase inhibitor cocktail for 5 minutes on ice. Nuclear pellets were harvested after centrifugation at 10,000 rpm for 5 minutes at 4 °C and lysed for 20 minutes in buffer
containing 20 mM HEPES (pH 7.9), 1.5 mM MgCl2,
420 mM NaCl, 25% glycerol, 1 mM PMSF, and 5 mM DTT with freshly added protease/phosphatase inhibitor cocktail. Protein concentrations were determined using Coomassie Plus Protein Assay reagent (Thermo Fisher Scientific, Rockford, IL, USA). Equal amounts of protein were loaded onto 12% sodium dodecyl sulfate-PAGE gels and transferred onto PVDF membranes (Bio-Rad La-boratories AG, Cressier, Switzerland). Membranes were incubated over night at 4 °C with either rabbit anti-p38, rabbit phospho-p38 (Thr180/Tyr182), mouse anti-extracellular signal-regulated kinase 1/2 (anti-ERK1/2), rabbit anti-phospho-ERK1/2 (Thr202/Tyr204), rabbit anti-stress-activated protein kinase (SAPK)/c-Jun N-terminal kinase (JNK), rabbit anti-phospho-SAPK/JNK
(Thr183/Tyr185), mouse anti-NF-κB p65, rabbit
Tween; ROTH AG, Arlesheim, Switzerland) for 10 mi-nutes, membranes were incubated for 1 h with secondary goat anti-rabbit IgG IR800 antibody or goat anti-mouse IgG IR700 antibody (all 1:10,000; Azure Biosystems, Dublin, CA, USA) and washed again three times for 10 -minutes with TBS-T and additionally for 5 -minutes with TBS before analysis. Fluorescence was detected using an Odyssey CLx imaging system (LI-COR Biosciences GmbH, Bad Homburg vor der Höhe, Germany).
Statistical analysis
All statistical analyses were carried out using Prism 7 software (GraphPad Software, La Jolla, CA, USA). Data distribution was first assessed for normality using the Kolmogorov-Smirnov test. Parametric analysis of nor-mally distributed data was performed by ordinary
one-way analysis of variance (ANOVA) using Dunnett’s
multiple comparisons test. Nonparametric data were
analyzed using the Kruskal-Wallis test with Dunn’s
multiple comparisons test. Multiple-group analysis was carried out by ordinary two-way ANOVA using the Holm-Sidak multiple comparisons test. Apvalue < 0.05 was considered statistically significant. All data are pre-sented as mean ± SD.
Results
Expression profile of surface markers on M0, M1-, and M2-polarized macrophages following TLR ligand exposure and activation
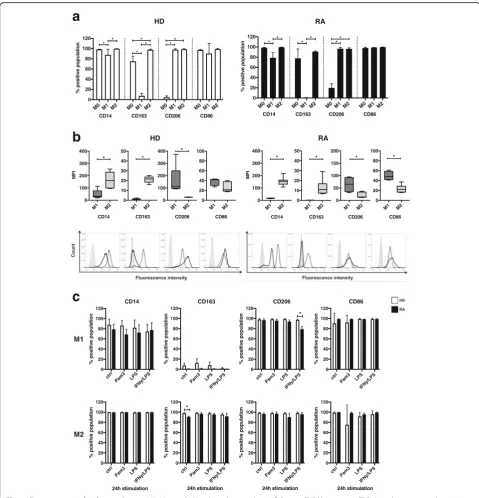
We first assessed surface maker expression on freshly isolated monocytes and monocyte-derived M1 and M2 macrophages from peripheral blood of HD and patients with RA. To generate human M1-like and M2-like mac-rophages in vitro, we applied a well-established method by differentiating macrophages from peripheral mono-cytes in the presence of GM-CSF or M-CSF, respectively [23, 25, 29–32]. The phenotypical analysis confirmed that the generated M1 and M2 populations express dis-tinct subset-specific surface marker profiles. These pat-terns were comparable in the cells derived from blood of HD or patients with RA (Fig. 1a,leftversus right panel, and Additional file 1) Higher CD14 levels and the ex-pression of CD163 have been reported to represent anti-inflammatory M2 macrophages [20]. In our experimental setup, M-CSF-differentiated M2 macrophages from both conditions displayed positive CD14 and CD163 expres-sion, whereas GM-CSF-differentiated M1 macrophages exhibited significantly lower CD14 levels and expressed hardly any CD163. CD206 was previously described as a marker of differentiated M2 macrophages [33], but, in line with other studies [34, 35], it is also expressed on GM-CSF-polarized M1 macrophages. In contrast, freshly
isolated monocytes exhibited only low CD206
expression, though M0 from patients with RA showed higher levels than that from HD. CD86 and CD80 were reported to be present on cytokine-activated M1 [21]. However, in accordance with another study [29], the GM-CSF/M-CSF differentiation method resulted in M2 macrophages that expressed CD86 to a similar degree as M1 or M0, whereas CD80 expression was barely de-tected in the three tested cell types (data not shown).
A more detailed investigation of individual surface marker expression on M1 and M2 by quantification of signal intensity using MFI measurements (Fig. 1b, upper
andlower panels) also demonstrated comparable profiles in cells derived from HD or patients with RA (Fig. 1b,
left versusright panels). This analysis substantiated that GM-CSF-differentiated M1 macrophages expressed sig-nificantly lower levels of CD14 than M2, as described elsewhere [36]. In addition, the MFI values also revealed not only that CD206 was expressed on both polarized subsets (M1 and M2) but also that its expression levels were initially higher in M1 than in M2 macrophages, whereas CD86 showed higher expression on M1 than on M2 (Fig. 1b,upperandlower panels).
Next, we wanted to study the phenotypical profile of M1 and M2 macrophages in the context of inflammatory conditions such as RA. We therefore analyzed the sur-face marker expression upon TLR stimulation or
treat-ment with IFN-γ/LPS for 24 h. Importantly, the
stimulation of M1 and M2 subsets with TLR ligands for 24 h did not significantly alter the proportion of posi-tively stained cells for all surface markers tested (Fig. 1c). Again, there were no significant differences in the dis-tinct M1 and M2 subsets derived from HD compared with patients with RA regarding the surface marker pro-files upon TLR treatment (Fig. 1c). Thus, TLR2 stimula-tion by Pam3 did not significantly change the classical surface marker profile of M2 macrophages. In addition, the MFI representing the quality and amount of CD14-and CD163-positive staining was not significantly af-fected by TLR2 engagement in M2 macrophages from HD and patients with RA, thereby confirming the sus-tained integrity of the anti-inflammatory M2 cell surface phenotype (Additional file 2). In contrast, TLR4 ligand LPS or activation by IFN-γ/LPS showed a trend toward lower MFI of M2-polarized markers CD14, CD163, and CD206 while increasing the signal for M1-specific marker CD86, thus underlining the role of CD86 as a marker of
“activated”M1 macrophages (Additional file 2).
Change of characteristic anti-inflammatory M2 gene
markersHMOX1,FOLR2, andSLC40A1following TLR
ligand exposure and activation
a
b
c
M0M1M2 M0M1M2 M0M1M2 M0M1M2
0 20 40 60 80 100 120 % p ositive populat ion
CD14 CD163 CD206 CD86
* * ** **
*
M0M1M2 M0M1M2 M0M1M2 M0M1M2
0 20 40 60 80 100 120 %p o si ti ve po pul a ti on
CD14 CD163 CD206 CD86
* * * * **
M1 M2
0 100 200 300 400 CD14 MFI *
M1 M2 0 20 40 60 80 100 CD86 M1 M2
0 10 20 30 40 50 CD163 *
M1 M2 0 100 200 300 400 CD206 * M1 M2 RA HD RA HD
CD14 CD163 CD206 CD86
M1 M2
0 100 200 300 400 CD14 M F I *
M1 M2
0 20 40 60 80 100 CD86 *
M1 M2
0 10 20 30 40 50 CD163 *
M1 M2
0 50 100 150 200 CD206 * ctrl Pam3 LP
S IFNy /LP S 0 20 40 60 80 100 120 % positiv e pop u lati on ctrl Pam 3 LP S IFN y/LP S 0 20 40 60 80 100 120 24h stimulation % p ositive p op ulat ion ctrl Pam 3 LPS IFNy /LP S 0 20 40 60 80 100 120 %p o s it iv e popu lation ctrl Pam3 LP
S IFN y/LP S 0 20 40 60 80 100 120 24h stimulation % p o s itive popu lation ctrl Pam 3 LPS IFNy /LP S 0 20 40 60 80 100 120 %p o s itiv e popu lati o n ctrl Pam 3 LP S IFN y/LP S 0 20 40 60 80 100 120 24h stimulation %p o s it iv ep opu lat ion ctrl Pam 3 LPS IFN y/LP S 0 20 40 60 80 100 120 % p o s itive p opu lation ctrl Pam3 LP
S IFN y/LP S 0 20 40 60 80 100 120 24h stimulation % p o s itive popu lation * *
Fig. 1Characterization of surface markers on M0, M1-, and M2-polarized macrophages following Toll-like receptor (TLR) ligand exposure and activation.
For phenotypical analysis, M0 (ex vivo monocytes), M1-like (GM-CSF-differentiated), and M2-like (M-CSF-differentiated) macrophages derived from peripheral blood of healthy donors (HD) or patients with rheumatoid arthritis (RA) were stained for fluorescence-activated cell sorting analysis with fluorescently labeled antibodies CD14-allophycocyanin-cyanine 7 (APC-Cy7), CD163-fluorescein isothiocyanate (FITC), CD206-BV421, CD86-phycoerythrin (PE), and CD80-FITC.aComparison of surface marker expression on freshly isolated M0- versus M1- versus M2-differentiated macrophages from HD and patients with RA presented as the percentage of positively stained cell populations.bQuality of surface marker expression in M1- versus M2-differentiated macrophages from HD and patients with RA was analyzed by mean fluorescence intensity (MFI) and presented as a box plot (upper panel) and with representative histograms (lower panel;light gray area= unstained cells,dark full line= M1,dotted line= M2). MFI was calculated asΔMFI = MFIspecific surface marker−MFIcorresponding unstained controland normalized to the basal MFI of unstained control cells.
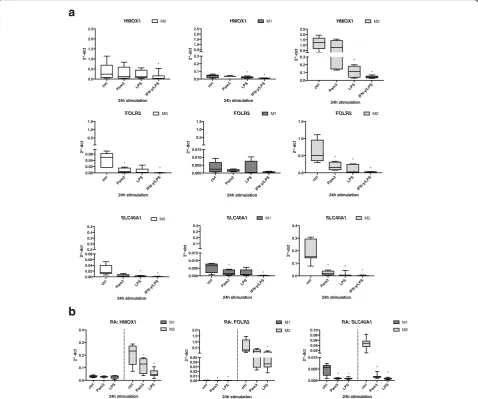
[image:5.595.57.537.86.585.2]In our experimental system, we confirmed upregulated
gene expression ofHMOX1,FOLR2, andSLC40A1in M2
compared with M1 derived from both HD and patients with RA (Additional file 3). Next, we investigated whether TLR stimulation had an effect on the expression profile of these gene markers in M1 and M2 macrophages (Fig. 2a). We observed that activation of TLR2 with Pam3 led to a
significant downregulation of FOLR2 and SLC40A1 gene
expression in M2 macrophages, whereas expression of
HMOX1 was only mildly reduced in M2 (Fig. 2a, right panel). Remarkably, TLR4 stimulation with LPS or activa-tion with IFN-γ/LPS also significantly downregulated
HMOX1, FOLR2, and SLC40A1 gene expression after 24 h. Finally, TLR activation or cytokine stimulation in M0 or M1 (Fig. 2a,leftandmiddle panels) showed an ex-pression pattern of the tested genes similar to that in M2, though their basal expression levels were low or at the limit of detection (Additional file 3). We also tested the observed suppression of these marker genes in M1 and M2 macrophage subsets derived from peripheral blood monocytes of patients with RA. The results showed a comparable gene expression profile and downregulation ofHMOX1,FOLR2, andSLC40A1by TLR2 and TLR4 li-gands as the HD cells (Fig. 2b).
a
b
ctrl Pam 3 LPS IFN -y/LP S 0.0 0.5 1.0 1.5 2.0 2.5 24h stimulation 2 ^-d c t HMOX1 M0 * ctrl Pam 3 LPS IFN -y/L PS 0.0 0.1 0.2 0.3 0.5 1.0 1.5 2.0 2.5 24h stimulation 2^ -dc t HMOX1 * M1 * ctrl Pam 3 LPS IFN -y/L PS 0.0 0.1 0.2 0.3 0.5 1.0 1.5 2.0 2.5 24h stimulation 2^ -d c t HMOX1 M2 * * ctrl Pam 3 LPS IFN -y/L PS 0.00 0.02 0.04 0.06 0.5 1.0 1.5 24h stimulation 2 ^-dc t FOLR2 * M0 * ctrl Pam 3 LPS IFN -y/L PS 0.000 0.005 0.010 0.015 0.5 1.0 1.5 24h stimulation 2^ -d ct FOLR2 M1 ctrl Pam 3 LPS IFN -y/L PS 0.0 0.5 1.0 1.5 24h stimulation 2^ -d c t FOLR2 * * M2 * ctrl Pam 3 LPS IFN -y/L PS 0.00 0.02 0.04 0.06 0.08 0.2 0.3 0.3 0.4 0.4 24h stimulation 2^ -d c t SLC40A1 M0 * * ctrl Pam 3 LPS IFN -y/LP S 0.000 0.005 0.010 0.015 0.1 0.2 0.3 0.4 24h stimulation 2^ -d ct SLC40A1 M1 * * ctrl Pam 3 LPS IFN -y/L PS 0.0 0.1 0.2 0.3 0.4 24h stimulation 2^ -d ct SLC40A1 M2 * * * ctrl Pam 3 LPS ctrlPam 3 LPS 0.000 0.005 0.010 0.02 0.04 0.06 0.08 0.10 24h stimulation 2 ^-d ct
RA: SLC40A1 M1
M2 * * * * ctrl Pam 3 LPS ctrl
Pam 3 LPS 0.0 0.1 0.2 0.3 0.4 24h stimulation 2 ^ -dc t
RA: HMOX1 M1
M2 * * ctrl Pam 3 LP S ctrl Pam 3 LPS 0.00 0.01 0.02 0.03 0.04 0.05 0.5 1.0 1.5 2.0 24h stimulation 2^ -d c t
RA: FOLR2 M1
M2
* *
*
Fig. 2Change of characteristic anti-inflammatory M2 gene markers following Toll-like receptor ligand exposure and activation.aM0 (monocytes),
M1 (GM-CSF-differentiated), and M2 (M-CSF-differentiated) macrophages were stimulated for 24 h with 300 ng/ml Pam3, 100 ng/ml lipopolysaccharide (LPS), or a combination of interferon (IFN)-γ/LPS (20 ng/ml and 100 ng/ml). Change in gene expression of M2 markersHMOX1,FOLR2, andSLC40A1
[image:6.595.59.538.264.663.2]In summary, these results indicate that TLR2, and to a higher degree TLR4, ligands are able to change the anti-inflammatory M2 gene markers toward an M1-specific expression phenotype.
Changes in cytokine secretion profile of M0, M1-, and M2-polarized macrophages following TLR ligand exposure and activation
Previous studies have shown preferential secretion of proinflammatory cytokines by M1 (TNF-α, IL-1β, IL-6, IL-8) and secretion of anti-inflammatory cytokines (e.g., IL-10) by M2 macrophages upon activation [21]. Our experiments confirmed an increased secretion level of
the proinflammatory cytokine TNF-α by M1 compared
with M0 and M2 following stimulation with TLR li-gands or activation with IFN-γ/LPS (Fig. 3a). As ex-pected, M1 macrophages stimulated with TLR ligands Pam3, LPS, or IFN-γ/LPS secreted IL-1β, IL-6, and IL-8 but hardly any anti-inflammatory 10. In contrast, IL-10 was abundantly produced by M2 in response to TLR
ligands and IFN-γ/LPS, thereby confirming the
anti-inflammatory response of M2 macrophages upon acti-vation. Unexpectedly, stimulation of M2 macrophages with Pam3, but not with LPS, strongly induced the pro-duction of proinflammatory cytokines IL-1β, IL-6, and IL-8. As a consequence, the ratio of IL-10 to IL-6 or IL-8, an indicator of an anti-inflammatory cytokine pro-file, was significantly decreased in M2 macrophages by Pam3 stimulation as compared with LPS stimulation (Fig. 3b,open bars). The same result was obtained with M1 and M2 macrophages derived from blood of pa-tients with RA (Fig. 3b,black bars). Because proteolytic pathways have a critical function in RA development, we were interested in MMP3 secretion upon TLR lig-and stimulation in M1 lig-and M2 macrophages derived from blood of HD or patients with RA. We found that TLR2 engagement, but not TLR4, induced a significant MMP3 release only in M2 and not in M0 or M1 (Fig. 3a, Additional file 4).
Therefore, our results indicate that TLR2 engagement in M2 macrophages led to impaired anti-inflammatory activity based on the secretion profile of anti- versus proinflammatory cytokines and might be a source of ele-vated MMP3 levels found in the pannus and synovium of patients with RA [37].
TLR2andTLR4gene expression in M0, M1-, and
M2-polarized macrophages following TLR ligand exposure
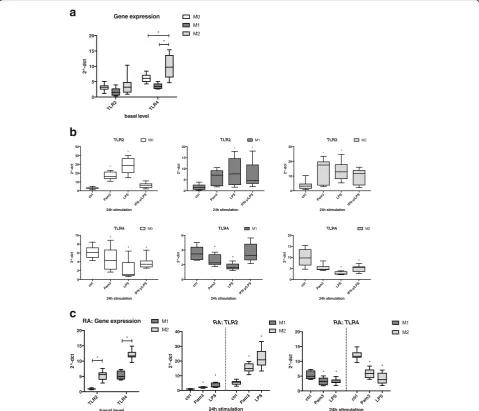
Next, we investigated the changes in TLR2 and TLR4
gene expression in M0, M1, and M2 upon stimulation
with TLR ligands. The basal gene expression of TLR2
did not significantly differ between the cell types,
whereas TLR4 was expressed at a higher level in M2
than in M1 or M0 (Fig. 4a). Interestingly, TLR2 was
upregulated by Pam3 and LPS in M0, M1, and M2. By
contrast, TLR4 was downregulated by LPS in all three
cell types (Fig. 4b). As with the previous measurements regarding surface and gene markers or cytokine pro-files, we basically found the same tendencies for TLR2
and TLR4 expression in macrophages generated from
monocytes of patients with RA as those in cells of HD and treated with TLR ligands (Fig. 4c). Interestingly, and in contrast to HD macrophages, the basal gene ex-pression level of TLR2 in RA-derived M2 macrophages was significantly higher than in M1. Taken together, stimulation of M1 and M2 macrophages with TLR
li-gands Pam3 and LPS resulted in upregulation of TLR2
gene expression but downregulation ofTLR4.
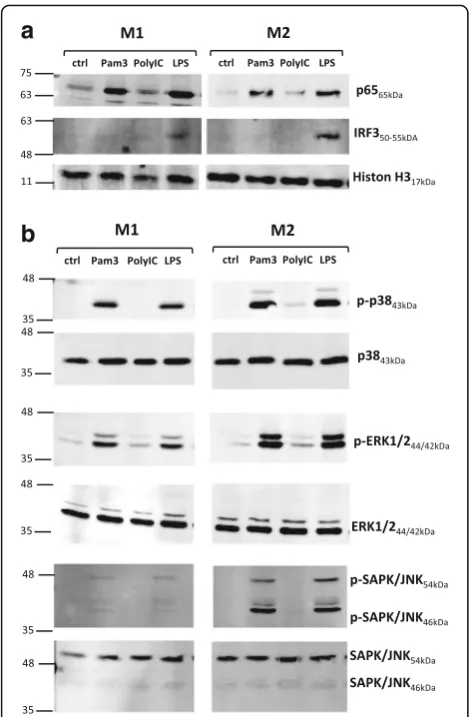
NF-κB, MAPK, and IRF3 activation in M1- and M2-polarized macrophages following TLR ligand exposure To investigate the underlying cause of the different cyto-kine secretion profiles in M2 versus M1, we assessed the ability of two different TLR ligands, Pam3 and LPS, to activate NF-κB, IRF3/7, and MAPK pathways in the two macrophage subsets. We performed Western blotting experiments and compared nuclear shuttling of p65 and IRF3/7 as well as phosphorylation of MAPKs p38, ERK1/2, and JNK following stimulation for 30 minutes or 1 h. In concordance with a previous study [38], stimulation of TLR3 by poly(I:C) did not alter NF-κB or MAPK activation in macrophages. We also found that poly(I:C) stimulation showed no significant effect on the tested surface marker expression and cytokine produc-tion (data not shown). We therefore used TLR3 engage-ment by poly(I:C) as ligand control.
a
b
M1 Pam 3 M1 LPS M2 Pam 3 M2 LPS M1 Pam3 M1 LPS M2 Pam 3 M2 LPS 0 5 10 15 20 25 24h stimulation rat io IL-10/IL-6 HD RA * * M1 Pam 3 M1 LPS M2 Pam 3 M2 LPS M1 Pam 3 M1 LPS M2 Pam 3 M2 LPS 0.0 0.5 1.0 1.5 24h stimulation ratio IL-10/IL-8 HD RA * * ctrl Pam 3 LPS IF N-y/LP S ctrl Pam 3 LPS IFN -y/LP S ctrl Pam 3 LPS IFN -y/LP S 0 5'000 10'000 15'000 20'000 40'000 60'000 80'000 100'000 24h stimulation pg /ml TNF- M0 M1 M2 * * * * * * * * ctrl Pam 3 LPS IFN -y/LP S ctrl Pam 3 LPS IFN -y/LP S ctrl Pam 3 LPS IFN -y/LP S 0 50 100 150 24h stimulation p g/ ml IL-1 M0 M1 M2 * * * * * * ctrl Pam 3 LPS IFN -y/LPS ctrl Pam
3 LPS IFN -y/L
PS ctrl Pam 3 LPS IFN -y/L PS 0 10'000 20'000 30'000 40'000 24h stimulation pg/ml IL-6 M0 M1 M2 * * * * * * * * * * * ctrl Pam3 LP
S
IFN -y/LP
S ctrl
Pam3 LP S
IFN -y/L
PS ctrl Pam3 LP
S IFN -y/LP S 0 50'000 100'000 150'000 200'000 250'000 24h stimulation pg/ml IL-8 M0 M1 M2 * * * * * * * ctrl Pam 3 LPS IFN -y/L
PS ctrl Pam
3 LPS
IFN -y/L
PS ctrl Pam 3 LPS IFN -y/L PS 0 100 200 300 400 24h stimulation p g /m l MMP3 M0 M1 M2 * * * ctrl Pam3LP
S IFN
-y/L PSIL-4IFN-y ctrl
Pam 3 LPS IFN -y/LP S
IL-4IFN-y ctrl Pam
3 LPS IFN
-y/L PSIL-4IFN-y
0 2'000 4'000 6'000 8'000 24h stimulation pg/ m l IL-10 M0 M1 M2 * * * * * * * * * *
Fig. 3Cytokine profile of M0, M1-, and M2-polarized macrophages following Toll-like receptor ligand exposure and activation.aM0 (monocytes),
[image:8.595.57.539.87.616.2]Discussion
Macrophages play an important role in the pathogenesis of RA. Depending on the local microenvironment, they can be polarized toward either proinflammatory M1 or anti-inflammatory M2 macrophages [20, 21]. In the present study, we aimed to investigate the phenotypical and functional plasticity of predifferentiated M1 and M2 macrophage subtypes under conditions associated with RA, such as the presence of abundant TLR agonists. By differentiating monocytes from peripheral blood of HD
or patients with RA into M1 and M2 macrophages and exposing them to TLR ligands Pam3 and LPS, we anticipated to elucidate the processes that affect infil-trating monocytes in inflamed synovial tissue. Using this experimental design, we demonstrate that M2-polarized macrophages derived from monocytes of HD or patients with RA display an impaired anti-inflammatory activity profile under TLR2 engagement compared with TLR4 stimulation. Thus, following TLR2 stimulation by its
lig-and Pam3, the M2 population secreted the
a
b
c
ctrlPam 3
LPS
IFN -y/L
PS 0
10 20 30 40 50
24h stimulation
2
^
-dc
t
TLR2 M0
* *
ctrl Pam
3 LPS
IFN -y/LP
S 0
5 10 15 20
24h stimulation
2
^
-dc
t
TLR2 M1
* *
ctrl Pam
3 LPS
IFN -y/L
PS 0
10 20 30
24h stimulation
2
^
-dc
t
TLR2 M2
* *
ctrl Pam3 LPS
IFN -y/L
PS 0
2 4 6 8 10
24h stimulation
2
^
-dct
TLR4 M0
*
* *
ctrl Pam3 LPS
IFN -y/L
PS 0
2 4 6
24h stimulation
2^
-dc
t
TLR4 M1
* *
ctrl Pam3 LPS
IFN -y/L
PS 0
5 10 15 20
24h stimulation
2^
-dc
t
TLR4 M2
*
*
TLR 2
TLR 4
0 5 10 15 20
RA: Gene expression
basal level
2^-dc
t
M1 M2
* *
ctrl Pam
3 LP
S ctrl
Pam 3
LP S
0 10 20 30 40
24h stimulation
2^
-d
ct
RA: TLR2 M1 M2
* *
* *
ctrl Pam
3 LPS ctrl
Pam 3
LPS
0 5 10 15 20
24h stimulation
2^-dct
RA: TLR4 M1 M2
* * *
*
TLR 2
TLR 4
0 5 10 15 20
Gene expression
basal level
2
^-dct
*
M0
M2 M1 *
Fig. 4TLR2andTLR4gene expression in M0, M1-, and M2-polarized macrophages following Toll-like receptor (TLR) ligand exposure.aBasal gene
expression levels ofTLR2andTLR4were measured in M0 (monocytes), M1 (GM-CSF-differentiated), and M2 (M-CSF-differentiated) macrophages by qRT-PCR.bCells were stimulated for 24 h with 300 ng/ml Pam3, 100 ng/ml lipopolysaccharide (LPS), or a combination of interferon (IFN)-γ/LPS (20 ng/ml and 100 ng/ml), and gene expression ofTLR2andTLR4was measured by qRT-PCR.cBasal expression (left panel) and changes inTLR2and
[image:9.595.58.538.89.500.2]proinflammatory cytokines IL-6 and IL-8 at levels com-parable to Pam3-stimulated M1-polarized macrophages. Despite this shift toward a proinflammatory M1 func-tion, M2 macrophages continued to express the typ-ical M2 cell surface markers CD14 and CD163.
However, gene expression of HMOX1, FOLR2, and
SLC40A1, three characteristic markers of an anti-inflammatory M2 phenotype, were reduced toward M1 levels, thus correlating with the promoted proin-flammatory cytokine profile seen in M2 following
TLR2 stimulation. Somehow, unexpectedly, we found that TLR4 stimulation by LPS also led to prominent downregulation of these M2 genetic markers, even though signaling through TLR4 resulted in strong anti-inflammatory activity as measured by ratio of 10 to IL-6 and to IL-8 and as expected for M2 macrophages. Thus, in conditions of abundant TLR2 stimulation, a“chimeric” M2 seems to emerge, displaying an M2-like phenotype de-fined by surface markers while obtaining M1-like func-tions as defined by genetic markers and cytokine secretion.
As reported in other publications [39], it is possible that ex vivo monocytes from peripheral blood differ in certain aspects between HD and patients with RA. Indeed, we found that basal expression of the surface marker CD206 differed in freshly isolated monocytes from patients with RA compared with HD. However, we found that the discrete macrophage subsets gener-ated from peripheral monocytes of patients with RA displayed similar if not equal subset-specific pheno-typical and functional responses upon TLR2 or TLR4 treatment as compared with HD.
To date, in only a few studies have researchers ana-lyzed macrophage subsets in RA [24, 25]. Ambarus et al. [24] compared different surface markers (CD14, CD163, CD68, CD32, CD64, CD200R, CD80) on macrophages in synovial tissue or in monocyte-derived macrophages from RA versus spondyloarthritis. In line with our study, their data indicate that, in an inflammatory environment, there exist macrophages with a mixed M1/M2 pheno-type. In a second study, Soler Palacios et al. [25] under-took phenotypic and transcriptomic characterization of
ex vivo isolated CD14+ RA SF macrophages and
com-pared them with M1 (GM-CSF) and M2 (M-CSF) mac-rophages generated in vitro. Their presented data showed that RA SF macrophages exhibit a rather mixed phenotype expressing several M1-like proinflammatory markers but also including M2-like markers. Interest-ingly, several aspects are compatible with our M2-derived“chimeric”macrophages following TLR2
engage-ment. Thus, they also demonstrated that FOLR2 and
SLC40A1gene expression levels in RA SF macrophages were low and corresponded to the generated M1 (GM-CSF) macrophages. Instead, the expression ofHMOX1, a third genetic marker for an anti-inflammatory M2 phenotype, was similar in RA SF macrophages compared with the generated M2 subset. In our M2 generated macrophages, stimulation with LPS resulted in
signifi-cant downregulation of HMOX1, whereas Pam3 only
mildly reduced HMOX1 expression. Nevertheless, LPS
induced strong anti-inflammatory activity with high IL-10/IL-6 and IL-10/IL-8 ratios. These results suggest that
low expression levels of HMOX1 alone cannot
discrim-inate M1 from M2 macrophages in terms of an
anti-a
b
Fig. 5NF-κB, mitogen-activated protein kinase, and interferon regulatory
factor 3 activation in M1- and M2-polarized macrophages following Toll-like receptor ligand exposure.aM1 (granulocyte-macrophage stimulating factor [GM-CSF]) and M2 (macrophage colony-stimulating factor [M-CSF]) macrophages were stimulated for 1 h with 300 ng/ml Pam3, 10μg/ml polyinosinic-polycytidylic acid [poly(I:C)], and 100 ng/ml lipopolysaccharide. Nuclear translocation of p65 (NF-κB) and IRF3 was detected by Western blotting.n= 3.
bM1 and M2 macrophages were stimulated for 30 minutes with
[image:10.595.56.291.86.445.2]inflammatory cytokine secretion profile. In addition, RA SF macrophages in the study of Soler Palacios et al. [25] also exhibited a tendency to express several markers ap-parent in an M2 cell type, such as increased CD14 and CD163 levels (as measured by MFI) or superior IL-10 expression compared with their generated M1 cell type. Our data therefore indicate that, in contrast to what has been conventionally proposed, surface markers as well as individual gene expression markers do not correlate with proinflammatory or anti-inflammatory cytokine ex-pression in M1 and M2 macrophages under inflamma-tory conditions, which presumably consist of combined TLR2 and TLR4 stimuli. In this context, it is noteworthy that, under certain circumstances, M-CSF-generated macrophages (M2-like) can exhibit proinflammatory activity, as demonstrated by stimulation with ACPA [40] or TLR ligands in combination with IgG [30]. Likewise, Vogelpoel et al. [30] reported synergistic upregulation of proinflammatory cytokines in M2 macrophages exposed to IgG and TLR ligands, which did not differ between macrophages derived from HD or patients with RA. Fur-thermore, in addition to pathogen-associated molecular patterns (PAMPs), also damage-associated molecular patterns (DAMPs) such as extra domain A fibronectin, tenascin-C, serum amyloid A, high-mobility group box 1 protein, and gp96 are potent agonists on TLRs. All of these DAMPs have been found at elevated levels in sy-novia from patients with RA [41], and tissue-resident macrophages are potentially exposed to a mixture of PAMP- and DAMP-related ligands. In the context of DAMPs, it is also noteworthy that TLR2, but not TLR4, signaling induces strong MMP3 secretion, which was found to be a critical factor in the progression of cartil-age and bone erosion in advanced RA [37].
In our in vitro study, we could demonstrate that in the presence of abundant TLR2 ligands, M2 macrophages derived from peripheral blood of HD or patients with RA lose their anti-inflammatory activity. IL-10 expres-sion is significantly lower in M2 upon TLR2 engagement than with TLR4 stimulation. IL-10 is a major regulator of immunity to infection [42]; it inhibits the activity of Th1 cells, natural killer cells, and macrophages and limits the production of proinflammatory cytokines and chemokines. ERK1/2 is part of the signaling cascade that is activated in macrophages and promote the production of IL-10 [43, 44]. In our study, we observed that both Pam3 and LPS activate ERK1/2, p38, and JNK to a simi-lar extent, despite the differential effect of the applied li-gands on pro- and anti-inflammatory cytokine levels. These observations point to a regimen of regulatory steps that govern the inflammatory and anti-inflammatory re-sponses of M1 and M2 macrophages upon TLR stimula-tion. Thus, TLR stimulation might generate a broad
MAPK signaling that then will subsequently be
discriminated at different regulatory checkpoints, such as fine-tuning of downstream target gene expression by a specific set of microRNAs. Of note, all investigated MAPKs were activated to a higher degree in M2 than in M1 after stimulation with TLR2 and TLR4 ligands. These observations might have implications for the use of MAPK inhibitors as anti-inflammatory therapy [45] in RA, because administration of such drugs would reduce the function not only of proinflammatory M1 but also of anti-inflammatory M2 subsets.
TLRs have been shown to be highly expressed in rheumatoid synovial tissue or synovial macrophages from patients with RA [12–16], and the stimulation of these receptors plays a role in the pathogenesis of RA [10, 46, 47]. The importance of TLR signaling for the pathogenesis of RA has been suggested by studies with murine arthritis models. Abdollahi-Roodsaz et al. [48] found that development of streptococcal cell wall-induced arthritis in mice was dependent on TLR2 during the acute phase, and this effect shifted to TLR4 depend-ency during the chronic phase. They also showed that administration of a TLR4 antagonist suppressed clinical and histologic characteristics of arthritis in a mouse model of collagen-induced arthritis [49]. Pierer et al. [50] revealed a significantly lower incidence of collagen-induced arthritis in TLR4-deficient mice. In a model of zymosan-induced arthritis, it was demonstrated that TLR2-deficient mice showed a decrease in early and late phases of joint inflammation [51]. These studies indicate that both receptors play an important role in the devel-opment of arthritis.
TLRs are discussed as therapeutic targets for inflam-matory diseases but also for cancer [52, 53]. Several agonists and antagonists are under development and are already in different clinical phases. Therapeutic effects of treatment with anti-TLR2 and anti-TLR4 monoclonal antibodies have been investigated in a mouse study against polymicrobial sepsis [54]. Interestingly, a single administration of either anti-TLR2 or anti-TLR4 in-creased the survival rate and dein-creased peritoneal,
serum, and lung TNF-α levels more efficiently than a
Conclusions
We show that stimulation with TLR2 but not TLR4 li-gands drives M2-polarized macrophages to secrete proin-flammatory cytokines and impairs their anti-inproin-flammatory activity. Importantly, the generation of this chimeric M1/ M2 macrophage subset upon TLR2 stimulation goes along without major changes in the surface marker profile. Thus, the classical M1/M2 paradigm as based on surface marker expression does not apply to macrophage func-tions under inflammatory condifunc-tions such as RA.
Additional files
Additional file 1: Figure S1A.Characterization of surface markers on
M0, M1-, and M2-polarized macrophages derived from peripheral blood of healthy donors (HD) compared with patients with rheumatoid arthritis (RA). For phenotypical analysis, M0 (ex vivo monocytes), M1 (GM-CSF-differentiated), and M2 (M-CSF-differentiated) macrophages derived from peripheral blood of HD or patients with RA were stained for FACS analysis with fluorescently labeled antibodies CD14-APC-Cy7, CD163-FITC, CD206-BV421, and CD86-PE. Comparison of surface marker expression on freshly isolated M0- or M1- and M2-polarized macrophages from HD (left panels) versus RA (right panels) presented with representative CD14-to-CD86 (upper panels) and CD206-to-CD163 (lower panels) density plots.n= 6. (DOCX 217 kb)
Additional file 2: Figure S1B.Effect of TLR or cytokine stimulation on
surface marker expression in M1 versus M2 macrophages derived from peripheral monocytes of healthy donors (HD) and patients with rheumatoid arthritis (RA) based on mean fluorescence intensity (MFI) analysis. M1 (GM-CSF-differentiated) and M2 (M-CSF-differentiated) macrophages were stimulated for 24 h with 300 ng/ml Pam3, 100 ng/ml LPS, or a combination of IFN-γ/LPS. For phenotypical analysis, cells were stained for FACS analysis with fluorescently labeled antibodies CD14-APC-Cy7, CD163-FITC, CD206-BV421, CD86-PE, and CD80-FITC. Individual MFI was calculated asΔMFI = MFIspecific surface marker−MFIcorresponding unstained controland normalized to the basal MFI of unstained control cells.n= 6, *p< 0.05. (DOCX 759 kb)
Additional file 3: Figure S2.Expression of characteristic
anti-inflammatory M2 gene markers in M1 and M2 macrophages derived from blood of healthy donors (HD) or patients with rheumatoid arthritis (RA). Basal gene expression of M2 markersHMOX1,FOLR2, andSLC40A1in M0 (monocytes), M1 (GM-CSF-differentiated), and M2 (M-CSF-differentiated) macrophages from HD (upper panel) or patients with RA (lower panel). Expression was measured by qRT-PCR. Values were normalized toUBCmRNA levels and expressed as 2−ΔCT± SD.n= 4–5, *p< 0.05. (DOCX 302 kb)
Additional file 4: Figure S3.Cytokine profile of M1- and M2-polarized
macrophages derived from blood of patients with rheumatoid arthritis (RA) following TLR ligand exposure and activation. M1
(GM-CSF-differentiated) and M2 (M-CSF-differentiated) macrophages were stimulated for 24 h with 300 ng/ml Pam3 or 100 ng/ml LPS. Cytokine and MMP3 release was measured by ELISA, and values are expressed as mean ± SD.n= 5–6, *p< 0.05. (DOCX 139 kb)
Abbreviations
ACPA:Anticitrullinated peptide antibodies; ANOVA: Analysis of variance; CD: Cluster of differentiation; DAMP: Damage-associated molecular pattern; DTT: Dithiothreitol; ELISA: Enzyme-linked immunosorbent assay;
ERK: Extracellular signal-regulated kinase; FACS: Fluorescence-activated cell sorting; FITC: Fluorescein isothiocyanate; FOLR2: Folate receptorβ; GM-CSF: Granulocyte-macrophage colony-stimulating factor; HD: Healthy donors; HEPES: 4-(2-hydroxyethyl)-1-piperazineethanesulfonic acid; HMOX1: Heme oxygenase 1; IFN: Interferon; IgG: Immunoglobulin G; IL: Interleukin; IRF: Interferon regulatory factor; JNK: c-Jun N-terminal kinase; LPS: Lipopolysaccharide; MAPK: Mitogen-activated protein kinase; M-CSF: Macrophage colony-stimulating factor; MFI: Mean fluorescence intensity; MMP: Matrix metalloproteinase; mRNA: Messenger RNA; PAMP:
Pathogen-associated molecular pattern; PMSF: Phenylmethylsulfonyl fluoride; Poly(I:C): polyinosinic-polycytidylic acid; PVDF: Polyvinylidene difluoride; RA: Rheumatoid arthritis; SAPK: Stress-activated protein kinase; SF: Synovial fluid; SLC40A1: Solute carrier family 40 member 1; TBP: TATA-box binding protein; TBS: Tris-buffered saline; TBS-T: Tris-buffered saline with Tween 20; TLR: Toll-like receptor; TNF-α: Tumor necrosis factor-α; UBC: Ubiquitin C; WB: Western blotting
Funding
The study was supported by the Swiss National Science Foundation (grant 310030_144254) and the Department of Biomedicine, University of Basel.
Availability of data and materials
The datasets generated and analyzed during the present study are available from the corresponding author on reasonable request.
Authors’contributions
LQ was involved in the study concept and design; acquisition, analysis, and interpretation of data; and drafting of the manuscript. EH was involved in acquisition of data. TM was involved in interpretation of data and drafting of the manuscript. ANT was involved in the acquisition, analysis, and interpretation of data; and drafting of the manuscript. DK was involved in study concept and design as well as drafting and revision of the manuscript. All authors read and approved the final manuscript.
Ethics approval and consent to participate
All blood donors gave informed consent. The study was approved by the Ethikkommission Nordwest- und Zentralschweiz (EKNZ 2014-51).
Consent for publication
Not applicable.
Competing interests
The authors declare that they have no competing interests.
Publisher’s Note
Springer Nature remains neutral with regard to jurisdictional claims in published maps and institutional affiliations.
Received: 7 June 2017 Accepted: 3 October 2017
References
1. McInnes IB, Schett G. The pathogenesis of rheumatoid arthritis. N Engl J Med. 2011;365(23):2205–19.
2. Valesini G, Gerardi MC, Iannuccelli C, Pacucci VA, Pendolino M, Shoenfeld Y. Citrullination and autoimmunity. Autoimmun Rev. 2015;14(6):490–7. 3. Turner JD, Filer A. The role of the synovial fibroblast in rheumatoid arthritis
pathogenesis. Curr Opin Rheumatol. 2015;27(2):175–82.
4. Pap T, Müller-Ladner U, Gay RE, Gay S. Fibroblast biology: role of synovial fibroblasts in the pathogenesis of rheumatoid arthritis. Arthritis Res. 2000;2(5):361–7.
5. Bartok B, Firestein GS. Fibroblast-like synoviocytes: key effector cells in rheumatoid arthritis. Immunol Rev. 2010;233(1):233–55.
6. Neumann E, Lefevre S, Zimmermann B, Gay S, Müller-Ladner U. Rheumatoid arthritis progression mediated by activated synovial fibroblasts. Trends Mol Med. 2010;16(10):458–68.
7. McInnes IB, Schett G. Cytokines in the pathogenesis of rheumatoid arthritis. Nat Rev Immunol. 2007;7(6):429–42.
8. Troughton PR, Platt R, Bird H, el-Manzalawi E, Bassiouni M, Wright V. Synovial fluid interleukin-8 and neutrophil function in rheumatoid arthritis and seronegative polyarthritis. Br J Rheumatol. 1996;35(12):1244–51. 9. Konttinen YT, Ainola M, Valleala H, Ma J, Ida H, Mandelin J, Kinne RW, Santavirta
S, Sorsa T, Lopez-Otin C, et al. Analysis of 16 different matrix metalloproteinases (MMP-1 to MMP-20) in the synovial membrane: different profiles in trauma and rheumatoid arthritis. Ann Rheum Dis. 1999;58(11):691–7.
10. Huang QQ, Pope RM. The role of Toll-like receptors in rheumatoid arthritis. Curr Rheumatol Rep. 2009;11(5):357–64.
12. Seibl R, Birchler T, Loeliger S, Hossle JP, Gay RE, Saurenmann T, Michel BA, Seger RA, Gay S, Lauener RP. Expression and regulation of Toll-like receptor 2 in rheumatoid arthritis synovium. Am J Pathol. 2003;162(4):1221–7. 13. Radstake TR, Roelofs MF, Jenniskens YM, Oppers-Walgreen B, van Riel PL,
Barrera P, Joosten LA, van den Berg WB. Expression of Toll-like receptors 2 and 4 in rheumatoid synovial tissue and regulation by proinflammatory cytokines interleukin-12 and interleukin-18 via interferon-γ. Arthritis Rheum. 2004;50(12):3856–65.
14. Ospelt C, Brentano F, Rengel Y, Stanczyk J, Kolling C, Tak PP, Gay RE, Gay S, Kyburz D. Overexpression of Toll-like receptors 3 and 4 in synovial tissue from patients with early rheumatoid arthritis: Toll-like receptor expression in early and longstanding arthritis. Arthritis Rheum. 2008;58(12):3684–92. 15. Yoon BR, Yoo SJ, Choi Y, Chung YH, Kim J, Yoo IS, Kang SW, Lee WW.
Functional phenotype of synovial monocytes modulating inflammatory T-cell responses in rheumatoid arthritis (RA). PLoS One. 2014;9(10):e109775. 16. Huang Q, Ma Y, Adebayo A, Pope RM. Increased macrophage activation
mediated through Toll-like receptors in rheumatoid arthritis. Arthritis Rheum. 2007;56(7):2192–201.
17. Hamilton JA. Colony-stimulating factors in inflammation and autoimmunity. Nat Rev Immunol. 2008;8(7):533–44.
18. Hamilton JA, Piccoli DS, Cebon J, Layton JE, Rathanaswani P, McColl SR, Leizer T. Cytokine regulation of colony-stimulating factor (CSF) production in cultured human synovial fibroblasts. II. Similarities and differences in the control of interleukin-1 induction of granulocyte-macrophage CSF and granulocyte-CSF production. Blood. 1992;79(6):1413–9.
19. Li J, Hsu HC, Mountz JD. Managing macrophages in rheumatoid arthritis by reform or removal. Curr Rheumatol Rep. 2012;14(5):445–54.
20. Verreck FA, de Boer T, Langenberg DM, van der Zanden L, Ottenhoff TH. Phenotypic and functional profiling of human proinflammatory type-1 and anti-inflammatory type-2 macrophages in response to microbial antigens and IFN-γ- and CD40L-mediated costimulation. J Leukoc Biol. 2006;79(2):285–93. 21. Mantovani A, Sica A, Sozzani S, Allavena P, Vecchi A, Locati M. The chemokine
system in diverse forms of macrophage activation and polarization. Trends Immunol. 2004;25(12):677–86.
22. Puig-Kroger A, Sierra-Filardi E, Dominguez-Soto A, Samaniego R, Corcuera MT, Gomez-Aguado F, Ratnam M, Sanchez-Mateos P, Corbi AL. Folate receptorβis expressed by tumor-associated macrophages and constitutes a marker for M2 anti-inflammatory/regulatory macrophages. Cancer Res. 2009;69(24):9395–403.
23. Sierra-Filardi E, Vega MA, Sanchez-Mateos P, Corbi AL, Puig-Kroger A. Heme oxygenase-1 expression in M-CSF-polarized M2 macrophages contributes to LPS-induced IL-10 release. Immunobiology. 2010;215(9-10):788–95.
24. Ambarus CA, Noordenbos T, de Hair MJ, Tak PP, Baeten DL. Intimal lining layer macrophages but not synovial sublining macrophages display an IL-10 polarized-like phenotype in chronic synovitis. Arthritis Res Ther. 2012;14(2):R74. 25. Soler Palacios B, Estrada-Capetillo L, Izquierdo E, Criado G, Nieto C, Municio C, Gonzalez-Alvaro I, Sanchez-Mateos P, Pablos JL, Corbi AL, et al. Macrophages from the synovium of active rheumatoid arthritis exhibit an activin A-dependent pro-inflammatory profile. J Pathol. 2015;235(3):515–26.
26. Kennedy A, Fearon U, Veale DJ, Godson C. Macrophages in synovial inflammation. Front Immunol. 2011;2:52.
27. Kinne RW, Stuhlmüller B, Burmester GR. Cells of the synovium in rheumatoid arthritis: macrophages. Arthritis Res Ther. 2007;9(6):224.
28. Malyshev I, Malyshev Y. Current concept and update of the macrophage plasticity concept: intracellular mechanisms of reprogramming and M3 macrophage“switch”phenotype. Biomed Res Int. 2015;2015:341308. 29. Samaniego R, Palacios BS, Domiguez-Soto A, Vidal C, Salas A, Matsuyama T,
Sanchez-Torres C, de la Torre I, Miranda-Carus ME, Sanchez-Mateos P, et al. Macrophage uptake and accumulation of folates are polarization-dependent in vitro and in vivo and are regulated by activin A. J Leukoc Biol.
2014;95(5):797–808.
30. Vogelpoel LT, Hansen IS, Rispens T, Müller FJ, van Capel TM, Turina MC, Vos JB, Baeten DL, Kapsenberg ML, de Jong EC, et al. Fcγreceptor-TLR cross-talk elicits pro-inflammatory cytokine production by human M2 macrophages. Nat Commun. 2014;5:5444.
31. Fleetwood AJ, Lawrence T, Hamilton JA, Cook AD. Granulocyte-macrophage colony-stimulating factor (CSF) and macrophage CSF-dependent macrophage phenotypes display differences in cytokine profiles and transcription factor activities: implications for CSF blockade in inflammation. J Immunol. 2007;178(8):5245–52.
32. Lacey DC, Achuthan A, Fleetwood AJ, Dinh H, Roiniotis J, Scholz GM, Chang MW, Beckman SK, Cook AD, Hamilton JA. Defining GM-CSF- and macrophage-CSF-dependent macrophage responses by in vitro models. J Immunol. 2012;188(11):5752–65.
33. Roszer T. Understanding the mysterious M2 macrophage through activation markers and effector mechanisms. Mediators Inflamm. 2015;2015:816460. 34. Rey-Giraud F, Hafner M, Ries CH. In vitro generation of monocyte-derived
macrophages under serum-free conditions improves their tumor promoting functions. PLoS One. 2012;7(8):e42656.
35. Porcheray F, Viaud S, Rimaniol AC, Leone C, Samah B, Dereuddre-Bosquet N, Dormont D, Gras G. Macrophage activation switching: an asset for the resolution of inflammation. Clin Exp Immunol. 2005;142(3):481–9. 36. Ohradanova-Repic A, Machacek C, Fischer MB, Stockinger H. Differentiation
of human monocytes and derived subsets of macrophages and dendritic cells by the HLDA10 monoclonal antibody panel. Clin Transl Immunology. 2016;5(1):e55.
37. Ainola MM, Mandelin JA, Liljestrom MP, Li TF, Hukkanen MV, Konttinen YT. Pannus invasion and cartilage degradation in rheumatoid arthritis: involvement of MMP-3 and interleukin-1β. Clin Exp Rheumatol. 2005;23(5):644–50. 38. Lundberg AM, Drexler SK, Monaco C, Williams LM, Sacre SM, Feldmann M,
Foxwell BM. Key differences in TLR3/poly I:C signaling and cytokine induction by human primary cells: a phenomenon absent from murine cell systems. Blood. 2007;110(9):3245–52.
39. Lacerte P, Brunet A, Egarnes B, Duchene B, Brown JP, Gosselin J. Overexpression of TLR2 and TLR9 on monocyte subsets of active rheumatoid arthritis patients contributes to enhance responsiveness to TLR agonists. Arthritis Res Ther. 2016;18:10.
40. Clavel C, Ceccato L, Anquetil F, Serre G, Sebbag M. Among human macrophages polarised to different phenotypes, the M-CSF-oriented cells present the highest pro-inflammatory response to the rheumatoid arthritis-specific immune complexes containing ACPA. Ann Rheum Dis. 2016;75(12):2184–91. 41. Huang Q, Pope RM. Toll-like receptor signaling: a potential link among
rheumatoid arthritis, systemic lupus, and atherosclerosis. J Leukoc Biol. 2010;88(2):253–62.
42. Couper KN, Blount DG, Riley EM. IL-10: the master regulator of immunity to infection. J Immunol. 2008;180(9):5771–7.
43. Saraiva M, O’Garra A. The regulation of IL-10 production by immune cells. Nat Rev Immunol. 2010;10(3):170–81.
44. Gabrysova L, Howes A, Saraiva M, O’Garra A. The regulation of IL-10 expression. Curr Top Microbiol Immunol. 2014;380:157–90.
45. Gaestel M, Kotlyarov A, Kracht M. Targeting innate immunity protein kinase signalling in inflammation. Nat Rev Drug Discov. 2009;8(6):480–99. 46. Santegoets KC, van Bon L, van den Berg WB, Wenink MH, Radstake TR.
Toll-like receptors in rheumatic diseases: are we paying a high price for our defense against bugs? FEBS Lett. 2011;585(23):3660–6.
47. Hu F, Li Y, Zheng L, Shi L, Liu H, Zhang X, Zhu H, Tang S, Zhu L, Xu L, et al. Toll-like receptors expressed by synovial fibroblasts perpetuate Th1 and Th17 cell responses in rheumatoid arthritis. PLoS One. 2014;9(6):e100266. 48. Abdollahi-Roodsaz S, Joosten LA, Helsen MM, Walgreen B, van Lent PL, van
den Bersselaar LA, Koenders MI, van den Berg WB. Shift from Toll-like receptor 2 (TLR-2) toward TLR-4 dependency in the erosive stage of chronic streptococcal cell wall arthritis coincident with TLR-4-mediated interleukin-17 production. Arthritis Rheum. 2008;58(12):3753–64.
49. Abdollahi-Roodsaz S, Joosten LA, Roelofs MF, Radstake TR, Matera G, Popa C, van der Meer JW, Netea MG, van den Berg WB. Inhibition of Toll-like receptor 4 breaks the inflammatory loop in autoimmune destructive arthritis. Arthritis Rheum. 2007;56(9):2957–67.
50. Pierer M, Wagner U, Rossol M, Ibrahim S. Toll-like receptor 4 is involved in inflammatory and joint destructive pathways in collagen-induced arthritis in DBA1J mice. PLoS One. 2011;6(8):e23539.
51. Frasnelli ME, Tarussio D, Chobaz-Peclat V, Busso N, So A. TLR2 modulates inflammation in zymosan-induced arthritis in mice. Arthritis Res Ther. 2005;7(2):R370–9.
52. Hennessy EJ, Parker AE, O’Neill LA. Targeting Toll-like receptors: emerging therapeutics? Nat Rev Drug Discov. 2010;9(4):293–307.
53. Achek A, Yesudhas D, Choi S. Toll-like receptors: promising therapeutic targets for inflammatory diseases. Arch Pharm Res. 2016;39(8):1032–49. 54. Lima CX, Souza DG, Amaral FA, Fagundes CT, Rodrigues IP, Alves-Filho JC,