International Journal of Emerging Technology and Advanced Engineering
Website: www.ijetae.com (ISSN 2250-2459, ISO 9001:2008 Certified Journal, Volume 3, Issue 6, June 2013)
639
White Blood Cell Segmentation and Counting Using Global
Threshold
Prof. J. B. Nemane
1, Prof. V. A. Chakkarwar
2, Prof. P. B. Lahoti
3 1Lecturer in IT Department, Govt. Poly. Ambad, (MS), India.
2Lecturer in CSE Department, Govt. College of Engg. Aurangabad (MS), India. 3Lecturer in CSE Department, Govt. Poly. Ambad, (MS), India.
Abstract--Blood helps our body fight off infectious agents and inactivates toxins, stops bleeding through its clotting ability, and regulates our body temperature. Doctors rely on many blood tests to diagnose and monitor diseases the idea of our paper is to serve the pathologists, medical technicians for the same, by using Image Processing techniques. Manual process of counting is a very time consuming task. Then an automatic and efficient system is necessary and helpful In this paper Image Arithmetic and Global Threshold Method WBC nucleus segmentation that can be used to separate the nucleus from the blood smear image by using a combination of automatic contrast stretching, image arithmetic operation, minimum filter and global threshold techniques so it is able to segment specific isolated cell from its background and we present a method for blood cell image segmentation and counting.
Keywords-- White Blood Cell, Segmentation, Threshold, Red blood cell
I. INTRODUCTION
Cell segmentation is a challenging problem due to both the complex nature of the cells and the uncertainty present in video microscopy. Manual methods for this purpose are onerous, imprecise and highly subjective, thus requiring automated methods that perform this task in an objective and efficient way. Automated detection and classification of white blood cells is a major step in diagnosis of several diseases like Acute Lymphoblastic Leukemia [1,2]. The traditional procedure requires a hematologist to manually count and classify the cells with the help of a microscope.
An automated diagnosis system will alleviate the workload and the influence of subjective factors. Automated detection involves removal of red blood cells and platelets from the background. The main drawback of the existing methods is their inefficiency in handling cell images originating from different sources and environment [2]. There are three types of cells in normal human blood: red blood cells (RBCs), white blood cells (WBCs) [1, 7, and 8] and blood platelets. Generally, RBCs are simple and similar. While WBCs contain nucleus and cytoplasm and can be categorized into five classes:
1. Neutrophil 2. Eosinophil 3. Basophil 4. Monocyte 5. Lymphocyte
The nucleus of each of the above types has a unique shape, and this is the most important feature used in cell classification. In addition to the shape of the nucleus, the “phils” category has granules with in the blood cell where as “cytes” category does not have granules.
II.MEAN SHIFT METHOD
Numerous nonparametric clustering methods can be classified into two large classes: hierarchical clustering and density estimation. Hierarchical clustering techniques either aggregate or divide the data based on some proximity measure. They tend to be computationally expensive and not straightforward.
The mean shift can be classified into density estimation. The mean shift adequately analyses feature space to cluster them and can provide reliable solutions for many vision tasks. Then describe the mean shift procedure in the following:
The Mean Shift Procedure:
Given n data points xi, i=1,…, n in the d-dimensional space Rd and set one bandwidth parameter h > 0. The mean shift is
( )
∑ (|| || )
∑ (|| ||)
( )
Where kernel k(p) is
( ) { ( )
International Journal of Emerging Technology and Advanced Engineering
Website: www.ijetae.com (ISSN 2250-2459, ISO 9001:2008 Certified Journal, Volume 3, Issue 6, June 2013)
640
But if m(x) is bigger than threshold, we should set m(x)’s first term be the new mean and repeat computing m(x) until convergence.Mean shift algorithm:
1. Decide what features you want mean shift to consider and you should let every features be a vector. Then we could construct d dimensions matrix. For example,
dataPts=
1
2
3
4
5
6
3
5
4
1
7
9
4
5
1
2
6
7
(3)2. Randomly select a column to be an initial mean. For example,
4
1
2
3. Construct a matrix, which is the repeat of an initial mean and use this matrix to minus “dataPts”. Then calculate the square of every components of the new matrix and individually sum every column to get a vector “SqDistToAll”. For example,
SqDistToAll=
4 4 4 4 4 4
1 1 1 1 1 1 . ^ 2
2 2 2 2 2 2
dataPts =
9 4 1 0 1 4
4 16 9 0 36 64
4 9 1 0 16 25
(4)
4. Find out the positions, which their value are smaller than (bandwidth)2 from “SqDistToAll”. Store these positions in “inInds” and label these positions in “beenVisitedFlag”.
5. Recomputed the new mean among the value of “inInds”.
6. Repeat step3 ~ step5 until the mean is convergence. The convergence means the distance between previous mean and present mean is smaller than the threshold that we decide. Distance represents their mean square or the sum of their difference’s square.
7. After convergence, we can cluster those labeled positions in the same cluster. But before clustering, we have to examine whether the distance between the new found mean and those old means is too close. If it happens, we should merge those labelled positions into the old mean’s cluster.
8. Afterward eliminate those clustered data from “dataPts” and repeat step2 ~ step7 until all of “dataPts” are clustered. Then the mean shift’s clustering is finished.
III. PROPOSED METOD
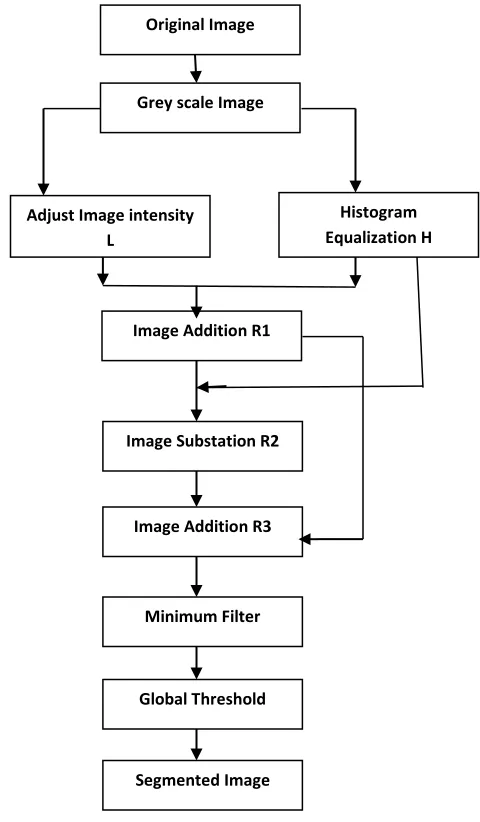
In the beginning all the images are converted into gray scale images so that the nucleus part of the cell will appear as the darkest part of the image. The white blood cell nucleus is based on automatic contrast stretching, histogram equalization and image arithmetic. Figure 1 shows the proposed steps of the white blood nucleus segmentation scheme, after converting the original image which it is in RGB colour format to a rescale image, all the subsequent steps will work on the gray scale image. First one copy of the image will be enhanced with a linear contrast stretching (in this research this is referred to as L) and another copy will be enhanced with histogram equalization (in this research this is referred to as H). The result from L is added to the resultant image from H and subsequently called R1 (Eq. 5). By performing the image addition, all the resultant pixels exceeding the intensity value of 225 is truncated to 255 which brighten most of the details in the image except the nucleus.
R1 (i ,j)=L ( i, j) + H ( i , j) (5)
The result R1) is then subtracted from the histogram equalized image (H) to form R2 (Eq. 6). This operation highlights all the objects and its borders in the image including the cell nucleus.
R2 (i,j) = R1( i , j ) – H (i , j) (6)
The last arithmetic operation is to add both of the results R1 and R2 together to produce R3 (Eq. 7). This operation removes almost all the other blood components while retaining the nucleus with minimum effect of distortion on the nucleus part of the white blood cell.
International Journal of Emerging Technology and Advanced Engineering
Website: www.ijetae.com (ISSN 2250-2459, ISO 9001:2008 Certified Journal, Volume 3, Issue 6, June 2013)
641
R3 ( i, j )= R1(i , j)+ R2 (i , j) (7)If we use the automatic threshold at this stage it will lead to miss-segmentation of some part of the nucleus due to the effect of distortion after the last arithmetic operation. To avoid this problem, a [3 by 3] minimum filter is used to increase the intensity value making the nucleus part darker so it can be fully detected using a threshold.
IV. RESULTS &DISCUSSIONS
The variation in the accuracy rate between Image Arithmetic, Global Threshold and Mean shift Method FAR(Number of images falsely accepted )and FRR (Number of images falsely rejected) are standard measure for checking the performance and feasibility of the system . The result of WBC segmentation using Image Arithmetic and Global Threshold mean shift. Total no. Of images tested 110. Result is shown using FRR and FAR value.
FAR and FRR using Mean shift
FRR = 2/110
FAR=18/110
Accuracy = 99.8545
FAR and FRR using Image Arithmetic and Global Threshold:
FRR = 3/110
FAR=15/110
[image:3.612.336.576.138.549.2]Accuracy= 99.89090
Figure 1: The of step consist if Image Arithmetic and Global Threshold
Original Image
Grey scale Image
Adjust Image intensity L
Histogram Equalization H
Image Addition R1
Image Substation R2
Image Addition R3
Minimum Filter
Global Threshold
International Journal of Emerging Technology and Advanced Engineering
Website: www.ijetae.com (ISSN 2250-2459, ISO 9001:2008 Certified Journal, Volume 3, Issue 6, June 2013)
[image:4.612.58.276.307.548.2]642
Figure 2: Graph showing accuracy between Mean shift and proposed method
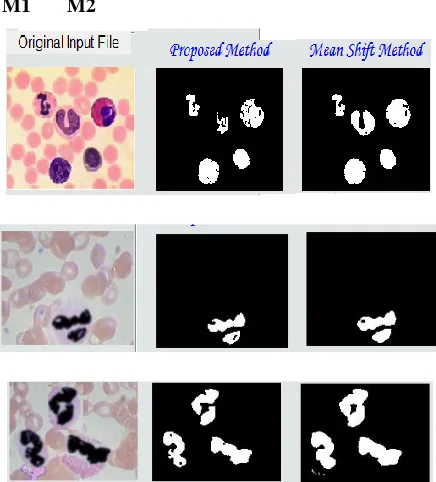
M1 M2
Figure 3: Comparison of segmentation method. Three different input images with the following methods. M1: Image Arithmetic and Global
Threshold .M2:
The Mean Shift Experimental Analysis indicates that accuracy of the system mainly depends on the quality of lung image. If blood smear image will be of poor quality edge detection of WBC cell becomes difficult reducing the performance of the system. It is observed that if all lung images will be of high quality 100% accuracy can be achieved.
Mean shift algorithm is totally depends upon the bandwidth which we have selected and in proposed method there is no need to select bandwidth.
Performance of the system has been evaluated by FAR and FRR. If the number of WBC cells are more than 2 then the computational time require for mean shift is more as compared to proposed method because the in mean shift method every time mean is calculated until convergence. Then clustering is done. So that time required for the execution for mean shift is more as compared to proposed Method.
It can be observed from the above result and calculation that accuracy of the system by mean shift method and proposed method is which shows that proposed method gives better result than mean shift method.
V. CONCLUSION
The main issue for such system is to perfectly segmentation of white blood cells in the image and distinguish it from the other parts of the image. The nucleus information can give valuable information about whether the cell is a blast or normal cell. This study introduces a method for white blood cell nucleus segmentation as a first step towards a fully automatic system for leukemia diagnosis and classification using peripheral blood microscope image. White blood cell segmentation is the key procedure in the automatic leukemia diagnosis system. Mean shift give the best result as compare to Image Arithmetic and Global Threshold as the mean shift method is highly depend on the bandwidth which we selected. The experimental results show that the MS filter can successfully remove noise from the WBC images while preserving the edges. Finally, it can be seen that the effectiveness of the segmented images highly depends on the selected bandwidth. In the future works, an automatic method of selecting the suitable bandwidth must be developed.
REFERENCES
[1] http://en.wikipedia.org/wiki/Blood
[2] JumaAl-Muhairy, Yousef Al-Assaf,” Automatic white blood cell segmentation based on image processing”,IFAC, 2005
[3] http://en.wikipedia.org/wiki/Anemia
[4] http://en.wikipedia.org/wiki/Agglutination_(biology)
[5] R. Safabakhsh, F. Zamani ,” A Robust Multi- Orientation Gabor Based System for Discriminatin Touching White and Red Cells in Microscopic Blood Image “, Computer Engineering and IT Dpt, AmirKabirUniversity of Tech, IEEE, 2003
[6] HieuTat Nguyen,Marcel Worring,Rein van denBoomgaard,” Watersnakes: Energy-Driven Watershed Segmentation”, IEEE TRANSACTIONS ,2003
[7] Couprie M., Bertrand G., Topological Greyscale Watershed Transformation, proceedings of the V SPIE conference on Vision Geometry, San Diego, USA, July 1997, Vol.3168, pp 136-146
99.82
99.84
99.86
99.88
99.9
Mean Shift
Proposed
International Journal of Emerging Technology and Advanced Engineering
Website: www.ijetae.com (ISSN 2250-2459, ISO 9001:2008 Certified Journal, Volume 3, Issue 6, June 2013)
643
[8] Jaesang Park and James M. Keller,” Snakes on the Watershed”, IEEE TRANSACTIONS, 2001
[9] Laurent Najman and Michel Couprie,”Watershed algorithms and contrast preservation”, France, 2003
[10] Cecilia Di Ruberto, Andrew Dempster, Shahid Khan, Bill Jarra,” segmentation of blood image using morphological”,IEEE,2000
[11] B.Ravi Kumar, Danny K Joseph,T.V Sreenivas,” Teager energy based energy based blood cell segmentation”, IEEE, 2002