International Journal of Emerging Technology and Advanced Engineering
Website: www.ijetae.com (ISSN 2250-2459,ISO 9001:2008 Certified Journal, Volume 3, Issue 6, June 2013)
394
Investigation of Methods for Bending Rectangular Glass Plate
into Parabolic Shape by Using FEA
Manoj S. Patil
1, Prof. P. N.Ulhe
2, Prof. Dr. D. S. Deshmukh
31
M.E. Student, 2Guide and Assistant Professor, 3Head of Department, S.S.B.T’s College of Engineering Bambhori, Jalgaon (M.S.), North Maharashtra University, Jalgaon, India
Abstract— In the dissertation, structural Finite Element Analysis is carried out. Both linear and non linear analysis is considered for the investigation. Geometry non linearity, material non linearity and boundary non linearity also called as contact analysis is considered. All the boundary conditions, loadings, material definitions considered are real in nature. Experimental validations are considered in order to validate results of finite element analysis. This validation to the FEA results gives great confidence to the investigation progress.
Keywords— Finite Element Analysis, Hypermesh,
Parabolic Deflection of Plate, Dynamic Loading, Ultimate
strength, Matlab.
I. INTRODUCTION
Investigation of methods for bending of rectangular glass plate into parabolic shape by using FEA is done for the solar collector. In recent days and upcoming centuries the problems regarding Global warming will be serious issues. The most of responsible factors for the global warming are the coal and diesel power plants. But the power plants are the major necessary factor for the human life as recent world is about to incomplete without electricity. So considering these factors there is best alternative of use of Non conventional energy resources. The major non-conventional energy available on earth is Solar Energy. Solar energy has enormous heat energy that can be use to generate the electricity. Recently there is lot of developments in this field and lots of solar power plants are about to born.
The solar collector used for small power generation in malls etc. is parabolic solar collectors, as the parabola is the efficient curve for concentrate maximum radiations. This uses the aluminum plates bent in parabolic shape. As the aluminum has higher reflectivity and better yielding properties than other materials, these are widely used. But aluminum does not have 100% reflectivity. So this drawback can be removing by using material close or equal to 100% reflectivity which is nothing but the mirror. The mirror has 100% reflectivity, which can concentrate total radiations fall on it at particular location. But mirror has poor yielding properties which causes the brittle failure of it. But can be sustained yielding up to some extent.
If the parabolic shape is not perfect then the radiations cannot be able to concentrate at its focal distance and the radiations deviates from it.
This causes loss of radiations indirectly the loss of power. In recent days the method of bending of glass uses sand as a dead weight. The problem occurs when obtained shape is not perfectly parabolic.
This project is based on the study of behavior of glass under bending at ambient conditions and method of bending it, which forms perfect parabolic profile and can be used as solar collector to work it at higher efficiency.
II. INTRODUCTION OF THE PLATE
Plates are straight, flat and non-curved surface structures whose thickness is slight compared to their other dimensions. Generally plates are subjected to load conditions that cause deflections transverse to the plate. Geometrically they are bound either by straight or curved lines. Plates have free, simply supported or fixed boundary conditions. The static or dynamic loads carried by plates are predominantly perpendicular to the plate surface. The load carrying action of plates resembles that of beams or cables to a certain extent. Hence plates can be approximated by a grid work of beams or by a network of cables, depending on the flexural rigidity of the structures. Plates are of wide use in engineering industry. Nowadays, plates are generally used in architectural structures, bridges, hydraulic structures, pavements, containers, airplanes, missiles, ships, instruments and machine parts.
Plates are usually subdivided based on their structural action as
1. Stiff Plates, which are thin plates with flexural rigidity and carry the loads two dimensionally. In engineering practice, a plate is understood as a stiff plate unless specified
2. Membranes, which are thin plates without flexural rigidity and carry the lateral loads by axial shear forces. This load carrying action is approximated by a network of stressed cables since their moment resistance is of a negligible order of magnitude. 3. Flexible Plates, which represent a combination of
stiff plates and membranes. They carry external loads by the combined action of internal moments and transverse shear forces.
International Journal of Emerging Technology and Advanced Engineering
Website: www.ijetae.com (ISSN 2250-2459,ISO 9001:2008 Certified Journal, Volume 3, Issue 6, June 2013)
395 Equation of the plate
There were many plate theories formulated after the Euler–Bernoulli beam theory was proposed. The Euler– Bernoulli beam theory also known as the engineer's beam theory is a simplification of the linear theory which provides a means of calculating the load-carrying and deflection characteristics of beams. Of the numerous plate theories that have been developed since the late 19th century, two are widely accepted and used in engineering. They are:
Tithe Kirchhoff–Love theory of plates (classical plate theory)
The Mindlin–Reissner theory of plates (first-order shear plate theory)
According to Kirchhoff, the assumptions were made considering a mid-surface plane which helps in representing a three dimensional plate in two dimensional form.
The basic assumptions according to Kirchhoff are:
1. The normal lines (straight lines perpendicular to the flat surface) remain straight after deformation.
2. The normal remain the same length (un stretched). 3. The normal always remain at right angles to the mid
surface after deformation
The plate equation is derived by assuming that plate is subjected to lateral forces and the following three equilibrium equations are used.
∑ Mx = 0 ………..………..…………3.1 ∑ My = 0 ………...….3.2
∑ Pz = 0 ………...…..3.3
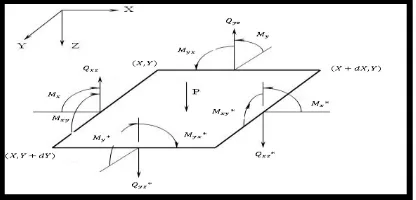
[image:2.595.56.264.655.755.2]Where, Mx and My are the bending moments and Pz is the external load. The external load Pz is carried by the transverse shear forces Qx, Qy and bending moments Mx, My. The plates generally have significant deviation from the beams and it is due to the presence of twisting moment Mxy. In general in the theory of plates it is necessary to deal with the internal forces and moments per unit length of the middle surface. The procedure involved in forming the differential equation of the plate in equilibrium is selecting the coordinate system and draw the sketch of the plate element and showing all the internal forces by positive and negative thereby expressing them in Taylor’s series.
Figure 1: Stress Resultants of the plate
……..………3.4
.………3.5
….. ..…….3.6
...…………3.7
……….……….3.8
..……….…….3.9
………….……….3.10
………...3.11
…………..………..3.12
The condition of a vanishing resultant force in the z direction results in the following equation
………3.13
…..………3.14
If the resultant moment about an edge parallel to the X and Y axes is set to zero then the resulting equation after neglecting the higher order terms gives
………3.15
………..3.16
Substituting Eq. (3.15) and Eq. (3.16) in Eq. (3.14) gives
….………3.17
Now substituting Eq. (3.4), Eq. (3.5) and Eq. (3.6) in the above equation yields the differential equation of the plate subjected to lateral loads
……….……3.18
International Journal of Emerging Technology and Advanced Engineering
Website: www.ijetae.com (ISSN 2250-2459,ISO 9001:2008 Certified Journal, Volume 3, Issue 6, June 2013)
396 Where,
………3.20 And,
Where,
D- Flexural rigidity of the plate E- Young’s modulus of the plate h- Height of the plate
ν- Poisson’s ratio
Boundary Conditions of the Plate
Generally, there are different types of boundaries considered for a plate in terms of lateral deflection of the middle surface of the plate and they are:
1. Clamped edge Conditions
2. Simply Supported edge Conditions 3. Mixed edge Conditions
4. Free edge Conditions
Parabolic Deflection of Plate
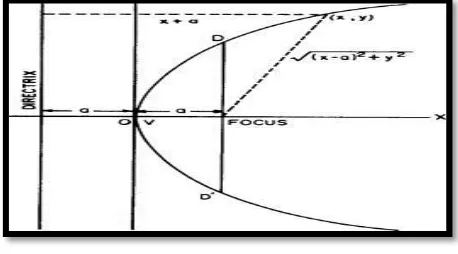
[image:3.595.313.548.123.244.2]A parabola is the locus of all points in a plane equidistant from a fixed point, called the focus, and a fixed line, called the directrix. In the parabola shown in figure 3.2, point V, which lies halfway between the focus and the directrix, is called the vertex of the parabola. In this figure and in many of the parabolas discussed in the first portion of this section, the vertex of the parabola falls at the origin; however, the vertex of the parabola, like the centre of the circle, can fall at any point in the plane.
Figure 2: The Parabola of focus on x axis
The equation of parabola shown in fig 3.2 is y2= 4ax
Figure 3: The Parabola of focus on y axis
The equation of parabola shown in fig 3.3 is x2 = 4ay. In this project we are considering equation as per fig 3.3. Here two parabolic mirrored plate forms one complete parabola of solar collector. In this project we are considering only mirrored plate 1 as shown in fig 3.3 as other side is symmetry. After bending the mirrored plate, combining of two it will form the one parabola. So the main objective is to bend the mirrored plate for half of the original parabolic shape.
III. FINITE ELEMENT ANALYSIS Types of Analysis
There are basically two types of analysis linear analysis and nonlinear analysis. When structural response i.e. deformation, stress and strain are linearly proportional to the magnitude of load then the analysis of such a structure is known as linear analysis. When the load to response relationship is not linearly proportional, then the analysis falls under nonlinear analysis.
E.g. when a compact structure made of stiff metal is subjected to the load with relatively lower in magnitude as compared to load strength of the material, the deformation in the structure will be linearly proportional to the load and structure is known to have subjected to the linear static deformation but if it is not like that then that structure is known to have subjected to the nonlinear static deformation.
[image:3.595.47.276.522.649.2]International Journal of Emerging Technology and Advanced Engineering
Website: www.ijetae.com (ISSN 2250-2459,ISO 9001:2008 Certified Journal, Volume 3, Issue 6, June 2013)
397 These changes are accommodated into the analysis by rebuilding the stiffness matrix using deformed structure configuration and updated property after each incremental load application.
There are three basic types of nonlinear analysis: 1. Geometric nonlinear (large displacements) 2. Material nonlinearity.
3. Boundary nonlinearities. (contact/gaps)
Geometric Nonlinearities
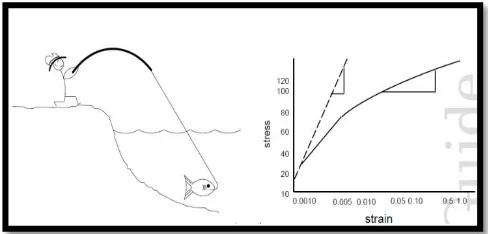
What is geometric nonlinearity? A fishing rod is the classic example of a familiar structure that is bending so dramatically that this behavior is obvious, and it fits into the definition of geometric nonlinearity, that is, a situation where the displacement does not have a straight-line response to the applied loads. It also has very large displacements and rotations.
[image:4.595.316.545.196.298.2]Stiffness changes due to geometric deformations are categorized as geometric nonlinearities.
Figure 4: Comparison of linear and nonlinear Response
Following are the different kinds of geometric nonlinearities.
a. Large strain:
If an elements shape changes i.e. area, thickness etc., its individual element stiffness will change.
b. Large rotation:
If an elements orientation changes i.e. rotation, the transformation of its local stiffness in to global component will change.
c. Stress stiffening:
This is associated with the tension bending coupling. The more the tension in the membrane, more it’s bending rigidity or stiffness. If an elements strain produce a significant in-plane stress state i.e. membrane stresses, the out-of-plane stiffness can be significantly affected.
Material nonlinearity
All engineering materials are inherently nonlinear as it is not feasible to characterize a nonlinear material by a single constitutive law for the entire range of environment conditions such as loading, temperature and rate of deformation.
We can idealize or simplify the material behavior to account for only certain effects which are important for the analysis.
[image:4.595.47.291.346.463.2]The linear elastic, material assumption is the simplest of all. The material is nonlinear elastic if the deformation is recoverable and plastic if it is irrecoverable.
Figure 5: Comparison of material linearity and nonlinearity
Boundary nonlinearities
Boundary nonlinearity arises when boundary conditions in a FE model changes during the course of the analysis. The boundary conditions could be added to or removed from the model due to boundary nonlinearity as the analysis progresses. This kind of nonlinearity typically involves contact sets in the model which could get engaged or disengaged as a response to applied loads. The load transfer mechanism via contact pair is complicated phenomenon. Researchers have developed several theories to describe load transfer via contact sets. As the bending of the mirrored plate under consideration has large deformation in bending, the analysis of the plate falls under the category of stress stiffening nonlinear geometrical analysis.
Analysis of the mirrored plate is carried out in the Hypermesh11.0 software. This software is best software for pre-processing. For solving the boundary conditions Radioss software is used. This software gives best results for the Geometrical nonlinear analysis and this software is very compatible with the Hypermesh. For post-processing Hyperview software is used, as Hyperview is the best post-processor used now days.
These all three software’s are form the same family of Altair so these are very best compatible with each other. Three softwares are used during the completion of the project.
IV. DETAILS OF ANALYSIS
Defining the support condition
International Journal of Emerging Technology and Advanced Engineering
Website: www.ijetae.com (ISSN 2250-2459,ISO 9001:2008 Certified Journal, Volume 3, Issue 6, June 2013)
[image:5.595.315.544.101.347.2]398 Figure 6: Actual deflection of beam
Analytically if, F=1000 N, beam span L= 0.5m, C/S area A= 10*10 mm2, E= 2.1 e+05 N/mm2. Then the deflection can be calculates as the mathematical formulae
δ = FL3/48EI, this gives, δ= 14.88 mm
[image:5.595.55.275.101.213.2]This type of constraints is not possible to solve by the FEA analysis. So this is slightly modified as follows
Figure 7: Actual FEA model
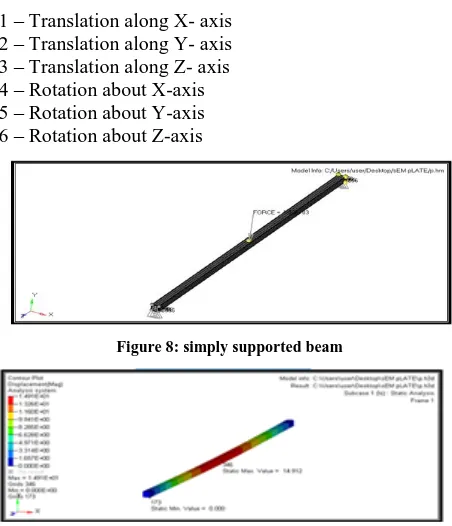
This type of analysis can be validated as follows by the FEA software Hypermesh 11.0 This can be done by fixing all DOF except one rotation of left support and open the horizontal DOF and rotation along one axis of right support. The details are given as follows. In Hypermesh software the DOF designated By 1, 2, 3, 4, 5, 6. These are as follows:
[image:5.595.51.281.290.393.2]1 – Translation along X- axis 2 – Translation along Y- axis 3 – Translation along Z- axis 4 – Rotation about X-axis 5 – Rotation about Y-axis 6 – Rotation about Z-axis
Figure 8: simply supported beam
Figure 9: Static Deflection
Figure 10: Left end support
Figure 11: Right End support
As discussed above it shows support conditions. The deflection results obtained from the analysis is 14.91mm and we got the value 14.88 mm analytically. So from this we got clear idea that the constraints we are going to use for analysis of plate will produce the exact solution which can be match with analytical results. So this types of constrain should must apply for analysis of plate.
A. Verifying the properties of mirrored glass and validation of software results to the practical results:
The properties that are considered are on the base of the literatures. But it is necessary to verify those properties which relates to the strength of the material, as mirror is categorized as a brittle material. And as we are using the software we must have to check that it is giving the proper results which are closely relates with the practical results.
So to verify this small experiment has conducted on a mirrored plate. The detail description report of the experiment is given below.
Experiment: Stage1:
[image:5.595.49.275.476.739.2]International Journal of Emerging Technology and Advanced Engineering
Website: www.ijetae.com (ISSN 2250-2459,ISO 9001:2008 Certified Journal, Volume 3, Issue 6, June 2013)
399
[image:6.595.47.281.94.623.2]Experimental Setup:
Figure 12: Experimental setup
FEM Setup:
[image:6.595.314.546.343.626.2]Figure 13: Finite Element model
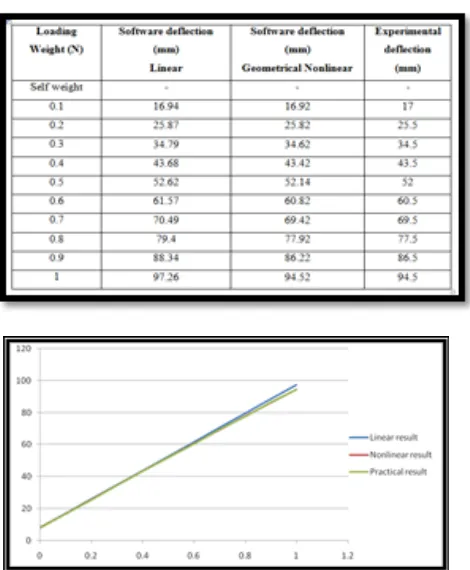
Table I
Comparison of experimental and software results
Graph 1: Comparison of software and practical results
After performing this experiment the conclusion over this is the properties we have consider while analysis i.e. E= 70 GPa and poisons ratio = 0.2 results close to the practical values so the software is perfectly compatible for this analysis. The Load and deflection is linearly varying so it also concludes that the material properties of the mirrored plate are linearly varying.
As deflection of the plate gives same results in analysis and practical, we can concludes that the stresses value induced practically must be same as software values.
This will help to finding out the ultimate strength of the mirrored plate.
B. Finding Ultimate strength of the mirrored plate
To design the glass structure it is said that the factor of safety under consideration while designing is must be at least 2. So we must have to know the exact ultimate strength of the mirrored plate. So to finding out it a small experiment has conducted which is explained below.
As deflection results are perfectly matching with the practical values, stress level must be same as software value shows. So to finding out ultimate strength of the
glass, practically some load is applied in steps until glass breaks. And then same load is applied on same model and got the stress level for that particular load which tends to break the glass.
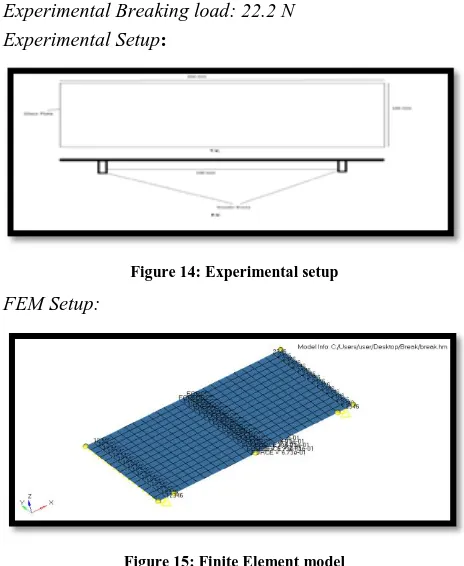
Specimen specification: : 250mm * 145mm mirror plate, thickness = 1 mm , E= 70 Gpa, poisons ratio = 0.2 , Density = 2.5*10-9 Tons/mm3,
Experimental Breaking load: 22.2 N Experimental Setup:
Figure 14: Experimental setup
FEM Setup:
Figure 15: Finite Element model
[image:6.595.49.279.401.635.2]The results obtained by software considering 22.2N as a load: Deflection
[image:6.595.319.546.661.748.2]International Journal of Emerging Technology and Advanced Engineering
Website: www.ijetae.com (ISSN 2250-2459,ISO 9001:2008 Certified Journal, Volume 3, Issue 6, June 2013)
400
[image:7.595.47.279.127.221.2]Stress:
Figure 17: FEA stress results
The stress value got from the software after applying the 22.2 N load is 51.77 N/mm2. So we can consider the ultimate strength of the glass is 50 Mpa.
So finally the properties of glass used for analysis are finalizes as:
Modulus of elasticity E = 70 Gpa. Poisson’s ratio = 0.2
Density = 2.5e-09 Tons/mm3 Ultimate strength U = 50 Mpa.
C. Defining Geometrical nonlinearity
As bending of the mirrored plate is categorized as large deflection compared to the thickness of the mirror. So there may be chances of the geometric nonlinearity. The result obtained from the linear analysis may not validate with the practical result due to this geometric nonlinearity. So we must have to check that up to which extend the results may vary due to this kind of nonlinearity. For this a small experiment has conducted which is explained below.
Experiment:
Specimen specification: 500mm*10mm mirror plate, thickness =21 mm , E= 70 Gpa, poisons ratio = 0.2 , Density = 2.5*10-9 Tons/mm3. , force applied as line distributed at end of plate parallel to support.
Experimental Setup:
Figure 18: Experimental setup
[image:7.595.318.553.141.426.2]Software Setup:
Figure 19: Finite Element model
Table II
Comparison of linear and nonlinear results
Graph 2: Result comparison of linear, nonlinear, and practical values of deformation
V. CONCLUSION
After performing the experiment for the validation of geometrical nonlinearity it is observed that, after 60 mm deflection actual effect of the nonlinearity is observed as it differs the linear and nonlinear results above 1 mm and the experimental results are matching with the software results.
So this concludes that Geometrical nonlinearity must have to take under consideration during whole analysis process. Research is in progress considering nonlinearity Parameters of glass plate.
REFERENCES
[1] C B. Dolicanin, V.B.Nikolic and D.C. Dolicanin (2011),
“Application of Finite Difference Method to Study of the Phenomenon in the Theory of Thin Plates”.
[2] Ali Ergun and Nahit Kumbasar (2011), “A new approach of
improved finite difference scheme on plate bending analysis”.
[3] Debabrata Das, Prasanta Sahoo, Kashinath Saha; “study of static
behaviour of thin isotropic skew plates under uniformly distributed load for various mixed flexural boundary conditions.”
[4] Allan Okodi, Yasin N. Ziraba, Jackson A. “Approximate Large
Deflection Analysis of Thin Rectangular Plates under Distributed Lateral Line Load”.
[5] J. N. Reddy· and E. J. Barbero “A Plate bending element based
on a generalized laminated plate theory”.
[6] Yos Sompornjaroensuk and Kraiwood Kiattikomol, “Bending
[image:7.595.49.282.554.767.2]International Journal of Emerging Technology and Advanced Engineering
Website: www.ijetae.com (ISSN 2250-2459,ISO 9001:2008 Certified Journal, Volume 3, Issue 6, June 2013)
401
[7] M. Cetkovic, Dj. Vuksanovic 2011, “Geometrically nonlinear
analysis of laminated composite plates using a layerwise displacement model”
[8] Finite element Analysis Theory by R.D. Cook.
[9] Finite Element Analysis by David Roylance.
[10] Introduction to Finite Element in Engineering by T.R.
Chandrupatala, A.D. Belegundu.
AUTHOR PROFILE
Mr. Manoj S. Patil received his BE