Journal of Chemical and Pharmaceutical Research, 2015, 7(8):560-567
Research Article
CODEN(USA) : JCPRC5
ISSN : 0975-7384
560
IL-1
β
, IL-1Ra and IL-18 gene variants in type 2 diabetes
Madhukar Saxena
1, Neena Srivastava
2* and Monisha Banerjee
3#Molecular & Human Genetics Laboratory, Department of Zoology, University of Lucknow, Lucknow, Uttar Pradesh, India
*Department of Physiology, King George's Medical University, Lucknow, Uttar Pradesh, India
1Present address: Department of Biotechnology, Babasaheb Bhimrao Ambedkar University (A Central University) Vidya Vihar, Rai Bareilly Road, Lucknow, Uttar Pradesh, India.
_____________________________________________________________________________________________
ABSTRACT
Type 2 diabetes mellitus (T2DM) is a complex disease characterized by elevated systemic glucose concentrations. Multiple loci pre-disposing to T2DM have emerged from genome-wide association studies. The IL-1 family consists of two pro-inflammatory cytokines viz. IL-1α, IL-1β and a naturally occurring anti-inflammatory agent, IL-1 receptor antagonist (IL-1Ra or IL-1RN). It is known fact that prolonged exposure of human islets to high glucose trigger IL-1β production by β-cells themselves leading to nuclear factor activation and upregulation of Fas signaling thus triggering “autocrine apoptosis”. IL-18 is closely related to IL-1β in structure and in the requirement of caspase-1 to cleave its precursor into an active cytokine. DNA was isolated from venous blood samples, quantified and subjected to Polymerase Chain Reaction-Restriction Fragment Length Polymorphism using suitable primers and restriction endonucleases. The genotypic, allelic and carriage rate frequencies were analyzed for three genetic variants IL-1β (-511 C/T), IL-18 (-607 A/C) and IL-1Ra VNTR (intron 2) in patients and controls using SPSS software. Odd ratios (OR) with 95% confidence interval (CI) was determined to describe the strength of association by logistic regression model. All studied SNPs showed significant association (P<0.001) with occurrence of T2DM and biochemical parameters as well. However, in haplotypic analysis, none of the combinations of alleles showed significant association. Interestingly, it was observed that alleles I and II of IL-1Ra might be involved in T2DM predisposition. The study will probably increase our insight into the proposed impact of IL-1 in the development and/or progression of T2DM and its susceptibility in North-Indian population.
Key words: IL-1β, IL-1Ra, IL-18, SNP, Type 2 Diabetes, PCR- RFLP, North Indian Population
_____________________________________________________________________________________________
INTRODUCTION
561
cytokine genes may be important candidates with implications in pathogenesis of T2DM and associated complications.
IL-18 is a unique member of IL-1 family encoded by a gene at the diabetes susceptibility locus, Idd2 located on chromosome 11q22.2-22.3 [7]. It is closely related to IL-1β in structure and in the requirement of caspase-1 to cleave its precursor into an active cytokine. Insulin-producing islet β-cells secrete IL-18 and induce IFNγ in T cells [8]. Plasma IL-18 levels have been reported to be elevated in T2DM patients and children [9-11] and is independent of the major determinants of metabolic syndrome viz. obesity and insulin resistance [12]. IL-18 is a potent pro-inflammatory cytokine highly expressed in atherosclerotic plaques and play a role early in the pro-inflammatory cascade and also in plaque destabilization [13]. The study will probably increase our insight into the proposed impact of
IL-1β, IL-1Ra and IL-18 gene variants in the development and/or progression of T2DM.
EXPERIMENTAL SECTION
Patient selection and clinical evaluation
Type 2 diabetes patients were enrolled from the outpatient Diabetes Clinic of King George’s Medical University (KGMU), Lucknow, India under the supervision of expert clinicians. Age/sex-matched normal controls were screened from healthy staff members of both universities. The study was conducted after due approval of Institutional Ethics Committee and written consent from all subjects. Controls showing a normal oral glucose tolerance test were included in the study whereas those having a history of coronary artery disease or other metabolic disorders were excluded. Subjects with fasting glucose (F) concentrations ≥126 mg/dl or 2-h post prandial (PP) glucose concentrations ≥200 mg/dl were categorized in the diabetes group [14]. Estimations of plasma glucose (mg/dl), serum insulin (mg/dl) and lipid profile viz. Total Cholesterol (TC), Triglycerides (TGL), High Density Lipoproteins (HDL) and Serum Creatinine (SCRT) were done using commercially available Ecoline kits from Merck by UV-vis double beam spectrophotometer (Shimadzu, Japan). Low Density Lipoproteins (LDL) and Very Low Density Lipoproteins (VLDL) were calculated by known formulae [15]. Height, weight and waist circumference were measured to calculate body mass index (BMI) and waist hip ratio (WHR). Clinical details of patients and controls were recorded.
DNA extraction and genotyping
Genomic DNA was extracted from peripheral blood mononuclear cells (PBMCs) using salting out method with slight modifications [14, 16]. Variable Number of Tandem Repeat (VNTR) of IL-1Ra (Intron 2) were genotyped by polymerase chain reaction (PCR). Polymerase chain reaction (PCR) was performed with forward 5’- CTCAGCAACACTCCTAT- 3’ and reverse 5’- TCCTGGTCTGCAGGTAA- 3’ primers at 600C annealing temperature and 35 cycles. The VNTRs were analyzed in 2.0% agarose gels. The two SNPs, IL-1β-511 C/T (rs16944) and IL-18-607 A/C (rs1946518) were amplified and genotyped by polymerase chain reaction-restriction fragment length polymorphism (PCR-RFLP). The primers for rs16944 and rs1946518 were forward 5’-TGGCATTGATCTGGTTCATC-3’/reverse 5’-GTTTAGGAATCTTCCCACTT-3’ and forward 5’-CTTTGCTATCATTCCAGGAA- 3’/reverse 5’-TAACCTCATTCAGGACTTCC-3’ respectively. The 15µl reaction mixture contained 100 ng of template DNA, buffer (100 mM Tris, pH 9.0; 500 mM KCl; 15 mM MgCl2; 0.1%
gelatin), 200µM dNTP, 10 pmol of each primer and 1.0 unit Taq DNA polymerase. The PCR products were digested with restriction enzymes SacI and MseI (Fermentas, USA) respectively and electrophoresed on a 12.5% polyacrylamide gel (Figure 1). To ensure the quality of genotyping, random duplicates of 20% samples were performed and 98% concordance was found.
Statistical analysis
_____________________________________________________________________________________
562
RESULTS
In case of IL-1β polymorphism, allele ‘C’ corresponded to 304 bp and allele ‘T’ to 189, 116 bp products. However,
[image:3.595.115.481.278.699.2]in IL-18, allele ‘C’ corresponded to 199, 70 bp and allele ‘A’ to 101/98, 70 bp products. Four alleles were observed in our population in case of IL-1Ra polymorphism having 4, 2, 5 and 3 repeats of 86 bp with product sizes of 410, 240, 500 and 325 bp designated as alleles I, II, III and IV. The gel pictures showing genotypes of IL-1β, IL-1Ra and IL-18 are shown in Figure 1. IL-1β-511 C/T polymorphism showed genotypic association (P<0.001) but no allelic association. Most subjects were homozygous wild type ‘TT’, while ‘CC’ genotype was rare (14.81 and 4.12% in controls and T2DM patients respectively). Allele frequencies of ‘C’ and ‘T’ were almost same in controls and T2DM patients (Table 1). The carriage rate of C (+), C (-) and T (+), T (-) showed significant association with T2DM when compared to controls (P=0.047 and P=0.001 respectively) (Table 1). All allele and genotype frequencies were found to be in Hardy-Weinberg equilibrium.
Table 1: Genotypic, allelic and carriage rate frequencies of IL-1β-511 C/T, IL-1Ra and IL-18-607 A/C gene polymorphisms in healthy controls and T2DM cases.
Genotype frequencies
Genotypes Controls (n=189) Patients (n=194, *248) P-value
IL-1β-511 C/T
CC 28 (14.81) 8 (4.12)
<0.001
CT 37 (19.58) 78 (40.21)
TT 124 (65.61) 108 (55.67)
IL-1Ra (Intron 2)*
I/I 124 (65.61) 156 (62.9)
0.003
II/II 7 (3.7) 37 (14.92)
IV/IV 1 (0.53) 1 (0.4)
I/II 53 (28.04) 49 (19.76)
II/III 2 (1.06) 1 (0.4)
I/III 2 (1.06) 4 (1.62)
IL-18-607 A/C
AA 3 (1.59) 11 (5.67)
0.002
AC 142 (75.13) 115 (59.28)
CC 44 (23.28) 68 (35.05)
Allele Frequencies
Alleles Controls (n=378)
Patients
(n=388, *496) P-value Odd’s Ratio CI (95%)
IL-1β-511 C/T C 93 (24.6) 94 (24.23)
0.904 1.021 (0.734-1.419)
T 285 (75.4) 294 (75.77)
IL-1Ra (Intron 2)* I 303 (80.16) 365 (73.59)
0.061 1.311 (0.987-1.740)
II 69 (18.25) 124 (25)
III 4 (1.06) 5 (1)
IV 2 (0.53) 2 (0.41)
IL-18-607 A/C A 148 (39.15) 137 (35.31
0.271 1.179 (0.879-1.581) C 230 (60.85) 251 (64.69)
Carriage Rate
Controls (n=189)
Patients
(n=194, *248) P-value Odd’s Ratio CI (95%)
IL-1β-511 C/T
C (+) 65 (34.39) 86 (44.33)
0.047 0.658 (0.436-0.995) C (-) 124 (65.61) 108 (55.67)
T (+) 161 (85.19) 186 (95.88)
0.001 0.247 (0.110-0.558) T (-) 28 (14.81) 8 (4.12)
IL-1Ra (Intron 2)*
I (+) 179 (94.71) 209 (84.27)
0.001 3.340 (1.621-6.881) I (-) 10 (5.29) 39 (15.73)
II (+) 62 (32.8) 87 (35.08)
0.619 0.903 (0.603-1.348) II (-) 127 (67.2) 161 (64.92)
III (+) 4 (2.12) 5 (2.02)
0.942 1.051 (0.278-3.968) III (-) 185 (97.88) 243 (97.98)
IV (+) 1 (0.53) 1 (0.4)
0.847 1.314 (0.082-21.141) IV (-) 188 (99.47) 247 (99.6)
IL-18-607 A/C
A (+) 145 (76.72) 126 (64.95)
0.012 1.778 (1.136-2.784) A (-) 44 (23.28) 68 (35.05)
C (+) 186 (98.41) 183 (94.33)
0.046 3.727 (1.023-13.579)
563
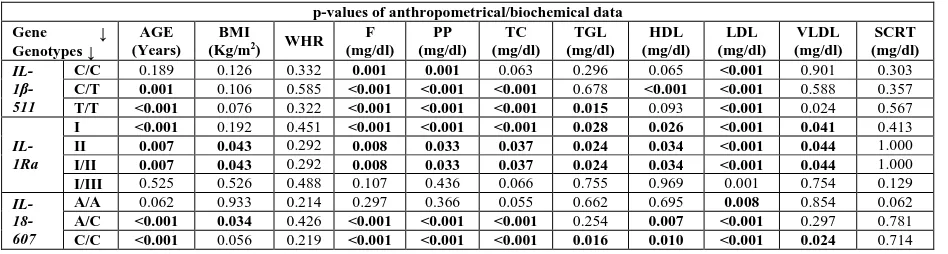
Table 2: Association of anthropometrical/biochemical parameters with IL-1β-511 C/T, IL-1Ra and IL-18-607 A/C genotypes in controls and T2DM cases
p-values of anthropometrical/biochemical data Gene ↓
Genotypes ↓
AGE (Years)
BMI
(Kg/m2) WHR (mg/dl) F (mg/dl) PP (mg/dl) TC (mg/dl) TGL (mg/dl) HDL (mg/dl) LDL (mg/dl) VLDL (mg/dl) SCRT
IL- 1β-511
C/C 0.189 0.126 0.332 0.001 0.001 0.063 0.296 0.065 <0.001 0.901 0.303
C/T 0.001 0.106 0.585 <0.001 <0.001 <0.001 0.678 <0.001 <0.001 0.588 0.357
T/T <0.001 0.076 0.322 <0.001 <0.001 <0.001 0.015 0.093 <0.001 0.024 0.567
IL-1Ra
I <0.001 0.192 0.451 <0.001 <0.001 <0.001 0.028 0.026 <0.001 0.041 0.413
II 0.007 0.043 0.292 0.008 0.033 0.037 0.024 0.034 <0.001 0.044 1.000
I/II 0.007 0.043 0.292 0.008 0.033 0.037 0.024 0.034 <0.001 0.044 1.000
I/III 0.525 0.526 0.488 0.107 0.436 0.066 0.755 0.969 0.001 0.754 0.129
IL- 18-607
A/A 0.062 0.933 0.214 0.297 0.366 0.055 0.662 0.695 0.008 0.854 0.062
A/C <0.001 0.034 0.426 <0.001 <0.001 <0.001 0.254 0.007 <0.001 0.297 0.781
[image:4.595.64.538.134.261.2]C/C <0.001 0.056 0.219 <0.001 <0.001 <0.001 0.016 0.010 <0.001 0.024 0.714
Table 3: Association of SNPs in different candidate genes (IL-1β-511 C/T, IL-1Ra and IL-18-607 A/C) with T2DM in North Indian population
T2DM (freq) Control (freq) χ2 Pearson's P Odds Ratio [95%CI] C I C* 10.62(0.027) 14.96(0.040) 0.842 0.358 0.689 [0.310-1.533]
C II A* 22.42(0.058) 32.57(0.086) 2.214 0.136 0.656 [0.375-1.147]
C II C* 53.42(0.138) 39.58(0.105) 2.092 0.148 1.381 [0.890-2.142]
T I A* 16.89(0.044) 23.82(0.063) 1.375 0.240 0.683 [0.360-1.296]
T II C* 40.94(0.106) 27.32(0.072) 2.740 0.097 1.531 [0.922-2.542]
T II A* 90.13(0.232) 85.72(0.227) 0.063 0.801 1.044 [0.745-1.465]
T II C* 141.03(0.363) 145.14(0.384) 0.243 0.622 0.928 [0.691-1.247]
Global --- --- 8.681 0.192 ---
Multivariate logistic regression analysis for association of genotypes with biochemical parameters brought forth some interesting results. We found that the subjects with ‘CC’ genotype showed significant association with F, PP and LDL (P=0.001; 0.001 and <0.001 respectively). In case of ‘CT’ and ‘TT’ subjects significant association was observed with age, F, PP, TC, HDL and LDL (P<0.001). In addition, ‘TT’ genotypes also showed significant association with TGL and VLDL (P<0.001) (Table 2). No significant association was observed with BMI, WHR and SCRT (P>0.05).
Genotypic association of IL-1Ra was observed in the present study (P=0.003) but no allelic association. Genotypes II/III and IV were found to be rare in both controls and T2DM patients. Most subjects were homozygous I/I in the study population. Allele frequencies of I and II were slightly different in controls and T2DM patients but not significant (Table 1). The carriage rate of allele I (+) and (-) showed significant association (P=0.001; OR 3.340; CI 1.621-6.881) with T2DM when compared to controls (Table 1).
The association of genotypes with biochemical parameters using multivariate logistic regression showed that subjects with I/I genotype showed significant association with age, F, PP, TC, TGL, HDL, LDL and VLDL (P<0.05). In case of II/II and I/I genotypes significant association was observed with all clinical parameters except SCRT (P<0.05). Genotype I/II also showed significant association with all clinical parameters except BMI and SCRT (P<0.05). However, in case of genotype I/III only LDL showed significant association (P=0.001). No genotypic condition showed significant association with SCRT (P>0.05) (Table 2).
_____________________________________________________________________________________
[image:5.595.109.471.96.506.2]564
Figure 1: A 12.5% polyacrylamide gel showing genotypes of (A) IL-1β -511 C/T using SacI; (B) IL-18 -607 A/C using MseI. M: pUC19/MspI Digest, UD: undigested; (C) A 2% agarose gel showing IL-1Ra VNTRs, M1: 100 bp Ladder
Association of genotypes with biochemical parameters using multivariate logistic regression showed that subjects with ‘AA’ genotype showed significant association with LDL alone (P=0.008). In case of ‘AC’ genotype significant association was observed with age, BMI, F, PP, TC, HDL and LDL (P<0.05) while ‘CC’ showed significant association with all clinical parameters except BMI, WHR and SCRT (P<0.05) (Table 2). None of the genotypic conditions showed significant association with WHR and SCRT (P>0.05).
565
Statistical significance of the observed linkage disequilibrium (Fisher's exact test):
rs16944 rs1946518
IL-1Ra 0.626941 0.37868
rs16944 - 0.745248
--- Linkage Disequilibrium tests
D': rs16944 rs1946518 r2: rs16944 rs1946518
IL-1Ra 0.014 0.126 IL-1Ra 0.000 0.002
rs16944 - 0.016 rs16944 - 0.000
[image:6.595.75.520.81.393.2]---
Figure 2: Linkage Disequilibrium (D’) and Correlation coefficient (r2) of three SNPs viz. IL-1Ra, rs16944 and rs1946518 with T2DM in
North Indian population. Pairwise LD in subjects is represented as pink
DISCUSSION
All IL-1 family genes (IL-1α, IL-1β, IL-1Ra and IL-18) are polymorphic and several of these polymorphisms have been shown to be associated with either susceptibility or severity of inflammatory conditions and diseases [4, 5, 18, 19]. It has been recently suggested that prolonged exposure of human islets to high glucose trigger IL-1β production by β-cells themselves leading to nuclear factor activation and upregulation of Fas signaling thus triggering “autocrine apoptosis” [20]. The cytokine proteins IL-1β and IL-1Ra are potent mediators of inflammatory response and play important roles in tissue remodeling in chronic inflammation [6]. IL-1 gene polymorphisms have been studied by various groups in T2DM and related complications [5, 19-25].
IL-18 expression has been reported in macrophages, dendritic cells (DC), Kupffer cells, keratinocytes, osteoblasts, adrenal cortex cells, intestinal epithelial cells, microglial cells, and synovial fibroblasts [26-30].
IL-18 levels have been associated with adiposity and insulin resistance in obese premenopausal women. It has been reported that IL-18 concentration is increased by acute hyperglycemia in humans [31]. IL-18 gene polymorphisms have been studied by various groups in T2DM and related complications [32-36].
In the present case-control study of IL-1β gene polymorphism, significant association was observed in genotypic frequency distribution (P<0.0001) while none was observed in allele frequencies. However, carriage rate of -511*C and -511*T were involved in T2DM manifestation (Table 1). The biochemical parameters brought forth some interesting results with IL-1β gene polymorphism showing no significant association with BMI, WHR and SCRT (P >0.05). However, the ‘CC’ genotype showed significant association with F, PP and LDL (P<0.001), while ‘CT’ and ‘TT’ subjects with age, F, PP, TC, HDL and LDL (P<0.001) and ‘TT’ genotype with TGL and VLDL (P<0.001)
_____________________________________________________________________________________
566
In IL-1Ra we found four different alleles in our population unlike previous reports which showed two alleles [22]. Our study also found positive association of IL-Ra genotype with T2DM. Most subjects in the study population were homozygous genotype I (65.61 and 62.90 % controls and T2DM patients respectively) as previously reported [22]. The biochemical parameters showed significant association with I, II and I/II genotypes of IL-1Ra. However, in case of genotype I/III, only LDL showed significant association (P=0.001) (Table 1). No genotypic condition showed significant association with SCRT (P>0.05). The IL-Ra gene did not show any association with myocardial infarction which is a severe diabetic complication [37]. The IL-1Ra is a major modulator of the IL-1 pro-inflammatory pathway. The relationship between a variable number tandem repeat (VNTR) polymorphism in intron 2 of the IL-1Ra gene and coronary artery disease (CAD) in patients with and without T2DM was studied by Marculescu et al, 2002 [38]. Our results showed that allele I of IL-1Ra gene polymorphism increases the risk of T2DM upto 3.4 times in the study population.
Opstad et al, 2011 [32] studied +183 A/G, -137 G/C and -607 C/A IL-18 gene polymorphisms in T2DM subjects and showed that only +183 A/G was significantly associated with the disease. However, in Chinese population -607 C/A polymorphism was significantly associated with T2DM [33]. European researchers studied many IL-18 gene polymorphisms with T2DM, metabolic syndrome, cardiovascular diseases and presented controversial results [34-36]. In our population, -607 C/A polymorphism showed genotypic association (P=0.002) (Table 1) and most subjects were found to be heterozygous. Biochemical analysis showed that ‘AA’ genotype showed significant association with LDL alone (P=0.008), ‘AC’ genotype with age, BMI, F, PP, TC, HDL, LDL (P<0.05) and ‘CC’ genotype with all clinical parameters except BMI, WHR and SCRT (P<0.05) while, no significant association was observed with WHR and SCRT (P >0.05) (Table 2). The result showed that -607*C of IL-18 gene increases the risk of diabetes upto 3.7 times while -607*A increases the risk upto 1.7 times (Table 1). Individuals with ‘AC’ genotype of IL-18 -607 C/A may be more susceptible to T2DM.
IL-1Ra, IL-1β-511 C/T and IL-18-607 A/C gene-gene interaction analyses showed that none of the combinations of alleles had significant association with T2DM (Table 3) but in IL-1Ra only I and II alleles are involved in T2DM predisposition. T2DM is a combined metabolic disorder which includes hyperglycemia, dyslipidemia, stroke etc. being the most common causes of death in diabetic patients. Inflammation has been an important outcome of any kind of imbalance in the body and is therefore an indicator of several diseases including T2DM. Various groups all over the world are relentlessly working out the possible role of a vast number of genes associated with T2DM.
CONCLUSION
The present study was undertaken to explore the association of cytokine gene polymorphisms with T2DM and a sincere effort was made to determine whether specific genotypes/haplotypes of SNPs or gene-gene interactions could actually be useful in predicting the susceptibility risk of individuals. Individuals with ‘AC’ genotype of IL-18
-607 C/A were observed to be more susceptible to T2DM. SNP studies have shown a considerable level of variation amongst various ethnic populations around the world. Therefore, it is essential to perform the association studies/SNP analyses in individual populations so that they can be benefitted. Individuals at risk will be able to take prior precautionary measures and avoid or delay the onset of the disease. These genetic studies will lead to the identification of risk haplotype(s) for disease susceptibility, development of prognostic regimens and alter treatment strategies for T2DM and related complications. The challenge for the future will be to understand the genotypic interactions between SNPs in the same gene or genes at different loci.
Acknowledgements
The work was supported by a research grant from Department of Science and Technology (DST) and Indian council of medical research (ICMR), New-Delhi, India. MS is thankful to Indian Council of Medical Research (ICMR, New Delhi, India; IRIS ID: 2010-03960) for granting Senior Research fellowship (2010-2013) and also to Dr. D. S. Kothari post-doctoral fellowship from university grant commission, New Delhi (BL/12-13/0317) (2013-2016). The central equipment facility sponsored by DST-FIST-PURSE is duly acknowledged.
REFERENCES
567
[3] A Mantovani, M Locati, A Vecchi, et al. Trends Immunol., 2001, 22, 328-36. [4] N Haukim, JL Bidwell, AJ Smith, et al. Genes Immun., 2002, 3, 313-30. [5] M Banerjee and M Saxena. Clin Chim Acta, 2012, 413, 1163-70.
[6] BR Achyut, A Srivastava, S Bhattacharya, et al. Clin Chim Acta, 2007, 377, 163-9. [7] N Sarvetnick. J Clin Invest., 1997, 99, 371-2.
[8] S Frigerio, GA Hollander and U Zumsteg. Horm Res., 2002, 57, 94-104. [9] Y Aso, K Okumura, K Takebayashi, et al. Diabetes Care, 2003, 26, 2622-7. [10] K Esposito, F Nappo, F Giugliano, et al. Diabetes Care, 2003, 26, 1647. [11] A Blazhev, G Nicolff, Ch Petrova, et al. Diabetologia Croatica, 2006, 35, 1-6.
[12] J Hung, BM McQuillan, CML Chapman, et al. Arterioscl Thromb Vasc Biol., 2005, 25, 1268-73. [13] Z Mallat, A Corbaz, A Scoazec, et al. Eur Heart J., 2002, 23, 831-4.
[14] S Gautam, CG Agrawal, HK Bid, M Banerjee. Indian J Med Res., 2011, 134, 107-12. [15] M Saxena, CG Agrawal, S Gautam, et al. Arch Appl Sci Res., 2009, 1, 57-66. [16] SA Miller, DD Dykes and HF Polesky. Nucl Acids Res., 1988, 16, 1215. [17] YY Shi and L He. Cell Research, 2005, 15, 97–8.
[18] F Struch, M Dau, C Schwahn, et al. J Periodontol., 2008, 79, 501-7. [19] NJ Lopez, CY Valenzuela and L Jara. J Periodontol., 2009, 80, 1590-8. [20] N Welsh, M Cnop, I Kharroubi, et al. Diabetes, 2005, 54, 3238-44. [21] T Yoshida, K Kato, K Yokoi, et al. Int J Mol Med., 2009, 23, 529–37.
[22] HK Bid, R Konwar, CG Agrawal, M Banerjee. Indian J Med Sci., 2008, 62, 259–66. [23] S Cauci, MD Santolo, KK Ryckman, et al. BMC Med Genet., 2010, 11, 1–11. [24] K Luotola, A Pietila, T Zeller, et al. FEBS Lett., 2006, 580, 6289–94. [25] B Conti, JW Jahng, C Tinti, et al. J Biol Chem., 1997, 272, 2035-7. [26] S Stoll, G Muller, M Kurimoto, et al. J Immunol., 1997, 59, 298-302. [27] JA Gracie, RJ Forsey, WL Chan, et al. J Clin Invest., 1999, 104, 1393-401. [28] TT Pizarro, MH Michie, M Bentz, et al. J Immunol., 1999, 162, 6829-35. [29] M Prinz and UK Hanisch. J Neurochem., 1999, 72, 2215-8.
[30] J Hung, BM McQuillan, CML Chapman, et al. Arterioscl Thromb Vasc Biol., 2005, 25, 1268-73. [31] TB Opstad, AA Pettersen, H Arnesen, et al. Cardiovasc Diabetol., 2011, 10, 110.
[32] Y Huang, M Xu, J Hong, et al. Endocrine., 2010, 37, 507-12.
[33] M He, MC Cornelis, P Kraft, et al. Arterioscler Thromb Vasc Biol., 2010, 30, 885-90. [34] S Rafiq, D Melzer, MN Weedon, et al. Diabetologia., 2008, 51, 2205-13.