Journal of Chemical and Pharmaceutical Research, 2014, 6(12):50-57
Research Article
ISSN : 0975-7384
CODEN(USA) : JCPRC5
Optimization and decolorization of malachite green using
Pseudomonas putida
U. Sneha
*, R. Poornima and S. Sridhar
Jeppiaar Engineering College, Rajiv Gandhi Road, Chennai, Tamil Nadu, India
_____________________________________________________________________________________________
ABSTRACT
The present study emphasizes on the decolorization of malachite green using Pseudomonas putida. The effect of pH, temperature, dye concentration, inoculum volume and static/agitated condition was studied using One Factor At a Time approach. Malachite green was decolorized by around 90% with this bacterium and the optimal conditions were found to be pH 7, 30°C, 200 mg/L dye concentration, 0.5 mL inoculum under the static condition. Response Surface Methodology using Box Behnken Design was applied to further optimize malachite green decolorization. A quadratic model was obtained for dye decolorization through this design. The optimum values for temperature, dye concentration, incubation time and inoculum volume were found to be 25°C, 200 mg/L, 72 hours and 0.75 mL respectively. The predicted decolorization rate under the optimum conditions determined by Response Surface Methodology was in close agreement with the experimental results and the model was found to be significant. The germination and growth of Triticum aestivum and Vigna radiata seeds and the growth of micro-organisms were not inhibited by the degraded metabolic products of the dye in the toxicity studies. The ability of the strain to tolerate, decolorize and degrade malachite green at high concentration gives it an advantage for the treatment of textile industry wastewater. This approach creates a promising hope for the bioremediation of the environment which is polluted by hazardous dyes.
Keywords: Malachite green, Response Surface Methodology, Box Behnken Design, toxicity studies,
bioremediation
_____________________________________________________________________________________________
INTRODUCTION
During manufacturing and usage of dyes in the textile industries, approximately 10- 15% of the dye finds its way into the environment as wastewater [1,2]. The textile dyes disturb the marine ecosystem, as they undergo chemical and biological changes [3]. Their breakdown products are also toxic to most aquatic organisms [4,5]. It also greatly affects the photosynthesis of hydrophytes by limiting light penetration, thereby deteriorating gas solubility and water quality [6].
of time. Therefore, there are both environmental and human health concerns about bioaccumulation of malachite green and leucomalachite green in terrestrial and aquatic ecosystems [21].
Various physical and chemical methods like coagulation or adsorption of dyes, ultra-filtration, ion-exchange, chemical oxidation, electrolysis etc have been developed for the elimination of dyes from the wastewater since many years [7,8]. However these methods are not very much applied because of their high cost, high energy requirements and hazardous by-products [9]. Also these techniques generate a huge volume of sludge and cause secondary pollution due to the formation of sludge and hazardous by-products [10,11].
Biological methods are generally considered environment friendly as they can lead to complete mineralization of organic pollutants at low cost [12]. Bioremediation may be the most effective method for treating industrial dyes wastewater [13].
Response surface methodology (RSM) is a collection of mathematical and statistical techniques useful for analyzing the effects of several independent variables [14]. The application of statistical experimental design techniques in a process results in improvement of yield, reduces process variability, gives closer confirmation of the output response to nominal and reduces overall costs [15]. Box Behnken design is a combination of a two-level (full or fractional) factorial design with an incomplete block design. In each block, a certain number of factors are put through all combinations for the factorial design, while the other factors are kept at the central values [16].
In this paper, the effect of pH, temperature, dye concentration and volume of inoculum was studied using One Factor At a Time (OFAT) approach. Response Surface Methodology (RSM) was applied to optimize the decolorization of malachite green by Pseudomonas putida. Box Behnken design using 4 variables (temperature, dye concentration, inoculum volume and incubation time) was used to optimize the effect of these variables on dye decolorization. Microbial toxicity and phytotoxicity studies were carried out to check if the degraded metabolites were non toxic.
EXPERIMENTAL SECTION
2.1. Bacterial strain
Pseudomonas putida MTCC 102 was purchased from IMTECH, Chandigarh. Escherichia coli HB101 was
purchased from Medox, Chennai. Bacillus subtilis and Bacillus cereus were purchased from Marina Labs, Chennai.
2.2. Chemicals
Malachite green of analytical grade (dye content 40%) was purchased from HI-Media. All the other chemicals used in our experiments were of analytical grade.
2.3. Equipment
UV spectrophotometer of ELICO, India was used for measuring the decolorization efficiency.
2.4. Decolorization studies
100 mg/L of malachite green dye amended in nutrient broth was inoculated with 1 mL of Pseudomonas putida strain
and incubated at 370C for 72 hours. After the incubation, the reaction mixture was centrifuged at 2000 rpm for 15
minutes and the supernatant was taken to measure the dye decolorization efficiency. Dye decolorization was measured by monitoring the decrease in absorbance of the dye in a double beam UV-Visible spectrophotometer (Elico, India) at 620nm [17]. Dye decolorization efficiency is expressed as follows: equation 1,
Decolorization efficiency (%) = [A0- At] * 100 ---- (1)
[A0]
Where A0 : initial absorbance
At : final absorbance
2.5. Physiochemical parameters optimization
The effect of pH (4, 5, 6, 7, 8 and 9), temperature (30, 40, 50, 60, 700C), dye concentration (100, 150, 200, 250, 300
2.6. Optimization of process variables
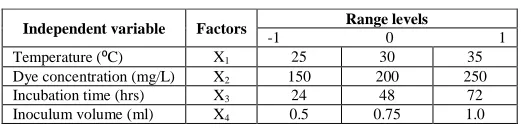
[image:3.595.168.430.200.264.2]Response Surface Methodology (RSM) is the combination of mathematical and statistical tools to predict the optimal conditions using minimal runs. Three level four factorial Box-Behnken Design was chosen to study the interactions of four variables such as temperature (°C), dye concentration (mg/L), incubation time (hours) and enzyme volume (mL) based upon OFAT approach. Table 1 represents the experimental ranges used in Box-Behnken design.
Table 1. Experimental range and levels of independent variables
Independent variable Factors Range levels
-1 0 1
Temperature (⁰C) X1 25 30 35
Dye concentration (mg/L) X2 150 200 250
Incubation time (hrs) X3 24 48 72
Inoculum volume (ml) X4 0.5 0.75 1.0
2.7. Toxicity Studies
Microbial toxicity and phytotoxicity studies were performed to determine the degree of toxicity of the dye and its degraded metabolites. The degraded products of 200 mg/L malachite green from the 100 mL media was extracted using equal volume of ethyl acetate, dried and dissolved in distilled water. This solution was then used for the toxicity studies.
2.7.1. Microbial toxicity
Microbial toxicity of the dye malachite green was studied on Escherichia coli, Bacillus subtilis, Bacillus cereus and
Pseudomonas putida. The toxicity of the dye and its degradation products were studied using agar well assay. The
zone of growth of inhibition of microbes was recorded after 24 hours of incubation at 370C [19].
2.7.2. Phytotoxicity
Seed germination and plant growth bioassay are the most common techniques used to evaluate phytotoxicity [20]. Phytotoxicity studies were carried out on Triticum aestivum and Vigna radiata at room temperature. 20 seeds of each were watered daily with dye and its degraded product separately. Control set was carried out using distilled water. The germination %, length of the plumule and radical were recorded after 3 days [21].
RESULTS AND DISCUSSION
3.1. Physiochemical parameters optimization
pH has a major effect on the efficiency of dye decolorization, and the optimal pH for color removal is often between 6.0 and 10.0 [22, 23, 24].
The optimum pH for malachite green decolorization was found to be 7.
The decolorization rate was found to be maximum at 30°C and found to decrease at higher temperatures. This might have occurred due to adverse effect of high temperature on the enzymatic activities [25]. Hence the optimum temperature was found to be 30°C.
The decolorization rate was found to increase with dye concentration upto 200 mg/mL beyond which the rate is lowered. The optimum dye concentration was hence found to be 200 mg/L. Initial concentration provides an important driving force to overcome all mass transfer resistance of the dye between the aqueous and solid phases [21]. The decrease in decolorization efficiency might be due to the toxic effect of dyes [26].
The decolorization rate was found to increase with increase in inoculum volume. Beyond 0.5 mL the increase was not significant. Thus the optimum inoculum was found to be 0.5 mL.
3.2. Optimization of process variables
regression analysis represented effect of variables on the dye decolorization in a form of second order polynomial mathematical equation as given in (3),
Y = β0 + β1X1 + β2X2 + β3X3 + β4X4 + β12 X1X2 + β13X1X3 + β14 X1X4 + β23 X2X3 + β24 X2X4 + β34 X3X4 + β11 X12 +
β22 X22 + β33 X32 + β44 X42 + ε --- (2)
where Y is the response (decolorization); X1, X2, X3 and X4 are the coded variables; X12, X22, X32 are the square effects; X1X2, X1X3 and X2X3 are the interaction effects; β1, β2 and β3 are the linear coefficients; β11, β22 and β33 are
the squared coefficients; β12, β13, β23 are the interaction coefficients; β0 and ε are the constant and the random error,
respectively.
Y = 87.72 - 4.76 X1 - 0.97 X2 + 4.04 X3 - 0.55 X4 - 2.25 X1X2 – 0.29 X1X3 – 2.5 X1X4 – 0.32 X2X3 – 2.38 X2X4 –
0.23 X3X4 – 1.71 X12 – 3.89 X22 + 0.94 X32 + 0.89 X42 --- (3)
[image:4.595.98.495.303.636.2]is the predicted polynomial equation for malachite green decolorization using Pseudomonas putida.
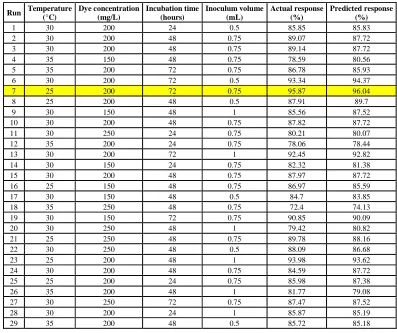
Table 2. Box-Behnken Design towards malachite green decolorization using Pseudomonas putida
Run Temperature (°C) Dye concentration (mg/L) Incubation time (hours) Inoculum volume (mL) Actual response (%) Predicted response (%)
1 30 200 24 0.5 85.85 85.83
2 30 200 48 0.75 89.07 87.72
3 30 200 48 0.75 89.14 87.72
4 35 150 48 0.75 78.59 80.56
5 35 200 72 0.75 86.78 85.93
6 30 200 72 0.5 93.34 94.37
7 25 200 72 0.75 95.87 96.04
8 25 200 48 0.5 87.91 89.7
9 30 150 48 1 85.56 87.52
10 30 200 48 0.75 87.82 87.72
11 30 250 24 0.75 80.21 80.07
12 35 200 24 0.75 78.06 78.44
13 30 200 72 1 92.45 92.82
14 30 150 24 0.75 82.32 81.38
15 30 200 48 0.75 87.97 87.72
16 25 150 48 0.75 86.97 85.59
17 30 150 48 0.5 84.7 83.85
18 35 250 48 0.75 72.4 74.13
19 30 150 72 0.75 90.85 90.09
20 30 250 48 1 79.42 80.82
21 25 250 48 0.75 89.78 88.16
22 30 250 48 0.5 88.09 86.68
23 25 200 48 1 93.98 93.62
24 30 200 48 0.75 84.59 87.72
25 25 200 24 0.75 85.98 87.38
26 35 200 48 1 81.77 79.08
27 30 250 72 0.75 87.47 87.52
28 30 200 24 1 85.87 85.19
29 35 200 48 0.5 85.72 85.18
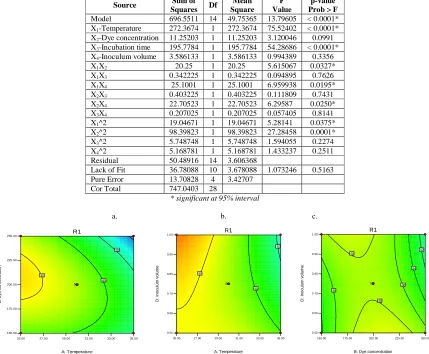
Table 3 represents the relationship between the independent variables and dependent response in the form Analysis Of Variance (ANOVA). The analysis of variance (ANOVA) of regression model demonstrates that the model is highly significant, as is evident from the Fisher’s F-test with a very low probability value [(P model > F) = 0.0001].
Linear factors such as X1 and X3 were found to be contributing variable towards malachite green decolorization.
The two-dimensional contour plots are the graphical representations of the regression equation. These plots are presented in figure 1 for malachite green decolorization. A circular contour plot of response surfaces suggest that the interaction is negligible between the corresponding variables, while an elliptical or saddle contour plot indicates significance in the interactions between the corresponding variables [27]. By analyzing the plots, the best response range can be calculated.
3.3. Adequacy of the model
The fitted model must be assessed to ensure that it gives sufficient approximation of the results obtained in the experimental conditions. A check of the normality assumption can be made by constructing a normal probability plot of the residuals as given in figure 2. The normality assumption is satisfied if the residuals lie approximately
along a straight line [28]. The coefficient of multiple regression R2, is a global statistic parameter to assess the
fitness of a model [14]. R2 was found to be 0.93 which is close to 1 and hence denotes that the model is fit. For
further validation of the model, adjusted R2 was used for confirming the model adequacy. The adjusted R2 value was
[image:5.595.83.512.294.648.2]0.86 which confirms that model is fit.
Table 3. Analysis Of Variance for malachite green decolorization using Pseudomonas putida
Source Sum of
Squares Df
Mean Square
F Value
p-value Prob > F
Model 696.5511 14 49.75365 13.79605 < 0.0001*
X1-Temperature 272.3674 1 272.3674 75.52402 < 0.0001*
X2-Dye concentration 11.25203 1 11.25203 3.120046 0.0991
X3-Incubation time 195.7784 1 195.7784 54.28686 < 0.0001*
X4-Inoculum volume 3.586133 1 3.586133 0.994389 0.3356
X1X2 20.25 1 20.25 5.615067 0.0327*
X1X3 0.342225 1 0.342225 0.094895 0.7626
X1X4 25.1001 1 25.1001 6.959938 0.0195*
X2X3 0.403225 1 0.403225 0.111809 0.7431
X2X4 22.70523 1 22.70523 6.29587 0.0250*
X3X4 0.207025 1 0.207025 0.057405 0.8141
X1^2 19.04671 1 19.04671 5.28141 0.0375*
X2^2 98.39823 1 98.39823 27.28458 0.0001*
X3^2 5.748748 1 5.748748 1.594055 0.2274
X4^2 5.168781 1 5.168781 1.433237 0.2511
Residual 50.48916 14 3.606368
Lack of Fit 36.78088 10 3.678088 1.073246 0.5163
Pure Error 13.70828 4 3.42707
Cor Total 747.0403 28
* significant at 95% interval
a. b. c.
25.00 27.00 29.00 31.00 33.00 35.00 150.00 175.00 200.00 225.00 250.00 R1 A: Temperature B : D y e c o n c e n tr a ti o n 80 85 90 5
25.00 27.00 29.00 31.00 33.00 35.00 0.50 0.60 0.70 0.80 0.90 1.00 R1 A: Temperature D : In o c u lu m v o lu m e 80 85 90 5
150.00 175.00 200.00 225.00 250.00 0.50 0.60 0.70 0.80 0.90 1.00 R1
B: Dye concentration
D : In o c u lu m v o lu m e 82 84 86 86 88 88 5
Internally Studentized Residuals
N
o
rm
a
l
%
P
ro
b
a
b
ili
ty
Normal Plot of Residuals
-2.00 -1.00 0.00 1.00 2.00 3.00 1
[image:6.595.212.375.114.275.2]5 10 20 30 50 70 80 90 95 99
Figure 2. Normal plot for decolorization of malachite green by Pseudomonas putida
3.4. Toxicity studies 3.4.1. Microbial toxicity
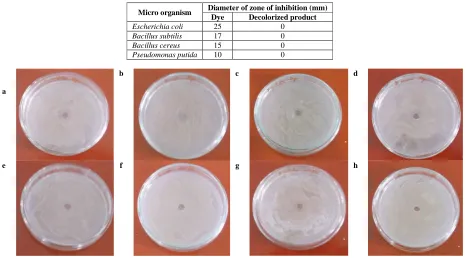
The zone of inhibition for Bacillus cereus, Bacillus subtilis, Escherichia coli and Pseudomonas putida against malachite green and its degraded metabolites was observed after 24 hours and recorded (Table 4). The micro-organisms did not show any zone of inhibition against the degraded metabolite, thereby indicating that the degraded metabolite was not toxic to the micro- organisms.
Table 4: Microbial toxicity study of malachite green and its decolorized product
Micro organism Diameter of zone of inhibition (mm)
Dye Decolorized product
Escherichia coli 25 0
Bacillus subtilis 17 0
Bacillus cereus 15 0
Pseudomonas putida 10 0
a
b c d
e f g h
Plate 1: Zone of inhibition by malachite green (200mg/L) on a: Bacillus subtilis, b: Escherichia coli, c: Pseudomonas putida, d: Bacillus
cereus
Zone of inhibition by the decolorized metabolites of malachite green e: Bacillus subtilis, f: Escherichia coli, g:
[image:6.595.68.534.398.656.2]3.4.2. Phytotoxicity studies
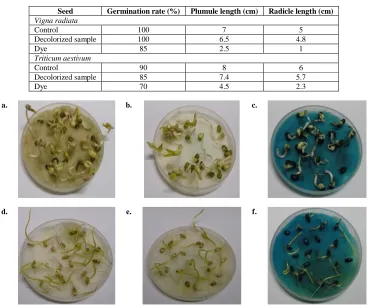
[image:7.595.114.483.176.482.2]The seedling germination rate and growth for both the plants (Table 5) was good in the presence of treated dyes as compared to the untreated dyes. In fact, the seedling germination and growth in the presence of treated dyes was almost equivalent to that of the control which was grown in the presence of distilled water.
Table 5: Phytotoxicity study of malachite green and its decolorized product
Seed Germination rate (%) Plumule length (cm) Radicle length (cm)
Vigna radiata
Control 100 7 5
Decolorized sample 100 6.5 4.8
Dye 85 2.5 1
Triticum aestivum
Control 90 8 6
Decolorized sample 85 7.4 5.7
Dye 70 4.5 2.3
a. b. c.
d. e. f.
Plate 2: Phytotoxicity studies on Vigna radiata and Triticum aestivum.
Vigna radiata after 3 days of incubation- a. control b. decolorized metabolites c. dye. Triticum aestivum after 3 days of incubation- d. control e. decolorized metabolites f. dye.
CONCLUSION
Bioremediation has proved to be a very effective method in encountering the textile dye pollution in an eco-friendly manner. This approach creates a promising hope for remediation of the environment which is polluted by hazardous dyes. The present study confirms the ability of Pseudomonas putida to decolorize malachite green dye with an efficiency of 95%. The decolorized metabolites of the dye showed no toxic effect on microbial growth and plant germination. Thus the hazardous dye was converted into non toxic metabolites.
Acknowledgements
The authors are thankful to Dr. Jeppiaar, Chairman, Jeppiaar Engineering College, Tamil Nadu, India and Dr. Shaleesha A. Stanley, Professor and Head, Department of Biotechnology, Jeppiaar Engineering College for providing constant encouragement and support.
REFERENCES
[1]F Elisangela; Z Andrea; DG Fabio; R de Menezes Cristiano; D.L Regina; C.P Artur, International
Biodeterioration and Biodegradation, 2009, 63, 280-288.
[2]F He; W Hu; Y Li, Chemosphere, 2004, 57, 293-301.
[3]KS Mundhe; AB Gaikwad; RC Torane; NR Deshpande; RV Kashalkar, Journal of Chem. Pharm. Res., 2012,
4(1), 423-436.
[4]Atul Kumar; Pratibha Choudhary; Poonam Verma, Journal of Chem. and Pharm. Res., 2012, 4(1), 763-771.
[5]MS Usha; B Sasirekha; RB Bela; S Devi; C Kamalini; GA Manasa; PM Neha, Journal of Chem. Pharm. Res.,
2011, 3(6), 450-457.
[6]RS Shertate; Thorat P, OnLine Journal of Biological Sciences, 2012, 12, 1-5.
[7]Andreas Kandelbauer; Angelika Erlacher; Artur Cavaco-Paulo; M George Guebitz, Biocatalysis and
Biotransformation, 2004, 22 (5/6), 331-339.
[8]IM Banat; P Nigam; D Singh; R Marchant, Bioresource Technology, 1996, 58, 217-227.
[9]M Meenakshi Sundaram; K Shahul Hameed, Journal of Chem. and Pharm. Res., 2012, 4(4), 2070-2080.
[10]J Maier; A Kandelbauer; A Erlacher; A Cavaco-Paulo; GM Gübitz, Applied and Environmental Microbiology,
2004, 70 (2), 837-844.
[11]Mohandass Ramya; Bhaskar Anusha; S Kalavathy; S Devilaksmi, African Journal of Biotechnology, 2007, 6,
1441-1445.
[12]A Pandey; P Singh; L Iyengar, International Biodeterioration & Biodegradation, 2007, 59, 73-84.
[13]K Nozaki; CH Beh; M Mizuno; T Isobe; M Shiroishi; T Kanda, Journal of Bioscience and Bioengineering,
2008, 105, 69–72.
[14]RH Myers, DC Montgomery, Response Surface Methodology, 2002, John Wiley & Sons, Inc., USA.
[15]Ruchir; C Pansuriya; S Rekha Singhal, Braz. J. Microbiol., 2010, 41(1), 164-172.
[16]GEP Box, DW Behnken. Some new three level designs for the study of quantitative variables, Technometrics,
1960, 2, 455–475.
[17]Rukhsana Satar; Qayyum Husain, Journal of Environmental Sciences, 2011, 23(7), 1135–1142.
[18]U Sneha; R Poornima; S Sridhar, Journal of Chem. Pharm. Res., 2013, 5(5), 219-225.
[19]Pratiksha Pradhan; K Gireesh Babu, International Journal of Current Research, 2012, 4(10), 10-16.
[20]A Kapanen; M Itavaara, Ecotoxicology and Environmental Safety, 2001, 49, 1-16.
[21]G Parshetti; S Kalme; G Saratale, Acta Chim Solv., 2006, 53, 492 – 498.
[22]KC Chen; JY Wu; DJ Liou, Journal of Biotechnology, 2003, 101, 57–68.
[23]JB Guo; JT Zhou; D Wang, Water Research, 2007, 41, 426–432.
[24]NK Kilic; JL Nielsen; Yuce M, Chemosphere, 2007, 67, 826–831.
[25]D Cetin; G Donmez, Enzyme and Microbial technology, 2006, 38, 926 – 930.
[26]MS Khehra; SS Harvinder; DK Sharma, Dyes Pig, 2005, 70, 1-6.
[27]ZW Wang; XL Liu, Bioresource Technology, 2008, 99 (17), 8245-8251.
[28]S Margarida Roriz; F Johann Osma; A Jose Teixeir; Susana Rodriguez Couto, Journal of hazardous materials,