Journal of Chemical and Pharmaceutical Research, 2014, 6(11):176-183
Research Article
CODEN(USA) : JCPRC5
ISSN : 0975-7384
Effect of Phyllanthus amarus extract on antioxidant and lipid metabolism gene
expression in HepG2 cells
Atittaya Rocejanasaroj
a, Tewin Tencomnao
band Warin Sangkitikomol
b*a
Post-doctorate Program in Clinical Biochemistry and Molecular Medicine, Department of Clinical
Chemistry, Center for Excellence in Omics-Nano Medical Technology Development Project, Faculty of
Allied Health Sciences, Chulalongkorn University, Bangkok, Thailand
bDepartment of Clinical Chemistry, Center for Excellence in Omics-Nano Medical Technology
Development Project, Faculty of Allied Health Sciences, Chulalongkorn University, Bangkok, Thailand
_____________________________________________________________________________________________
ABSTRACT
Phyllanthus amarus (PA) is used for treatment of several diseases such as liver disease, hyperlipidemia and diabetes mellitus in Thai traditional medicine and worldwide. Oxidative stress plays a major role in the pathogenesis of degenerative diseases induced by free radicals such as hyperlipidemia, diabetes mellitus and cardiovascular disease. So the effect of PA extract (PAE) on antioxidant and lipid metabolism gene expression in HepG2 cells was studied. We found that PAE possessed high levels of total phenolic contents and total antioxidants within the range 379.3 ± 7.0 gallic acid equivalents mM/kg dry mass and 11,079.2 ± 336.0 Trolox equivalents mM/kg dry mass using Folin Ciocalteu phenol (FCP) assay and oxygen radical absorbance capacity (ORAC) assay, respectively. PAE at high doses (2,000-3,000 mg/L) induced cytotoxicity according to the neutral red assay. However PAE doses of 100-800 mg/L could reduce intracellular oxidative stress in a dose-dependent manner (P<0.05) using dichlorodihydrofluorescein diacetate (DCFH-DA) assay. PAE significantly enhanced antioxidant activity by induction of GPX1 gene and Nrf2 gene but decreased Nrf1 gene expression, and reduced cholesterol synthesis by induction of LDLR gene and PPARγ gene expression using reverse transcription-polymerase chain reaction (RT-PCR) assay. It is suggested that PAE may be beneficial for reducing oxidative stress, decrease cholesterol synthesis thereby maintaining overall cellular homeostasis.
Keywords: Phyllanthus amarus extract, Antioxidant, Antihyperlipidemia
_____________________________________________________________________________________________
INTRODUCTION
role against oxidative stress that involved in many pathological conditions. Changing in the GPX1 expression could be an indicator used for oxidative status assessment [15-17].
Low-density lipoprotein receptor (LDLR), a membrane receptor, regulates lipid homeostasis and controls plasma cholesterol levels by removing LDL from blood circulation. The activity of 3-hydroxy-3-methylglutaryl-CoA reductase (HMGCoAR), a rate-limiting enzyme, is necessary for cholesterol synthesis in the cells [18].Liver X receptor α (LXRα) and peroxisome proliferator-activated receptors [PPAR (α1,γ)], nuclear receptors, are regulators of fatty acid, cholesterol and adipocyte differentiation. Many reports showed that PPARs and LXRα pathways regulate several key genes required for lipid homeostasis, anti-inflammation, and metabolic syndromes. These nuclear receptors are ligand-activated transcription factors that modulate expression of genes required for the control of blood glucose, lipid homeostasis as well as diabetes mellitus, chronic systemic inflammatory diseases, and carcinogenesis of liver and breast [19-21].
The aim of this study was to determine antioxidant activity, the effect of PAE on cellular toxicity, and gene expressions that involved in antioxidant and lipid metabolism in HepG2 cells using RT-PCR assay including Nrf1, Nrf2, GPX1, LDLR, HMGCoAR, LXRα, PPARα1 and PPARγ.
EXPERIMENTAL SECTION
HepG2 cell line (Human hepatocellular liver carcinoma cell line) was a gift from Assoc. Prof. Dr. Parvapan Bhattarakosol, Faculty of Medicine, Chulalongkorn University, Bangkok, Thailand. HepG2 cells were cultured in DMEM supplemented with 4 mM glutamine, 4.5 g/L glucose, 10% heat-inactivated FBS, 1% penicillin-streptomycin, 0.1% amphotericin B (fungizone) and maintained at 37°C in a humidified atmosphere with 5% CO2.
The culture medium was changed twice a week, and the cells were sub-cultured once a week. The cells were seeded at a density of 1 x 10⁶ cells/well on 6-well plates for RT-PCR assay and 1 x 10⁴ cells/well on 96-well plates for oxidative stress test.
Whole plant of P. amarus was collected from an herbal garden in Bangkok. The voucher specimen was botanically identified and given herbarium number 013424 (BCU) by Department of Botany, Faculty of Sciences, Chulalongkorn University, Bangkok, Thailand. PAE was prepared with dried plant. In brief, 10 g whole plant was milled and extracted in one liter of 80% methanol in water. This mixture was shaken in an ultrasonic bath for 60 min at 40°C, cooled, and stored in the dark at 4°C for 2 days, after which the supernatant was collected by centrifugation at 3,000 rpm for 15 min. The supernatant or extract was concentrated using a vacuum rotary evaporator at 50°C and freeze-dried. This freeze-dried extract of P. amarus was kept at -80°C until used.
DETERMINATION OF PHENOLIC CONTENT AND ANTIOXIDANT ACTIVITY
A modified FCP assay was performed as described [22]. Briefly, 500 µL samples or standards (gallic acid) were mixed with 500 µL of 10% FCP reagent and allowed to stand for 20 min. To this, 350 µL of 10 mM Na2CO3 was
added, mixed and allowed to stand for 20 min for the solution to turn blue, and then the absorbance at 750 nm was measured by a Shimadzu UV 1601 spectrophotometer. The results of phenolic content were reported as gallic acid equivalents (GE) mM/kg dry mass.
CELL SURVIVAL TEST
Cell survival of HepG2 cells was assessed using the neutral red (NR) assay as previously described [24]. Briefly, following the cell treatments, HepG2 cells were exposed to 100 µL 0.4% NR solution in phosphate-buffered saline (PBS), pH 7.5, for 3 h at 37°C to allow the viable cells to take up the vital stain (NR). This process requires active cells. Failure to take up NR indicated that those cells had suffered damage. Rapidly washed the cells with 1% formaldehyde, l% calcium chloride for removing the excess NR then a mixture of 1% acetic acid, 50% ethanol was added to the HepG2 cells to extract the NR from these cells at room temperature for 30 min. The supernatants were transferred to a 96-well plate, and the absorbance at 550 nm was measured. This method was carried out using VICTOR2 Multilabel Counter (Perkin Elmer Life and Analytical Sciences, Finland). The percent cell survival was calculated according to the following formula: % cell survival = [(absorbance of treated group - blank) / (absorbance of control group - blank)] x 100.
OXIDATIVE STRESS TEST
The DCFH-DA assay was determined with some modifications [25]. Briefly, after cell treatments, HepG2 cells were centrifuged for 10 min at 3,000 rpm and washed three times with phosphate buffer saline (PBS), pH 7.4. Cells were mixed with 100 µL of 100 mM DCFH-DA in PBS and incubated for 90 min at 37°C in a humidified incubator with 5% CO2 atmosphere. The nonionic, nonpolar DCFH-DA crosses cell membranes and is hydrolyzed by intracellular
esterases to non-fluorescent dichlorofluorescin (DCFH). In the presence of reactive oxygen species inside the cells, DCFH is oxidized to highly fluorescent dichlorofluorescein (DCF). The cells were centrifuged for 10 min at 3,000 rpm and then washed 3 times with PBS, pH 7.4. The fluorescent measurement was monitored using VICTOR2 Multilabel Counter with excitation at 485 nm and emission at 535 nm. Therefore, the intracellular DCF fluorescence can be used as an index to quantify the overall oxidative stress inside the cells. The percent cellular oxidative stress was calculated according to the following formula: % cellular oxidative stress = [(fluorescence of treated sample - blank) / (fluorescence of control sample - blank)] x 100.
DETERMINATION OF GENE EXPRESSION
The gene expression was detected using the RT-PCR assay according to a method that was previous described [18, 21] with minor modifications. Briefly, 1 x 10⁶ HepG2 cells suspended in DMEM on 6-well plate were mixed with PAE (0- 600 mg/L, 0 = control). After incubation for 29 hours at 37°C in a humidified incubator with 5% CO2
atmosphere, total RNA was isolated from HepG2 cells using the TRI reagent following the manufacturer protocol.
The purity and quantity of total RNA were determined using agarose gel electrophoresis and a 260/280 ratio as determined by a spectrophotometer. The synthesis of cDNA was performed using 2 µg of total RNA, random primers, and M-MuLV reverse transcriptase at 42°C for 1 hour. Subsequently, PCR reaction was carried out using specific primer pairs in order to generate PCR products, which were shown in Table A. The RT-PCR products along with a DNA ladder were electrophoresed on an agarose gel and visualized by ethidium bromide staining using a
Syngene InGenius3. For data analysis, the Gene Tools software 3.08 (SynGene, Cambridge, UK) was used. Expression of each gene was normalized to that of β-actin, and data for treatment with each PAE concentration was reported as fold-change by normalizing mRNA expression relative to that of control (no treatment).
[image:3.595.138.478.534.728.2]
Table A shows sequence of primers used in RT-PCR method to determine gene expression
Gene Primer sequences (5'→3') PCR product size
Nrf1 sense primer 5'-ACG GAG TGA CCC AAA CCG AAC ATA-3' 689 bp
Nrf1 anti-sense primer 5'-CCA GAT GGG CTT GCA GCT TTC TTT-3'
Nrf2 sense primer 5'-TGC CCA CAT TCC CAA ATC AGA TGC-3' 488 bp
Nrf2 anti-sense primer 5'-TTC TGT GGA GAG GAT GCT GCT GAA-3'
GPX1 sense primer 5'-ACT TAT CGA GAA TGT GGC GTC CCT-3' 451 bp
GPX1 anti-sense primer 5'-AGG CTC GAT GTC AAT GGT CTG GAA-3'
LDLR sense primer 5’-CAA TGT CTC ACC AAG CTC TG-3' 258 bp
LDLR anti-sense primer 5'-TCT GTC TCG AGG GGT AGC TG-3'
HMGCoAR sense primer 5'-CTT GTG TGT CCT TGG TAT TAG AGC TT-3' 247 bp
HMGCoAR anti-sense primer 5'-TTA TCA TCT TGA CCC TCT GAG TTA CAG-3'
PPARα1 sense primer 5'-AGT CTC CCA GTG GAG CAT TGA ACA-3' 728 bp
PPARα1 anti-sense primer 5'-ATA CGC TAC CAG CAT CCC GTC TTT-3'
PPARγ sense primer 5'-AGC CTC ATG AAG AGC CTT CCA ACT-3' 434 bp
PPARγ anti-sense primer 5'-TGT CTT TCC TGT CAA GAT CGC CCT-3'
LXRα sense primer 5'-AAC CCA CAG AGA TCC GTC CAC AAA-3' 818 bp
LXRα anti-sense primer 5'-ATT CAT GGC CCT GGA GAA CTC GAA-3'
β-actin sense primer 5'-ACG GGT CAC CCA CAC TGT GC-3' 656 bp
STATISTICAL ANALYSIS
All data are reported as means with their standard error of means (SE) from at least three independent experiments. Statistically significant differences between control and treated cells were evaluated by one-way ANOVA (SPSS version 11.0 for Windows) followed by the least significant differences (LSD) statistical test. The P-value was determined by two-tailed t-test, and P≤0.05 was considered to be statistically significance.
RESULTS AND DISCUSSION
ANTIOXIDANT ACTIVITY, CELL SURVIVAL TEST AND OXIDATIVE STRESS TEST
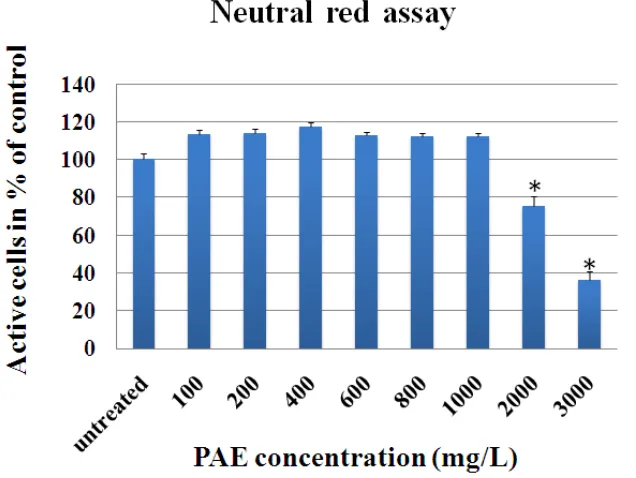
We found that lyophilized form of P. amarus in 80% methanol possessed total phenolic contents and total antioxidants within the range 379.3 ± 7.0 GE mM/kg dry mass and 11,079.2 ± 336.0 TE mM/kg dry mass, respectively (Table 1). Subsequently, lyophilized PAE was used to study the effect on cell survival and oxidative stress of HepG2 cells. P. amarus extract at a high dose (2000 - 3000 mg/L) induced cytotoxicity according to the neutral red assay (Figure 1). However, PAE doses of 100-800 mg/L could reduce intracellular oxidative stress in a dose-dependent manner (P < 0.05) using the DCFH-DA assay (Figure 2).
Table 1─Total phenolic contents using FCP assay and total antioxidant activity using ORAC assay of P. amarus extract
Extract Total phenolic contents (GE mM/Kg dry mass)
Total antioxidant activity (TE mM/Kg dry mass) P. amarus 379.3 ± 7.0 11079.2 ± 336.0
Data are reported as means ± SE. All data were calculated from three independent experiments. GE = Gallic acid equivalents; TE = Trolox equivalents.
[image:4.595.153.471.342.581.2]
Figure 1─Effect of P. amarus extract (PAE) on HepG2 cell survival using neutral red assay. HepG2 cells were incubated with increasing concentrations of PAE (0-3000 mg/L, 0 = control) for 29 hours. Values are reported as means with their standard error of the means depicted by vertical bars. All experiments were performed in triplicate (n=3), *P<0.05 for significant change as compared to control
(untreated)
stress-induced reactive oxygen species (ROS) production was significantly decreased by PAE in a dose-dependent manner using DCFH-DA assay. Based on this particular experiment, we found that PAE significantly reduced oxidative stress in HepG2 cells. P. amarus contains many active compounds such as rutin, astragalin, kaempferol, quercetin-3-O-glucoside, quercetin, quercitrin gallic acid, ellagic acid, gallocatechin alkaloids, hydrolysable tannins lignans, triterpenes, sterols and volatile oil [27]. Therefore, the combination of various bioactive compounds of P. amarus could prevent excessive oxidation of macromolecules such as DNA, proteins and lipids. The liver is a major organ primary function for balance metabolic homeostasis. Metabolic homeostasis processes include those breakdown foreign substances or xenobiotics, as well as those of the endogenous chemicals such as lipids [28]. The acute and chronic ethanol, carbon tetrachloride and acetaminophen hepatotoxicity could increase the production of ROS. It was reported that ROS enhanced oxidation of lipids, proteins and DNA. P. amarus extract was used to efficiently treat patients with ethanol-induced hepatotoxicity [29] carbon tetrachloride [13] and acetaminophen hepatotoxicity [30] therefore the liver was protected by the antioxidant activity of PAE. But at very high doses of P. amarus were harmful, according to the HepG2 cell viability test; 2000-3000 mg/L PAE significantly reduced the number of living cells. The other studies also found that high concentrations of flavonoids may directly activate of the caspase cascade in the mitochondrial pathway by inhibiting survival signaling [31] and may sustain the activation of mitogen-activated protein kinases or stress-activated protein kinases which could induce apoptosis [32-33].
Figure 2─Effect of P. amarus extract (PAE) on oxidative stress of HepG2 cells using the DCFH-DA assay. HepG2 cells were incubated with increasing concentrations of PAE (0-800 mg/L, 0 = control) for 29 hours. Values are reported as means with their standard error of
the means depicted by vertical bars. All experiments were performed in triplicate (n=3), *P<0.05 for significant change as compared to control (no treatment)
GENE EXPRESSION
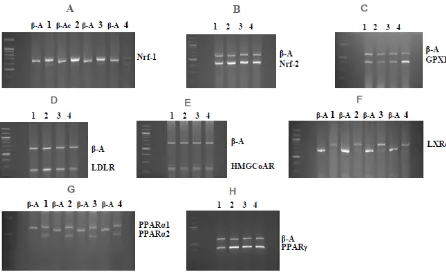
The effect of P. amarus extract on antioxidant gene expressions was investigated. PAE at 200 mg/L enhanced the expression of the Nrf2 gene and PAE at 600 mg/L enhanced the GPX1 gene but inhibited the expression of the Nrf1 gene in HepG2 cells (p<0.05). With regard to lipid metabolism gene expressions, PAE from 200 to 400 mg/L enhanced LDLR and PPARγ gene expressions in HepG2 cells (P<0.05) but no differences were observed for HMGCoAR,PPARα1 and LXR genes (Figure 3 and Table 2). It was reported that the disruption of Nrf1 causes stress, and activates a number of antioxidant response elements responsive genes in an Nrf2-dependent manner [34]. Nrf2 is known to regulate a number of genes involved in antioxidant and xenobiotic-metabolic enzymes [35-36]. The molecular mechanisms involved in increasing the expression and function of glutathione peroxidase-1. It is an intracellular antioxidant enzyme that reduces hydrogen peroxide to water to reduce its harmful effects. Glutathione peroxidase-1 has been indicated in the prevention of several diseases, including cancer and cardiovascular diseases [37]. Lipids are essential for life and are required for maintenance of normal cell functions. Lipids are tightly controlled by lipid homeostasis system in liver and adipose tissue that balanced production and elimination of these substances [38-39]. Disruption of lipid metabolism in the liver can trigger many metabolic complications such as diabetes mellitus, obesity and atherosclerosis. Some herbal extracts can significantly alter lipid metabolism in the liver. For example, black sticky rice could lower hepatic LDLR mRNA expression [5] and Moringa oleifera could reduce HMGCoAR-, PPARα1-, PPARγ-mRNA expressions [6]. Here, we designed the experiments to elucidate the effect of PAE on the regulation of lipid metabolism in the liver. Therefore, our result provided evidence that
treatment of HepG2 cells with PAE could enhance hepatic LDLR- and PPARγ mRNA expression. It was suggested that PAE may increase LDL absorption into liver cells by increasing numbers of LDL-receptor. Nuclear receptors in PPAR-super-family control the expression of numerous genes in the liver, including genes related to gluconeogenic, lipogenic and pro-inflammatory genes [40-41].
Figure 3─Effects of P. amarus extract on mRNA expression of marker genes in HepG2 cells using the RT-PCR method. Representative agarose gel photographs showed RT-PCR products corresponding to expect sizes of the marker genes studied, i.e., A. Nrf1, B. Nrf2, C. GPX1, D. LDLR, E. HMG-CoAR, F. LXRα, G. PPARα1, PPARα2 nonspecific bands (isoforms) and H. PPARγ. The mRNA expression of
β-actin gene was used for normalization. HepG2 cells were treated with increasing concentrations of PAE (0 to 600 mg/L; lane 1 = 0; lane 2 = 200; lane 3 = 400; lane 4 = 600). Nrf = nuclear respiratory factor; GPX1 = glutathione peroxidase 1; LXRα = liver X receptor α;
LDLR = low-density lipoprotein receptor; HMG-CoAR = 3-hydroxy-3-methylglutaryl-CoA reductase; PPARs = proliferator-activated receptors; β-A = β-Actin
Table 2─Effects of P. amarus extract on antioxidant gene expressions and lipid metabolism gene expressions in HepG2 cells
P. amarus extract (mg/L)
Antioxidant gene expressions (relative levels)
Lipid metabolism gene expressions (relative levels)
Nrf-1 Nrf-2 GPX1 LDLR HMGCoAR PPARα1 PPARγ LXRα
0 1.00±0.05 1.00±0.05 1.00±0.08 1.00±0.14 1.00±0.08 1.00±0.14 1.00±0.04 1.00±0.13 200 1.11±0.12 1.17±0.03* 1.04±0.01 1.38±0.07* 0.93±0.03 0.99±0.09 1.32±0.03* 0.93±0.04 400 1.00±0.17 0.99±0.02 1.02±0.01 1.39±0.08* 1.05±0.05 1.01±0.03 1.30±0.03* 1.12±0.04 600 0.48±0.07** 0.98±0.02 1.18±0.04* 1.28 ± 0.12 1.09±0.02 1.03±0.05 1.06 ± 0.05 0.92±0.06
Values derived from normalized band intensities are reported as means + SE from Figure 2. Values were calculated from at least three
independent experiments (n = 3). *,**P< 0.05 for significant change in normalized gene expressions as compared to control.
PPARγ is an essential regulator of redox signaling in the cardiovascular system and can protect against many cardiovascular disorders via transcriptional activation of antioxidant genes. PPARα/γ also was reported to play a role in regulating mitochondrial function. Activation of PPARs results in protection against different stressors by inducing mitochondrial biogenesis in combination with increasing key mitochondrial and anti-apoptotic proteins (e.g. Bcl-2) and reducing mitochondrial damage caused by oxidative stress. The other report found that PPARγ may play a role as an anti-toxic by inducing liver cells to deposit harmless lipids, and prevents the accumulation of toxic lipids in the liver. Moreover, PPARγ has a protective role against hepatotoxicity and may induce differentiation and apoptosis of various human malignant cells as well [42-44].
CONCLUSION
[image:6.595.100.515.516.589.2]and decrease cholesterol synthesis by induction of LDLR and PPARγ gene expressions thereby maintaining overall cellular homeostasis.
Acknowledgement
Research supported by the Rachadaphisaksomphot Endowment Fund Part of the Strengthen CU’s Researcher Project. The authors gratefully acknowledge the generous gift of the HepG2 cells from Assoc. Prof. Dr. Parvapan Bhattarakosol.
REFERENCES
[1] S Knasmüller; W Parzefall; R Sanyal; S Ecker; C Schwab; M Uhl; V Mersch-Sundermann; G Williamson; G Hietsch; T Langer; F Darroudi; AT Natarajan, Mutat Res., 1998, 402(1-2), 185-202.
[2] V Mersch-Sundermann; S Knasmüller; XJ Wu; F Darroudi; F Kassie, Toxicology, 2004, 198(1-3), 329-40. [3] S Knasmüller; V Mersch-Sundermann; S Kevekordes; F Darroudi; WW Huber; C Hoelzl; J Bichler; BJ Majer, Toxicology, 2004, 198(1-3), 315–328.
[4] JL Fang; T Han; Q Wu; FA Beland; CW Chang; L Guo; JC Fuscoe, Arch Toxicol., 2014, 88(3), 609-23. [5] W Sangkitikomol; T Tencomnao; A Rocejanasaroj, Genet. Mol. Res., 2010, 9(4), 2086-2095.
[6] W Sangkitikomol; A Rocejanasaroj; T Tencomnao, Genet. Mol. Res., 2014, 13(1), 723-735 [7] DP Aden; A Vogel; S Plotkin; I Damjanov; BB Knowles, Nature, 1979, 282(5739), 615–616. [8] BB Knowles; CC Howe; DP Aden, Science, 1980, 209(4455), 497–499.
[9] JR Patel; P Tripathi; V Sharma; NS Chauhan; VK Dixit, J. Ethnopharmacol., 2011, 138, 286-313. [10] M Wang; H Cheng; Y Li; L Meng; G Zhao; K Mai, J. Lab. Clin. Med., 1995, 126(4), 350–352. [11] AK Kiemer; T Hartung; C Huber; AM Vollmar, J. Hepatol., 2003, 38(3), 289–297.
[12] AA Adeneye; OO Amole; AK Adeneye, Fitoterapia, 2006, 77(7-8), 511–514.
[13] R Krithika; R Mohankumar; RJ Verma; PS Shrivastav; IL Mohamad; P Gunasekaran; S Narasimhan, Chem. Biol. Interact,. 2009, 181(3), 351–358.
[14] S Sen; R Chakraborty; C Sridhar; YSR Reddy, Int. J. Pharm. Sci. Rev. Res., 2010, 3(1), 91-100.
[15] T Ishii; K Itoh; S Takahashi; H Sato; T Yanagawa; Y Katoh; S Bannai; M Yamamoto, J. Biol. Chem., 2000, 275(21), 16023–16029.
[16] K Itoh; K Tong; M Yamamoto, Free Rad. Biol. Med,. 2004, 36(10), 1208 – 1213. [17] C Xu; CY Li; AT Kong, Arch. Pharm. Res,. 2005, 28(3), 249-268.
[18] EE Powell; PA Kroon, J. Clin. Invest,. 1994, 93(5), 2168-2174.
[19] TM Willson; MH Lambert; SA Kliewer, Annu. Rev. Biochem., 2001, 70, 341-367. [20] AC Calkin; P Tontonoz, Arterioscler. Thromb. Vasc. Biol., 2010, 30: 1513-1518. [21] D Kaul; AR Shukla; K Sikand; V Dhawan, Mol. Cell Biochem., 2005, 278, 177-184.
[22] VL Singleton; R Orthofer; RM Lamuela-Raventós, Method in Enzymology, Academic Press, Orlando, FL, USA, 1999, 299, 152-178.
[23] A Davalos; C Gómez-Cordovés; B Bartolomé, J. Agric. Food Chem., 2004, 52, 48-54.
[24] A. Rocejanasaroj1; T. Tencomnao; W. Sangkitikomol, Genet. Mol. Res., 2014, 13 (1), 205-219. [25] H Wang; JA Joseph, Free Radic. Biol. Med. 1999, 27, 612-616.
[26] D Huang; B Ou; RL Prior, J Agric Food Chem., 2005, 53(6), 1841-1856.
[27] JR Patel; P Tripathi; V Sharma; NS Chauhan; VK Dixit, J. Ethnopharmacol., 2011, 138(2), 286–313. [28] C Postic; R Dentin; J Girard, Diabetes Metab., 2004, 30(5), 398-408.
[29] P Pramyothin; C Ngamtin; S Poungshompoo; C Chaichantipyuth, J. Ethnopharmacol., 2007, 114(2), 169-173. [30] R Bhattacharjee; PC Sil, Phytother. Res., 2006, 20(7), 595-601.
[31] AB Granado-Serrano; MA Martin; L Bravo; L Goya; S Ramos, J. Nutr., 2006, 136(11), 2715-2721.
[32] C Chen; R Yu; ED Owuor; AN Kong, Arch. Pharm. Res., 2000, 23(6), 605-612.
[33] AN Kong; R Yu; C Chen; S Mandlekar; T Primiano, Arch. Pharm. Res., 2000, 23(1), 1-16.
[34] M Ohtsuji; F Katsuoka; A Kobayashi; H Aburatani; JD Hayes; M Yamamoto, J. Biol. Chem. 2008, 283(48), 33554–33562.
[35] G Shen; AN Kong, Biopharm. Drug Dispos., 2009, 30(7), 345-355. [36] W Li; AN Kong, Mol. Carcinog., 2009, 48(2), 91-104.
[37] E Lubos; J Loscalzo; DE Handy, Antioxid. Redox. Signal., 2011, 15(7), 1957-1997. [38] C Postic; R Dentin; J Girard, Diabetes Metab., 2004, 30(5), 398-408.
[39] P Nguyen; V Leray; M Diez; S Serisier; J Le Bloc'h; B Siliart; H Dumon, J. Anim. Physiol. Anim. Nutr. (Berl), 2008, 92(3), 272-283.
[43] G Medina-Gomez; SL Gray; L Yetukuri; K Shimomura; S Virtue; M Campbell; RK Curtis; M Jimenez-Linan; M Blount; GSH Yeo; M Lopez; T Seppänen-Laakso; FM Ashcroft; M Orešič; A Vidal-Puig, PLoS Genet., 2007, 3(4), e64