Investigation on the Effect of Sliding on Plasticity Prediction of
Reciprocating Sliding Contact with Linear Kinematic Hardening
Model
M.Nagentrau
1, a, W.A. Siswanto
1, b, A.L.Mohd Tobi
1, c1Faculty of Mechanical and Manufacturing Engineering, Universiti Tun Hussein Onn Malaysia, Batu
Pahat, Malaysia
a nagentrau.rau17@yahoo.com, b waluyo@uthm.edu.my, c abdlatif@uthm.edu.my
Keywords: Ti-6Al-4V, Sliding, Cylinder on flat, Kinematic hardening, Displacement
Abstract. This paper discusses an analysis of finite element modeling with cylinder on flat configuration of linear kinematic hardening models based on bi-modal Ti-6Al-4V cyclic stress-strain curves which undergoes a constant normal load and manipulated reciprocating tangential displacements such as 0.05 mm, 0.1 mm and 0.2 mm. The predicted plastic deformation evolution such as equivalent plastic strain, tangential plastic strain and shear plastic strain distribution on the contact region is analyzed along with its particular predicted stress distributions. The effect of applied sliding displacement on stress and strain distributions are also been focused. The predicted stress distribution for kinematic hardening model is almost similar for the all three sliding displacements mean while, the predicted plastic strain distribution is proportional to the reciprocating sliding displacement amount where, higher sliding displacement applied results in higher plastic strain distribution. The predicted plastic distribution values keep increasing when the sliding displacement varies from 0.05 mm, 0.1 mm until 0.2 mm. It is found that the strain effect of the model is relying on the sliding displacement amount.
Introduction
The characteristics of excellent corrosion resistance, formability and fatigue resistance makes titanium alloy as an attractive material which widely used in research to study its properties [1]. A progressive and continuous removal of material from its surface by a mechanical action which results in deformation is termed as wear [2]. The condition where two materials are forced to contact with the presence of sliding is known as sliding wear. Sliding wear is considered complicated type of wear as different material shows different respond under reciprocating sliding [3]. The study of deformation of solids that touch at one or more points is defined as the contact mechanics [4]. In addition, tribology is referred as the science of rubbing where science and interacting surfaces engineering act in a relative motion [5]. Friction is referred as a resistance to a motion where more than one bodies slide on each other with the presence of contact [6]. The tendency of material to experience a permanent deformation under the presence of force is termed as plasticity [7]. Besides that, the plastic deformation of ductile body is due to asperities of the harder body and a cyclic plastic shear strain is induced that accumulated by repeated cycles [8]. Moreover, the elastic plastic stress strain response plays a pivotal role in the designing and analyses of failure of engineering component [9]. The FE outcome for the gross sliding condition shows that delamination of wear mechanism comprising shear yielding, plastic deformation, ratcheting or shakedown, accumulation of plastic strain, multiple parallel cracking, TTB, debris and followed by wear [10]. Furthermore, the linear kinematic hardening is yield surface translation in stress
space via the back stress, α which comprised in evolution law of a model [11]. The displacement effect
Simulation Method
FE modelling
Cylinder-on-flat configuration is used as a model in this study. The dimension of flat plate is set as 100mmx24mmx8mm and the radius of the cylinder is 6.5mm. The elastic properties of Ti-6Al-4V is obtained from [10], meanwhile plastic properties is based on [12] as shown in Table 1 and Table 2.
Figure 1 shows FE model assembly where three element sets is elected to aid in applying parameters. The sets consist of Point load, Top and Bottom surface. In addition, 2000N of normal load, P was applied at the Point load and the Bottom surface is constrained in x and y directions. The equation type of constraint is assigned at the top set to ensure all the nodes of top surface move simultaneously and horizontally with the point load according to the displacement set for the analysis.
Table 1: Linear cyclic plasticity hardening properties of Ti–6Al–4V (Benedetti & Fontanari, 2004)
Table 2: Elastic properties of Ti–6Al–4V (Mohd Tobi et al, 2009)
Elastic properties of Ti-6Al-4V
Young’s modulus, E 115 GPa
Poisson ratio, v 0.342
Two types of surfaces such as master surface (cylinder contact surface) and slave surface (flat contact surface) have been created in this model. Besides that, Lagrange Multiplier contact algorithm is applied in the interaction properties to make sure exact stick condition when the shear stress is lower than critical shear value based on the friction law [4]. The friction coefficient is set as 0.9. Subsequently, four steps (including initial condition) have been applied during modelling process where normal load applied at point load during Step-1, the cylinder moves right then left and finally to the right again to complete one cycle during Step-2, Step-3 and Step-4. The movement of the cylinder either right or left is based on the elected displacements which have been manipulated as 0.05 mm, 0.1 mm and 0.2 mm. The mesh module of the model is created such that finer mesh is applied at contact region and mesh size is increased according to partition transition from contact region to further region. Quad structured mesh of 50 µm square mesh is implemented at the contact region, while Quad-free-advanced mesh is applied at the further region. The implementation of finer mesh at the contact region in order to grant better plasticity prediction and reduce the analysis computational time as the study mainly focus on contact region. The contact pressure (CPRESS) data is compared with Hertzian theoretical solution and previous research [10] to validate the model and proceed the study.
Cyclic plasticity properties of Ti-6Al-4V
Yield stress, σy 840 MPa
Results and Discussion
The evolution plastic strain distributions
Figure 3, Figure 4 and Figure 5 show that evolution of equivalent plastic strain (PEEQ) for linear kinematic hardening of sliding displacements of 0.05 mm, 0.1 mm and 0.2 mm respectively. Obviously, the value of PEEQ is higher at step 4 compared to step 3 and step 2 for all sliding displacements as plasticity accumulation occur based on sliding amount. In addition, the higher the sliding displacement the higher the PEEQ where 0.2 mm of sliding displacement showing higher value of plastic strain compared to 0.1 mm and 0.05 mm. The PEEQ graphs trend showing that there is less increment of plastic strain in step 4 compared with step 3 for all displacements but very significant in 0.2 mm displacement. Basically, the peaks at leading and trailing edges are due to plasticity effects on both edges as it is influenced by the direction of the movement of the cylinder.
Figure 6, Figure 7 and Figure 8 show that the tangential plastic strain (PE11) evolution of sliding displacements of 0.05 mm, 0.1 mm and 0.2 mm. According to the analysis it is noticeable that when the sliding displacement amount and number of steps increases more disturbances occur at the curve of the graph. Generally, more ripples found in the step 4 of all the displacement and the formation of ripples very significant at higher sliding displacement which leads to occurrence excessive movement and stretching
[image:3.612.65.547.72.211.2]Figure 9, Figure 10 and Figure 11 show that the shear plastic strain (PE12) evolution of sliding displacements of 0.05 mm, 0.1 mm and 0.2 mm respectively. The shear plastic strain (PE12) showing higher value compared with the tangential plastic strain (PE11) for all cases. In addition, maximum PE12 occurs at step 2 for all the sliding displacement. Obviously, when the number of steps and sliding displacement amount increases more disturbances occur at the curve of the graph same as the PE11, where more ripples can be noticed mainly at step 4 and higher displacement.
Figure 1: The model assembly Figure 2: Contact region mesh module
Figure 4: Equivalent plastic strain of displacement
[image:3.612.73.544.572.749.2]0.1 mm for linear kinematic hardening
Figure 5: Equivalent plastic strain of displacement 0.2 mm for linear kinematic
hardening Figure 3: Equivalent plastic strain
of displacement 0.05 mm for linear kinematic
The evolution of distribution tangential stress and shear stress
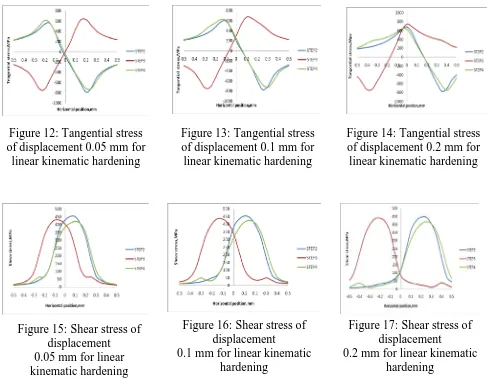
Figure 12, Figure 13 and Figure 14 show tangential stress (S11) evolution, while Figure 15, Figure 16 and Figure 17 show evolution of shear stress (S12) for linear kinematic hardening of sliding displacements 0.05 mm, 0.1 mm and 0.2 mm respectively. The tangential stress predicted to be higher at the trailing edges if compared with leading edges of the contact area for all displacements. It is predicted that the compressive stress has been occurred at the leading edges meanwhile the tensile stress occurred at the trailing edges. The compressive stress occurred at leading edge due to initial pressure of normal load which compresses the material. There are no much difference in tangential stress (S11) and shear stress (S12) for the sliding displacements amount of 0.05 mm, 0.1 mm and 0.2 mm. Besides that, tensile tangential stress and compressive tangential stress of step 3 look like mirrored as negative displacement occur from right to left for all the displacements. Generally, the stress does not show significant increment compared with the strain graphs.
[image:4.612.62.554.87.449.2]
Figure 6: Tangential plastic
strain of displacement 0.05 mm for linear kinematic hardening
Figure 7: Tangential plastic
strain of displacement 0.1 mm for linear kinematic hardening
Figure 8: Tangential plastic
strain of displacement 0.2 mm for linear kinematic hardening
Figure 9: Shear plastic strain of displacement 0.05 mm for linear
kinematic hardening
Figure 10: Shear plastic strain of displacement 0.1 mm for linear
kinematic hardening
Figure 11: Shear plastic strain of displacement 0.2 mm for linear
Discussion
Based on the analysis, it is obvious that the equivalent plastic strain (PEEQ) value increases as the sliding displacement amount increases. This as a result of the equivalent plastic strain (PEEQ) value is calculated based on the summation of the tangential and shear plastic strain values. Besides that, shear yielding effect of high frictional force causes the shear plastic strain is more significant than the tangential plastic strain. There are more disturbances occur at higher sliding amount of tangential and shear plastic strain, especially in step 4 as the flat plate might be stretched excessively and hardened due to excessive amount of sliding and load applied on repeated sliding. Basically, when it slides to the side, the fresh side causes the occurrence of new hardening which results in ripples on the graphs. Generally, fatigue will be influenced by the strain most on early cycles, but once hardened, there is no increment in plasticity strain and stress effect takes over. This phenomenon leads where the strain is increasing but stress remains same and does not show any significant changes.
Conclusion
[image:5.612.65.559.82.474.2]The core objective of this study is to investigate and predict the effect of sliding on the plasticity behaviour on Ti-6Al-4V titanium alloy where cylinder on flat surface configuration finite element modelling with linear kinematic hardening is used for this study. Apparently, in the process of predicting the plasticity the strain is much more significant than the stress. Besides that, the when the
Figure 12: Tangential stress of displacement 0.05 mm for
linear kinematic hardening
Figure 13: Tangential stress of displacement 0.1 mm for linear kinematic hardening
Figure 14: Tangential stress of displacement 0.2 mm for linear kinematic hardening
Figure 15: Shear stress of displacement 0.05 mm for linear kinematic hardening
Figure 17: Shear stress of displacement
0.2 mm for linear kinematic hardening
Figure 16: Shear stress of displacement
sliding amount is increases the strain distribution also increasing. The maximum sliding amount causes the formation of ripples on tangential and shear plastic strain graphs, where more disturbance occur on the 0.2 mm sliding model compared with 0.1 mm and 0.05 mm. As the predicted stress is saturated, the tangential and shear stress graph does not show significant changes.
Acknowledgements
The authors acknowledge the financial support by the Malaysian Ministry of Education and Universiti Tun Hussein Onn Malaysia (RESEARCH ACCULTURATION COLLABORATIVE EFFORT No. 1441).
References
[1] Joshi, V. A. (2006). Titanium Alloys (An Atlas of Structures and Fracture Features), CRC
PressTaylor & Francis Group, Florida, 7-15.
[2] Rabinowicz, E. (1995). Friction and Wear of Materials. 2nd Edition: Society of Tribologists and
Lubrication Engineers (STLE), 840 Busse Highway Park Ridge, IL 60068-2302 USA.
[3] Pirso, J., Letunovitš, S. & Viljus, M. (2004). Friction and wear behavior of cemented carbides.
Wear, 257, 257-265.
[4] Johnson K.L (1985). Contact Mechanics. Cambridge University Press, Cambridge.
[5] Bhushan, B. (1999). Priciples and Applications of Tribology.John Wiley & Sons, Inc.
[6] Gale, W.F & Totemeier TC. (2004). Smithells Metals Reference Book, 8th Ed. Elsevier Butterwirth-Heinemann.
[7] Kachanov, L.M. (2004). Fundamental of theory of plasticity. Amsterdam, north-Holland Pub Co., 1971, in series: North-Holland series in applied mathematics and mechanic ISBN 0-486-43583-0.
[8] Boher, C., Barrau, O., Gras, R., & Rezai-Aria, F. (2009). A wear model based on cumulative cyclic
plastic straining. Wear 267(5-8), 1087–1094.
[9] Jiang, Y. & Zhang, J. (2008). Benchmark experiments and characteristic cyclic plasticity
deformation.International Journal of Plasticity, 24(9), 1481–1515.
[10] Mohd Tobi, A.L., Ding, J., Bandak, G., Leen, S.B. & Shipway, P.H., (2009), A study on the
interaction between fretting wear and cyclic plasticity for Ti-6Al-4V. Wear, 267 pp. 270-282.
[11] Dassault Systemes, (2010). Abaqus Theory Manual. Version 6.10. RI, USA
[12] Benedetti M. & Fontanari V. (2004). The effect of bi-modal and lamellar microstructure of Ti–
6Al–4V on the behavior of fatigue cracks emanating from edge notches. Fatigue Fracture of