DENOISING OF AUDITORY BRAINSTEM RESPONSE VIA
DIFFUSION AND WAVELET TRANSFORM
HASSAN HAMID EKAL
CHAPTER 1
INTRODUCTION
1.1 Overview
Event-related potentials (ERPs) can be roughly defined as the changes of the ongoing electroencephalogram (EEG) due to stimulation. They have low amplitude in comparison with the background EEG activity and in consequence, they are hardly visualized in the single-trials. The usual way of improving the visualization of the ERPs is by averaging the responses over several trials. However, ensemble averaging relies on the basic assumption that the ERPs consist of an invariant pattern time-locked to the stimulus, laying on an independent stationary stochastic EEG signal. Several techniques have been proposed in order to improve the visualization of the ERPs. Most of these approaches involve filtering of the single-trial traces, in particular using techniques based on the Wiener formalism, which provides an optimal filtering in the mean square error sense. However, these approaches have the common drawback of considering the signal as a stationary process.
1.2 Brainstem Auditory Evoked Potentials
Evoked potentials (EPs) are bioelectrical signals generated by the central nervous system (CNS) when it is stimulated by well-defined external events [4]. Common types of stimulation include visual, audio and electrical. The analysis of EP signals is very meaningful in many clinical applications such as the diagnosis of possible brain injury and the intra-operative monitoring of the functionality of the spinal cord. One of the methods for diagnosing a human brain is examination of evoked potentials (EP) which allows for monitoring and registering bioelectrical activities of the brain while given external stimuli. By using EP one can examine sight and hearing and evaluate responses to different stimuli that activate different parts of the brain, depend on the functionality of the brain and its response.
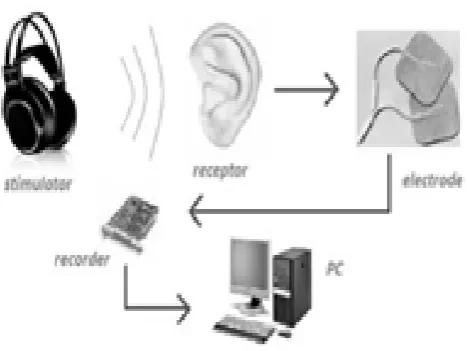
[image:3.595.233.467.549.724.2]Brain activity is closely associated with movements of ions and charge polarization or divergence. Electric charges that are moving within the nerve structures can be recorded and received in the form of electric potential or electrical pulses. If we stimulate a sensory-sensual receptor we will automatically receive the response in the form of an electrical signal that can be display as pulses. Evoked potentials are generated this way. Under the influence of acoustic stimuli in the auditory pathway, the ear, which is a sensory receptor (Fig.1.1), produces voltage changes, known as auditory evoked potentials [1].
It is shown that EP signals have non-stationary, time-locked characteristics and always accompanied by ongoing electroencephalogram (EEG) signals which are considered noises in EP analysis. Furthermore, the amplitude of the EEG signal is much higher than that of the EP signal. Evoked potentials are according to response time to stimulation that generates the response. In biomedical terminology, the response time is referred to as latency where in technical nomenclature it would be called a delay. Three types of potentials; short, medium and long latency potentials are the classification of auditory evoked potentials which depend to the reaction time. Considering their clinical suitability, only Short Latency Auditory Evoked Potentials (SAEP) often referred to as Brainstem Auditory Evoked Potentials (BEAP) is taken into account.
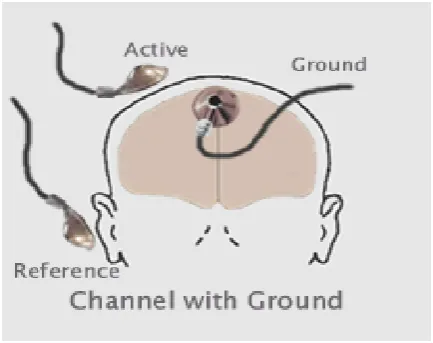
[image:4.595.211.428.532.703.2]The classical digital filtering methods cannot separate the EP and EEG signals from each other due to their significantly overlapping spectra. Therefore, ensemble averaging (EA) is the most widely used method for the estimation of EP signals from noisy background noise of the (EEG). EA method can improve SNR with the assumption that the underlying EP signal is roughly identical in each stimulus while the noise signal is a zero mean random process. Hundreds even up to thousands of trials are averaged to obtain a reliable EP estimation which depending on the different type of EP signals. An Electro-Cap consists of electrodes is used to record EEG signals from positions shown in the given image fig 1.2.
1.3 Wavelet Transform
Almost all biological signals are non-stationary like electrocardiogram (ECG), which refers to the electrical activity of the heart), electroencephalography (EEG) and electromyography (EMG) or electrical activity of the muscles. Once the time localization of the spectral components is required, the transform giving the time-frequency representation of the signal is needed in this case. The Fourier transform (FT) gives the frequency information of the signal which means that it tells us how much of each frequency exists in the signal. FT is not a suitable technique for non-stationary signal. That means if we want to know what frequency spectral component occur at what time interval then FT is not the right transform to use in this issue [2]. The Wavelet transform (WT) solves the problem of resolution by using Multi-resolution analysis property. The wavelet transform is a tool that cuts up data functions or operators into different frequency components and then studies each component with a resolution matched to its scale [1] .
A wavelet is a wave-like oscillation with amplitude that starts out at zero then increases and decreases back to zero. Wavelets can be combined using a "Shift, Multiply and Sum” technique called convolution, with portions of a noise signal to
extract information from the EEG signal [2]. The CWT performs a multi-resolution analysis by contraction and dilatation of the wavelet functions. The Continuous Wavelet Transform (CWT) is a method based on the Short Time Fourier Transform’s
1.4 Background of the Study
1.4.1 Introduction to Bio-potentials
Bio-potentials in human cells are of electric nature that is caused by chemical reactions of charged ions within the cells. These bio-potentials are used in transferring information between and within the cells. These cells usually exhibit resting potential until they are stimulated where an action potential is consequently generated.
1.4.2 Anatomy and Function of the Brain
The nervous system is the body’s decision and communication center. It consists of
the spinal cord that is protected by the vertebral column and the brain that is protected by the skull and both of them represent the central nervous system (CNS). The peripheral nervous system (PNS) consists basically of nerves spread all over the body.
The nerves are reaching from the brain to the face, eyes, ears, nose, and spinal cord and from the spinal cord they reach to the rest of the body. The sensory nerves gather information from the environment around and send this info to the spinal cord which transfers it to the brain. The brain then makes sense of this received info and fires responses carrying instruction that are delivered by the neuron motors to other parts of the body. The spinal cord consists of bundle of nerves going up and down the spine delivering the messages to and from the brain at every second.
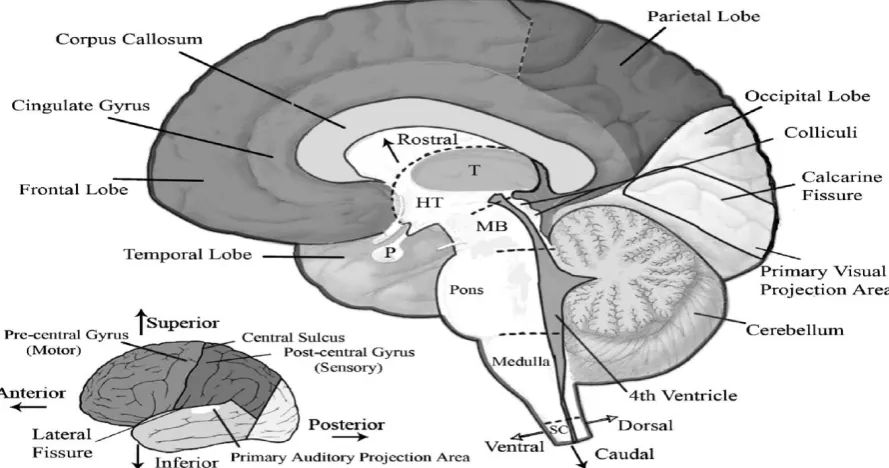
Figure 1.3: Anatomical structure of the brain with anatomical planes explained at the left bottom of the diagram. Courtesy of [5]
The brain can be divided into three main parts; Cerebrum, brainstem, and cerebellum. The cerebrum or cortex is the largest part of the brain and it controls the conscious functions and higher brain functions such as thought and action. The brainstem can be explained as an extension of the spinal cord and it connects between the cerebral cortex, spinal cord and cerebellum. It controls different vital life functions like blood pressure, ventilation and heartbeat and it also works as an integration center for different motor reflexes. The cerebellum controls the voluntary muscle system, maintains and coordinates movement, balance, and posture of the body and provides harmonious muscle system by working in conjunction with the brainstem and cerebral cortex.
1.4.3 Bioelectric Potentials from the Brain
The unipolar recordings of the cortical surface with respect to a remote reference potential is viewed as a measurement of the field potential at the surface of a conductor. In normal conditions, the influence of the action potentials conducted by axons in the cortical medium is negligible because they do not contribute much to the integrated surface potential since they run asynchronously and they go in many directions with respect to the surface.
Pyramidal cells of the cerebral cortex create open potential field where current may run through because of the potential change in one part of the cell with respect to other since they are oriented vertically and their dendrites are running parallel to each other. The current would run in a closed path through the dendrites and cell body. The body cell would behave as a source (+) and the dendrites would behave as sink (-). The influence of dendrites potential on the cortical surface recording depends on its sign where (-) indicates excitatory and (+) indicates inhibitory and it also depends on the location with respect to measurement point [5].
On the other hand, nanopyramidal cells in the neocortex do not contribute much to surface potential recording since the dendrites are arranged radically around their cell bodies and therefore the potential difference between dendrites and cell bodies produce current that usually sums up to zero.
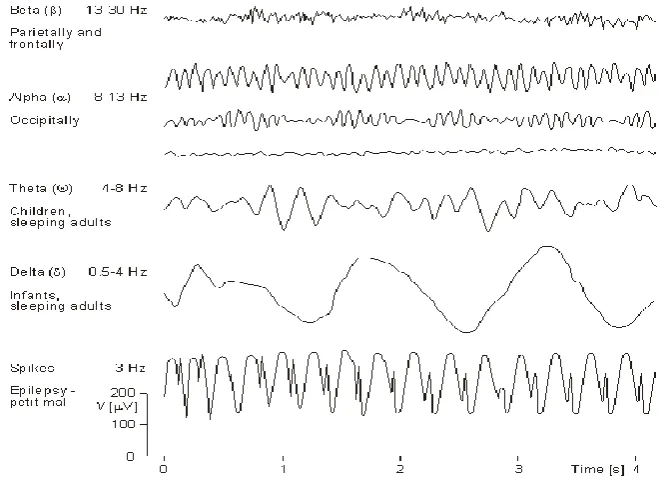
Electric recordings from the outer surface of the head show continuous oscillating electric activity within the brain. The intensity and patterns of this electric activity is determined mainly by the overall excitation of the brain resulting from functions in the brainstem reticular activating system (RAS). The recorded signal called electroencephalogram (EEG) and it consist of different waves that are alpha, beta, theta and delta.
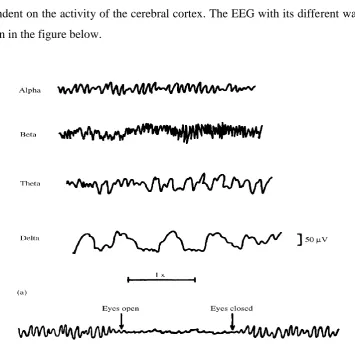
The intensity of the brain waves varies when recorded on the surface of the brain and when recorded on the scalp. On the surface the amplitude may be as large as 10mV while the amplitude is smaller on the scalp that it can be 100 µV. The frequencies of those brain waves may range from 0.5 to 100 Hz and their characteristics are highly dependent on the activity of the cerebral cortex. The EEG with its different waves is shown in the figure below.
The system that is mostly used to record EEG is the international federation 10-20 system shown in the figure below.
Figure 1.5: 10-20 system that is recommended by the international federation of EEG Societies. Courtesy of [5]
EEG electrodes have to be small, comfortable to the patient, cause minimal disturbance of the hair when connected to scalp and they should stay in place for a long period of time. The surface of the scalp has to be prepared before EEG recording by cleaning it with alcohol, place the electrodes to the scalp with a glue and hold them with rubber strap or technician can easily use rubber cap that contain all electrodes.
Evoked potentials (EP) are another type of biopotentials generated in the brain as event-related electrical responses to different stimulation from the nervous tissues. The most common ones are Auditory evoked potentials (AEP), Visual evoked potential (VEP), and Somatosensory evoked potential (SEP). They are recorded in the same manner as EEG but have lower amplitudes than EEG.
1.5 Applications of evoked related potential
Thousands of ERPs’ studies have been published up to date, for a wide range of
applications.
Some examples are listed below in no particular order.
Attention problems
Substance abuse
Visual emotion processing
Schizophrenia
Alzheimer
Sleep research
Memory and language processing
Mild traumatic brain injury
Learning disabilities
Autism
1.6 Problem statement
Auditory brain response (ABR) carried a very important data for many clinical applications therefore designing filter to remove its’ noise with less degradation is
very necessary. Almost all biological signals are non-stationary including electroencephalography (EEG). Once the time localization of the spectral components is required, the transform giving the time-frequency representation of the signal is needed in this case.
1.7 Objectives
To extract a single trial of auditory brain response (ABR). To denoise ABR data using wavelet and diffusion filter.
1.8 Significance of the Study
The results of the research work could be helpful in the following issues: 1- Understanding the importance of spectral analysis in explaining ABR data
2- Investigating the ABR signal data represented in a one-dimensional representation 3- Managing frequency content analysis in connection with timing properties in a
healthy and normal hearing recorded ABR data.
4- Helping in classification of individuals based on their responses to different sound stimuli.
5- Clinical psychiatric diagnostic investigation; EEG is typically used in the following clinical circumstances.
a. To distinguish epileptic seizures from other types of spells
b. To differentiate encephalopathy or delirium from primary psychiatric syndromes such as catatonia
c. To serve as an adjunct test of brain death
d. To prognosticate, in certain instances, in patients with coma e. To determine whether to wean anti-epileptic medications
1.9 Scope of the project
CHAPTER 2
LITERATURE REVIEW
2.1 Overview
This chapter introduces the history of auditory brain response and explains in details about its background theories of extraction. It also introduces several previous papers that had been published related to its filed. Furthermore, several applications of the proposed algorithms are discussed in details and explained their method and work. Finally a brief discussion on the drawback of the previous methods and the important of obtain auditory brain response data is explained precisely.
2.2 History and Background of EEG signal
The human brain consists of billions of neurons making it a very complex integration system, connecting through different chemical and electrical processes. The brain receive information from all over the body by synapses of the nervous system and reacts to them by sending pulses to control all kind of functions done by the human being and also integrate different information that regulate the body’s vital function
The brain has been the subject of many intensive researches to study its complex system functions starting from the atomic level of the brain to the very high processes such as memory. Richard Caton has demonstrated in 1875 that electrical signals can be recorded on the cerebral cortex of rabbits and dogs and several years later, Hans Berger recorded the first electrical process on human scalp [6]. From the nature of these brain waves, he observed that brain waves differ according to the mental state of the subject itself and between different individuals with different neurological health aspects.
Here we introduce the electroencephalography (EEG) and evoked potentials (EP) as measurement techniques used to study the human brain activity and complexity and we also also present some signal processing techniques in neurological application which can be used for better data extraction, denoising and presentation.
2.2.1 The electroencephalography (EEG)
The EEG measurement exhibit oscillatory and repetitive measurements and referred to as rhythm. The measurement of a single cortical neuron cannot be performed due to the attenuation of the signal caused by different tissue layer; therefore, the measurement is recorded by placing a number of electrodes on the scalp that can measure the currents produced from the electric field generated by the joint of millions of neurons during the synaptic excitation of dendrites.
The signals recorded from the scalp vary between individuals according to their age, mental state and activity. The signal amplitude range from few microvolts to 100 μV with a frequency ranging between 0.5 to 30-40 Hz [7]. EEG rhythms are
Delta rhythm: Typically found during deep sleep with high amplitude and a frequency of <4Hz.
Theta rhythm: Found during drowsiness and in certain sleep stages with frequency of 4-7 Hz.
Alpha Rhythm: Found during relaxation with eyes closed with a frequency of 8-13 Hz.
Beta rhythm: Fast rhythm with low amplitude and usually found during activated cortex and in certain sleep stages with frequency of 14-30 Hz.
Gamma rhythm: Found during an active information processing of the cortex with a frequency of >30 Hz.
Spikes and sharp waves (SSWs) are transient waveforms (time domain), they have “irregular unpredictable temporal pattern” and their presence on subjects indicate
epileptic seizures.
[image:17.595.163.496.472.713.2]The figure below shows the different rhythms of EEG with their respected frequency band, occurring area, and what do they stand for. It also shows the spikes and sharp waves.
2.2.2 Evoked Potentials (EP)
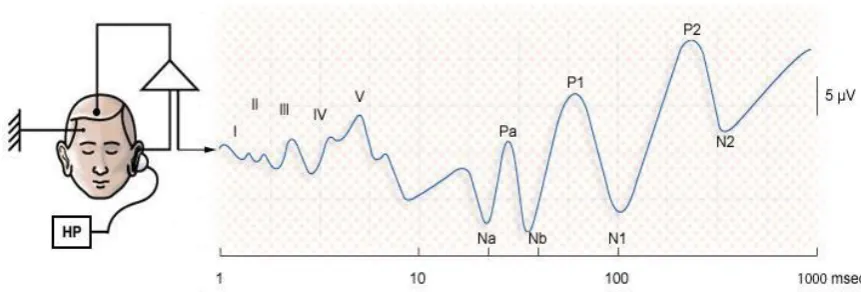
EPs are event-related activity that occurs as electrical response from the brain to different sensory simulations of nervous tissues. They are recorded in the same manner as EEG and they provide information on sensory pathways and abnormalities. The recorded data is presented as transient waves and investigated based on their morphology which depends on the type and strength of the stimulus and positioning of electrodes on the scalp [8].
The most common EPs are Auditory evoked potentials (AEP), Visual evoked potential (VEP), and Somatosensory evoked potential (SEP). EPs have amplitudes that range between 0.1 to 10 μV while EEG can have amplitudes that may reach up to 100 μV; therefore, signal processing techniques such as averaging are commonly
used to extract these EPs.
The figure below illustrates an auditory evoked potential with amplitude up to 5 μV and a latency response about 10 ms with their different waves and potentials at
[image:18.595.113.544.482.628.2]different time instants.
2.2.3 Evoked Potential (EP) Noise Reduction
The techniques that will be used for noise reduction in EP in this project are two types of filtering: wavelet filter and diffusion filter. These two techniques will be used to denoised the averaging single trial of auditory brain response. Averaging can be in the form of: homogenous ensemble averaging, weighted averaging, and exponential averaging. Homogenous ensemble averaging and weighted averaging require dividing the EP vector data into subsets of different EPs in each subset. Small subsets are used with high signal-to-noise ratio (SNR) EPs and they also help in showing the changes of EPs amplitudes over time. Big subsets are used for low SNR EPs to minimize the noise on EPs but they are not efficient when it comes to changes of EPs over time.
Exponential averaging does not require the division of data onto subsets because the nature of exponential averaging treats one EP at a time in a recursive fashion. Therefore, the denoising filters will be applied for the homogenous ensemble average for the purpose of extraction and denoising of the auditory brainstem response under varies range of frequency response.
2.3 Previous Work Related To Evoked Potential (Auditory Brain Response)
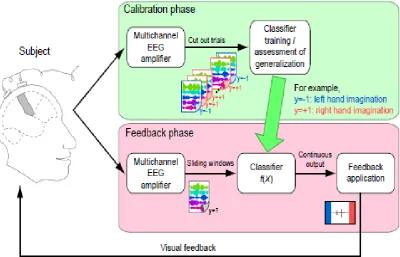
2.3.1 Optimizing Spatial Filters for Robust EEG Single-Trial Analysis
Due to the volume conduction multi-channel electroencephalogram (EEG) recordings it gives a rather blurred image of brain activities. Therefore spatial filters are extremely useful in single-trial analysis in order to improve the signal-to-noise ratio of its response. In this algorithm it elucidates the theoretical background of the Common Spatial Pattern (CSP) algorithm [9].
[image:20.595.135.536.382.639.2]The system runs in two phases as shown in the figure illustrated below. In the calibration phase it instructs the subjects to perform certain tasks and collect short segments of labeled EEG trials. The classifier is trained based on these examples of the collected trials. However, in the feedback phase it takes sliding windows from continuous stream of EEG.
2.3.2 Feature Article Neural Dynamics and the Fundamental Mechanisms of
Event-related Brain Potentials
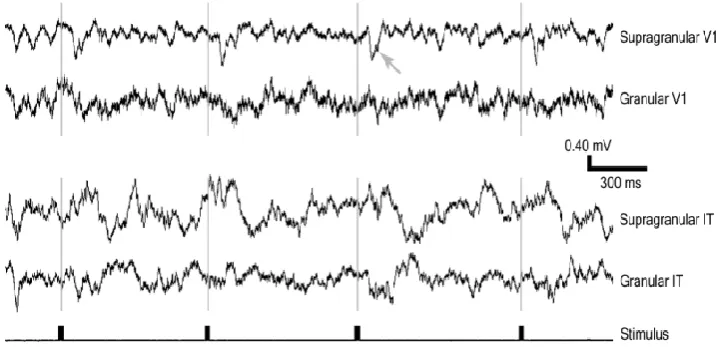
Event-related potentials (ERPs) provide a critical link between the hemodynamic response as measured by functional magnetic resonance imaging and the dynamics of the underlying neuronal activities. Single-trial ERP recordings capture the oscillatory activity that are hypothesized to underlie both communication between brain regions and amplified processing of behaviorally relevant stimuli. The precise interpretations of ERPs are precluded by uncertainty about their neural mechanisms. Influential theory holds that averaged sensory ERPs are generated by partial phase resetting of ongoing electroencephalographic oscillations while another states that ERPs result from stimulus-evoked neural responses.
In this paper, it formulated critical predictions of each theory and tested these using direct intra-cortical analyses of neural activity in monkeys [10].
Its findings support a predominant role for stimulus-evoked activity in sensory ERP generation and they outline both logic and methodology necessary for differentiating evoked and phase resetting contributions to cognitive and motor ERPs in future studies.
[image:21.595.113.474.505.678.2]2.3.3 Multiple Channel Detection of Steady-State Visual Evoked Potentials for
Brain-Computer Interfaces
In this paper, novel methods for detecting steady-state visual evoked potentials using multiple electroencephalogram (EEG) signals are presented. However, the methods are tailored for brain-computer interfacing where fast and accurate detection is of vital importance for achieving high information transfer rates.
In this paper high detection accuracy using short time segments is obtained by finding combinations of electrode signals that cancel strong interference signals in the EEG data. Collected data from a test group consisting of 10 subjects are used to evaluate the new methods and to compare them to standard techniques. It used one second signal segments with six different visual stimulation frequencies could be discriminated with an average classification accuracy of 84% as given in the paper.
An additional advantage of the presented methodology is that it is fully online where there is no calibration data for noise estimation and feature extraction or electrode selection is needed [11].
2.3.4 Enabling Fast Brain-Computer Interaction by Single-Trial Extraction of
Visual Evoked Potentials
This paper investigates the challenging issue of enabling fast brain-computer interaction to construct a mental speller. Using visual evoked potentials as communication carriers an online paradigm called imitating human-natural reading is realized. This online paradigm single-trial estimation with the intrinsically real-time feature should be used instead of grand average that is traditionally used in the cognitive or clinical experiments. Using several montages of component features from four channels with parameter optimization it explored the support vector machines based single trial estimation of evoked potentials [21].
[image:23.595.119.535.390.569.2]The results on a human subject show the advantages of the inducing paradigm used in this mental speller with a high classification rate.
2.3.5 Adaptive filtering to reduce global interference in non-invasive NIRS
measures of brain activation: How well and when does it work?
In this paper and referring to the previous work where they introduced a novel method for reducing global interference based on adaptive filtering that will result in improving the contrast to noise ratio (CNR) of evoked hemodynamic responses measured non-invasively with near infrared spectroscopy (NIRS). The proposed adaptive filtering method is explained here and it elaborates how it used in this paper. A total of 156 evoked visual response measurements collected from 15 individuals were analyzed with adaptive filtering.
The similarity (correlation) between measurements with far and near source detector separations collected during the rest period before visual stimulation was used as indicator of global interference dominance. Detailed analysis of CNR improvement in oxy-hemoglobin (O2Hb) and de-oxy-hemoglobin (HHb) as a function of the rest period correlation coefficient was used. Results show that for O2Hb measurements there is 66% exhibited substantial global interference. However, this dataset dominated by global interference with 71% of the measurements revealed CNR improvements after adaptive filtering with a mean CNR improvement of 60%. There was no CNR improvement observed for HHb [12].
Figure 2.7: Adaptive filtering in removing global interference
The figure above is a representative case of adaptive filtering to remove global interference to recover hemodynamic changes elicited by visual stimulation. (a) Probegeometry schematic; (b) The time series at the top shows O2Hb concentration changes calculated from opt ode pair S1–D11 (near detector). The time series in the second row shows O2Hb concentration changes calculated from opt ode pair S1–D12 (middle detector), before adaptive filtering. The CNR in this case was 55.3%. The time series in the third row shows the results of low-pass filtering (cut-off frequency: 0.125 Hz). Finally, the time series at the bottom shows the results of adaptive filtering applied to the top time series. Adaptive filtering increased the CNR to 187.3%. The gray bands on the time series depict visual stimulation periods.
2.3.6 Denoising of Single-trial in matrix representation using non-linear
diffusion filter
Evoked potentials are the signals recorded from the brain in response to external stimulation. The brain responses can be elicited by electrical stimulation, visual stimulation or auditory stimulation (auditory evoked response). The brain’s
References
[1] Suhas S. Patil , Minal K. Pawar ,”Quality advancement of EEG by wavelet denoising for biomedical analysis”, 2012
[2] Letian Wang, “Artifact Correction for EEG Alpha Wave Measurements”, Master of Science Thesis, Delft University of Technology, Sept. 2009
[3] Estrada, E. , Nazeran H. , Sierra G. , Ebrahimi F. , Setarehdan S.K. , “Wavelet-based EEG denoising for automatic sleep stage classification” ,2011.
[4] Feng Bi, T. Qiu,”Robust Adaptive Estimator for Evoked Potentials Based on Non-Linear transform under Impulsive Noise Environments”, 2011
[5] John W. Clark Jr, “The origin of bio-potentials”, chp4, 2008
[6] Stern, Rober Morris, William J. Ray, and Karen S. Quigley. Psychophysiological recording. Oxford University Press, USA, 2001.
[7] Gopal Krishan,"Brain Signals and Alcoholism", 2013
[8] Abdulrahman Alwan,"Implementation of Wavelet-Kalman Filtering Technique for Auditory brainstem Response",2012
[9] Blankertz,"Optimizing Spatial filters for Robust EEG Single-Trial Analysis",2008
[10] AS Shah, "Feature Article Neural Dynamics and the Fundamental Mechanisms of Event-related Brain Potentials", 2004
[11] O Friman, "Multiple Channel Detection of Steady-State Visual Evoked Potentials for Brain-computer Interfaces", 2007
[12] Q Zhang, "Adaptive filtering to reduce global interference in non-invasive NIRS measures of brain activation: How well and when does it work?",2009 [13] I Mustaffa, "Denoising of Single-trial in matrix representation using
non-linear diffusion filter ",2010
[14] P Bansal, "Evoked potential denoising with Adaptive filter ",2009
[15] MR Hajiaboli, "Diffusion Filters for Structured Noise Removal ",2011
[17] C Vaz , "Wavelet Transform in Wireless Communication Channels ",2010
[18] A Al-Haj, "Wavelet Transform as Pre-Processing in Neural Networks ",2008
[19] Victor Sucic,"Estimating the number of components of a multicomponent nonstationary signal using the short-term time-frequency Rényi entropy".2011
[20] Walter J. Freeman, Rodrigo Quian,"Imaging Brain Function with EEG: Advanced Temporal and Spatial Analysis of electroencephalographic signals", 2013
[21] M Chen, "Enabling Fast Brain-Computer Interaction by Single-Trial Extraction of Visual Evoked Potentials",2011
[22] F Luisier, "A New SURE Approach to Image Denoising: Interscale Orthonormal Wavelet Thresholding ",2012
[23] F Liu, "Diffusion filtering in image processing based on wavelet transform ",2006
[24] G Bhawna, "Image Compression and Frame Transmission of Video using Multi-Resolution Wavelets Transform ",2010
[25] Nurettin Acır, Özcan Özdamar,"Automatic classification of auditory brainstem responses using SVM-based feature selection algorithm for threshold detection", 2007
[26] Corona-Strauss FI, Delb W, Schick B, Strauss DJ, "Phase stability analysis of chirp evoked auditory brainstem responses by Gabor frame operators.",2009 [27] Heinar A. Weiderpass,"Steady-state sweep visual evoked potential processing
denoised by wavelet transform", 2008
[28] peter J. Olver,"Nonlinear Partial Differential Equations", chapter 12,2012
[29] Abderrahim Elmoataz,"Image and Signal Processing", 3rd International Conference, ICISP 2008