© 2017, IRJET | Impact Factor value: 5.181 | ISO 9001:2008 Certified Journal
| Page 1000
Sentiment Analysis in R on AWS cloud
Amisha Tiwari
11
Student, 7th semester, Dept. of CSE, BIT Mesra, Ranchi, Jharkhand, India
---***---Abstract -
R provides explicit support for sentiment analysis done on the tweets/posts uploaded via different people using text mining technique. Text mining technique utilizes the tidytext package and other tidy tools in R. This treats data as data frames of individual words allowing text mining tasks to be easier and more effective. However, in today's scenario, much of the data being uploaded is unstructured and proliferating at a fast pace. Hence, analyzing such a large corpora increases computational workload and is often limited by the available main memory of a single machine. Hence, this paper focuses on fetching, storing, and analyzing the data on the cloud in order to overcome all the problems encountered in analyzing unstructured big data. Cloud comprises of the essential characteristics of service models such as Software as a Service (SaaS), Platform as a Service (Paas), Infrastructure as a Service (IaaS). AWS, a subsidiary of Amazon.com is IaaS that offers IT infrastructure or remote computing services such as storage, database, networking, analytics and much more forming a pool of shared resources.Key Words: AWS, EC2, S3, RStudio server, Tidytext
1. INTRODUCTION
R, an environment for statistical computing has inbuilt support for text mining techniques which make use of natural language processing(NLP) and computational linguistics to identify and extract sentiments out of the text posted. Social Media platforms like Twitter, Facebook, Quora, Blogs etc. play a significant role in sentiment analysis to extract insights, feedbacks, influencing factors and much more. Our paper focuses analyzing sentiments via twitter platform using its API.
Tweets extracted may not always be in the tidy or structured format. Hence, R inculpates package Tidytext along with other tidy tools for both text pre-processing(text cleaning) as well as post-pre-processing(text classification, text clustering, and text visualization).
Tweets extracted inflate at a very large pace and hence, our focuses to set up R environment on the cloud machine for data uploading, data analyzing, and retrieving results. For, testing purpose RStudio server can be set up on AWS free tier providing some of the services free for 12 months and rest other services that will never expire. AWS free tier is a cloud computing service and hence, the user just does not need to keep the datacenter running all the time.
Hence, this is a pay as you go service and cuts large conventional costs quite often related with a large number of resources [1].
Hence, all our backend components are utilizing cloud services for efficient storage and computing. Therefore, a user doesn't need to bother with any kind of implementation or maintenance. Any user can utilize cloud-based services in three ways: Software as a service(SaaS), Platform as a service(PaaS), Infrastructure as a service(IaaS) [2].
1.1 Cloud Computing Services
Infrastructure as a Service
This cloud computing service provides virtualized hardware where a user makes use of cloud provider's virtualized server and runs software on it. Hence, a user can outsource the elements of infrastructure for which he would be charged according to a number of resources allocated and consumed by his machine. By this way, the user has full control to choose the components for computing and storage resources to scale according to his/her organizational needs. For example, Windows Azure VMs and Networks, AWS storage etc.
Software as a ServiceUsing this cloud computing service, cloud vendors provide us with the applications running on their own servers which we want to use. These applications can be accessed from anywhere/ anytime from any smart device. Therefore, costs for installing and maintaining the applications can be eliminated completely. These applications can even be customized to a certain degree by the developers using API or any other method of the application. Hence, no investment at user side for infrastructure or software licensing is required. For example, Microsoft Office 365, Facebook, Twitter etc.
Platform as a service© 2017, IRJET | Impact Factor value: 5.181 | ISO 9001:2008 Certified Journal
| Page 1001
down on demand. All the OS updates and hardware upgrades are automatically done by the service provider. For example, Force.com, Google App Engine, OS Microsoft Azure etc.
1.2 Our Utilized AWS Services
Our paper focuses mainly on AWS(IaaS) for setting up RStudio server, uploading data and analyzing it and finally fetching results.
Hence, at first, an EC2 instance would be launched for starting a server. Afterwards, we would be building R environment on the server. This EC2 instance would then utilize S3 service for storing and reading data to be analyzed [3].
EC2 ServiceAmazon Elastic Compute Cloud (Amazon EC2), one of the essential parts of cloud computing platform, is a web service providing scalable and secure computing capacity in the AWS cloud. Hence, this can be used by any user to launch AWS servers to build and host software systems according to his/ her need in Amazon's Data Center. Different data centers are at different geographical locations that even allows a high level of redundancy which makes any application resilient to failure. If not utilizing AWS free tier, the user would pay by the hour for active servers according to the server functionalities. Hence, we utilize this service to launch our RStudio server on AWS cloud.
S3 Service
Amazon Simple Storage Service (Amazon S3), cloud storage service is a simple storage web service providing scalable, reliable, fast and inexpensive data storage infrastructure used to simply collect, store and analyze data in a pragmatic manner. Uploading and retrieval utilize Amazon S3 console which internally uses its APIs for developer access in order to create a bucket for the same operations. All the data inside the bucket is held with proper security and authentication. Hence we utilize this service to upload, analyze the data and afterward to retrieve the results.
2. Conceptual Process and Framework
A text mining task has always been one of the challenging tasks in the field of data analytics because of the fact that text grows at a very fast pace that too in an unstructured manner. Considering any social media platform, be it Twitter, Facebook, or Quora on which daily, over millions of people discuss various issues makes text mining for identifying and extracting sentiments of different people
even more difficult. Moreover, sentiment analysis requires the complete understanding of the meaning of the text according to the context in which it is used and that is why sometimes even same texts can have different meanings associated with them. So basically, our paper would focus on eliciting useful and viable information out of growing heterogeneous input texts in the form of tweets basically, posted on social media website Twitter.
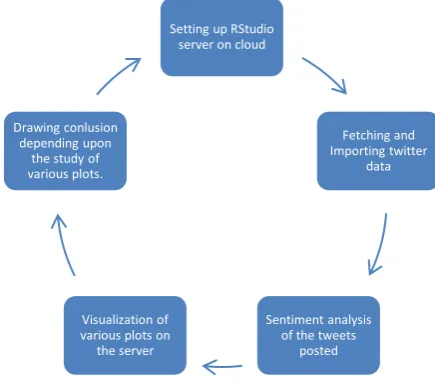
Fig -1: Flowchart demonstrating conceptual process and framework
3. Setting up RStudio
RStudio is a popular IDE for building R environment which has recently become one of the essential open source statistical environments for big data analytics and data science. Also, it provides instantaneous scaling up or down the configurations according to one's need in order to save costs. If not satisfied with a single machine, cluster of hundreds of machines can be created for distributed parallel computing tolerating high levels of redundancy and latency optimization.
Below we describe steps to setup R environment on AWS Cloud:
1. If not having an account on AWS, signup for an AWS account in order to use all of its features. Negligible charges are incurred for creating an AWS account [4]. 2. Before launching an instance, one can define Identity
Access Management (IAM) roles and policies. An IAM role justifies the role of any user accessing instance i.e. what can/ can't be done by the user. A single IAM role can be used by any user who wants to access that particular instance irrespective of the fact he/ she has created that instance. Any user needing access would be supplied with access keys which are created dynamically while assigning him the role.
Setting up RStudio server on cloud
Fetching and Importing twitter
data
Sentiment analysis of the tweets
posted Visualization of
various plots on the server Drawing conlusion
[image:2.595.345.563.207.399.2]© 2017, IRJET | Impact Factor value: 5.181 | ISO 9001:2008 Certified Journal
| Page 1002
A role at maximum can have 10 IAM policies attached to it in which a policy is a document stating one or more permissions and comprising of several modules such as syntax, descriptions, variables, logic, and several other elements.
For our purpose, we have to create a policy for accessing S3 storage service for storing and retrieving data. Hence, for creating policy: https://console.aws.amazon.com/iam. -> LHS (navigation column) -> Policies -> Create Policy -> Create Your Own Policy -> Provide name and description and Bash Script of Policy for accessing S3 [5] -> Validate Policy -> Create Policy.
For defining role and attaching created policy: https://console.aws.amazon.com/iam. -> LHS (navigation column) -> Roles -> Create New Role -> Role Type (Amazon EC2) -> Attach above created policy or some inbuilt policies if needed (Maximum 10) -> Provide Name -> Create Role.
Above created Role will allow EC2 instances to call AWS services on user's behalf according to the permissions set by the Policy being attached to the Role. Next step would be launching an EC2 instance.
3. For launching an Elastic Compute Cloud instance:
AWS Management Console -> Services -> EC2 -> Launch Instance
4. Choose Amazon Machine Image (AMI) according to the operating system to be installed such that it incurs no additional cost and has a stable version of R in its repository. For, analysis we have chosen Amazon Linux AMI 2017.03.1 (HVM), SSD Volume Type - ami-4fffc834
5. Choose Instance type according to the CPU performance required, dataset size, processing speed and the memory. For, beginning purpose or basic analysis one core node would be sufficient enough instead of developing a complete cluster. Hence, we have chosen t2.micro which is freely available for complete 12 months
6. Next Step would be to configure instance details. All the details are automatically filled except few details for which follow the steps: Enter number of instances -> Attach role created in step 2 -> Expand Advanced Details Pane in order to enter user data in the text format -> Enter bash script as the user data to install complete R environment along with shiny server [5](modify script with new username and new password which would be needed before logging in). 7. Next step would be to add storage according to the
requirement, for our small-scale purpose we have not changed the default configurations.
8. Next step would be to add tags in order to manage the metadata which requires attaching different Policy that must include permissions to create tags. For our purpose, we have not created tags.
9. Next step would be to configure the security group for future security purposes and multifactor
authentication. By default SSH protocol (Port Range-22) is already added. Two more would be needed for which: Enter Type(Custom TCP rule for both) -> Enter Port Range 8787 and 3838 (for RStudio server and Shiny server respectively) -> Enter Source (known IP addresses only for security purpose). Additionally, other types of security can be configured which ensures the safety of all the data and avoid its leakage [6].
10.The last Step would be to Click on Launch so that a dialog box appears which would demand to download the key pairs for further logging into our instance or connecting via SSH.
Key pairs consist of the public key and private key for encryption and decryption respectively. Public key encrypts the information and by using a Private key, the recipient decrypts the information for securing sensitive information which completely allows access to the running instance.
The private key would be downloaded in the Privacy Enhanced Mail (PEM) format which is widely used X.509 encoding format for the security certificates and this key pair should be saved permanently.
On completion of launching, a URL would be supplied which can be used to connect RStudio server via browser and this would also require the username and the password which was set in the step number 6.
3.1. Connecting RStudio server via PuTTY
In order to connect to the instance via SSH from the Windows for installing the packages other than the ones which are already installed or making few changes in the original configuration of the instance, one can use PuTTY software.
Download and Install complete PuTTY package [7].
After complete installation type PuTTYgen in the Windows start dialog box to start the service. Convert private key .PEM to .PPK (PuTTY Private
Key) using PuTTYgen utility of PuTTY by browsing the .PEM file(Putty can't support .PEM format) and save it safely
Start the utility and enter the Host name in the form ec2-user@public_dns_name (public_dns_name can be achieved by clicking on describe instances in the AWS console)
The last step would be to browse .PPK file to connect to your instance. Now any command run on the PuTTY terminal would directly modify the configurations of EC2 instance launched.
3.2. Loading and Storing Data in S3
© 2017, IRJET | Impact Factor value: 5.181 | ISO 9001:2008 Certified Journal
| Page 1003
local computer (small-scale data). Another option is to directly fetch the stream of data using different libraries of curl package in R and then analyzing it (big data).
AWS Management Console -> Services -> S3 -> Create Bucket -> Fill Details -> Create -> Upload Data.
After uploading the data, a link would be provided in order to indicate the location of the uploaded data and this link can be utilized in R for fetching the data and further analyzing it.
4. Fetching and Importing data
Once complete RStudio has been set up, now we fetch data from Twitter and import it in our R environment. This fetching and importing require few basic steps which are as follows:
If not having the Twitter account, sign up for the one [8].
Using ID and password sign in at Twitter developers.
Create a Twitter application and generate access tokens for the same which will authorize the user to fetch data from the Twitter for development purpose.
Now once the complete authorization tokens have been generated, we need to link our RStudio application with the Twitter application. Download and Install ROAuth and twitteR
packages in the RStudio and then run the small R code for complete linking.
Using searchTwitter command of dplyr package one can fetch any post containing a particular word in the post.
The data fetched can even be saved into a file and further in the S3 bucket for future use.
5. Analysis and Interpretation
In today's scenario, most of the data is unstructured which makes it very difficult for any machine to remove the ambiguity from the text and analyze its true meaning for generating powerful insights. This ambiguity may exist due to various reasons like noise, impurities, or inconsistencies in the data.
Our paper mainly focuses to analyze the sentiments of the people regarding demonetization of Rs 500 and Rs 1000 banknotes of the Mahatma Gandhi Series in India which was announced by the Government of India on 8 November 2016 [9]. The government claimed that this would definitely curtail black money but people held different views due to sudden nature of the announcement and the prolonged cash shortages in the
weeks that followed the announcement. The views are leading to ambiguity due to differences in the opinions of the people which were clearly reflected in analysis and study of their posts.
Steps involved in sentiment analysis of the same:
After complete authorization and linking of the RStudio server on the cloud with the Twitter, data is fetched using the searchTwitter command of dplyr library and data is converted into Data Frame. For our analysis, we fetched 500 most recent tweets from the Twitter. This data frame consists of 16 columns namely, text, favorited, favoriteCount, replyToSN, created, truncated, replyToSID, id, replyToUID, statusSource, screenName, retweetCount, isRetweet, retweeted, longitude, latitude.Our main focus is on sentiment analysis so we will completely deal with the text part of the data frame.
Hence now we extract the text part of the data frame in the form of tables or spreadsheets which will be easy to visualize and hence analyze for further forecasting and prediction.
Table -1: Sample tweets extracted
TWEETS
RT @Stupidosaur: @4FreedomOSpeech @CPutnam12290536 @Suzi3D @CIA @USAID @FinMinIndia @RBI Aadhaar, cashless, digital india scams to sabotage…
@India Progress It's at a reform spring tightened low. It will catapult once GST and Demonetization's short term effects wear off.
RT @Bharat_Manthan: #IndiraGandhi didn't do
#DeMonetisation. Bcoz she used black money 2 win elections.\n@99999sv #iamwithmodi \nhttps://t.co…
RT @kaushikcbasu: Cornell's Basu Says Demonetization Behind India Slowdown https://t.co/2Qd5Fv8ghS
Next, we clean the data by removing nonessential characters such as punctuation, numbers, web addresses from the text so that we can get the most important words.Table -2: Text of the tweets after cleaning
CLEANED TWEETS
rt stupidosaur freedomospeech cputnam suzid cia usaid finminindia rbi aadhaar cashless digital india scams
indiaprogress its at a reform spring tightened low it will catapult once gst and demonetizations short term
rt bharatmanthan indiragandhi didnt do demonetisation bcoz she used black moneywin elections\nsv iamwi
© 2017, IRJET | Impact Factor value: 5.181 | ISO 9001:2008 Certified Journal
| Page 1004
This data frame containing is not yet compatible with our analysis purpose as it contains multiple words per line. Therefore, we need to tokenize for one word per line.
[image:5.595.339.557.424.657.2]
Using unnest_tokens function of tidytext package we convert the complete document into tokens.Table -3: Sample of the most frequent words
WORDS FREQUENCY (N)
Demonetization 168
India 112
Rt 67
Indias 54
Gst 19
Nest we remove the most common words known as stop words. Stop words are the words which are repeated several times in the text but are of least importance when it comes to analyzing the data. For instance, words like 'the', 'of', 'a', 'an' are stop words.
Using ggplot2 package we plot the words in the decreasing order of their frequency. Using filterfunction we can even set minimum or maximum frequency so that only the words which are within the range appear for generating the clear plot of the words.
Here, we have taken minimum frequency to be 10 i.e. words which are repeated more than 9 times, in order to clearly visualize frequently occurring words.
Chart -1: Visualization of the top most frequent words
Next, for visualization purposes, we can even plot the wordcloud of all the words using the wordcloud package.
For this first, we find out all the unique words so that words are not repeated in the world cloud.Next, we develop a Corpus [10]of all the unique words using the tm package and set the frequency limit so that not all the words being tweeted only once or twice are present.
Next, we convert this Corpus into term-document-matrix using tdm function. This matrix associates weights with each of the terms depending upon a factor known as tf-idf [11].The factor tf-idf stands for term frequency-inverse document frequency which is an intended measure to supply weight to each term. tf simply indicates the term frequency and idf indicates the specificity of any term. Weight is directly proportional to the factor tf whereas inversely proportional to the factor idf. Hence, tf-idf is the product of two statistics tf and idf which clearly indicates the importance of any of the terms occurring in the document. There are various ways of determining these two statistics other than tf-idf. For our purpose we used tf-idf.
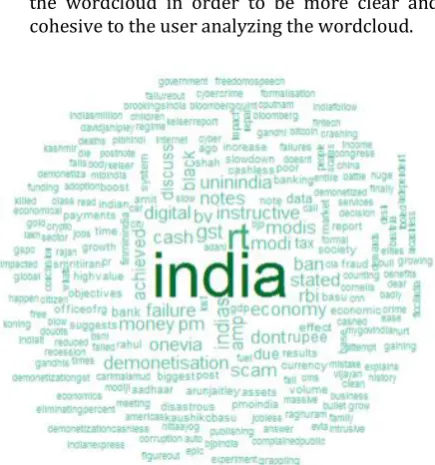
Finally using the wordcloud package we form the cloud of most relevant words and usingRColorBrewer package we set colors in the word cloud such that the intensity of the color decreases with the frequency of the words. We can even set the frequency range so that only the words of that particular range are displayed in the wordcloud in order to be more clear and cohesive to the user analyzing the wordcloud.
Fig -2: Demonetization Wordcloud
Now we perform our major analysis so that we can dig deeper into angry comments and joyous comments depending upon the context of the words.
The tidytext package includes three sentiment lexicons
[image:5.595.48.295.491.665.2]© 2017, IRJET | Impact Factor value: 5.181 | ISO 9001:2008 Certified Journal
| Page 1005
polarity either positive or negative. Therefore, the inner join of all the unique words in the corpus and the English words is taken in order to analyze the overall polarity of the tweets either positive or negative.
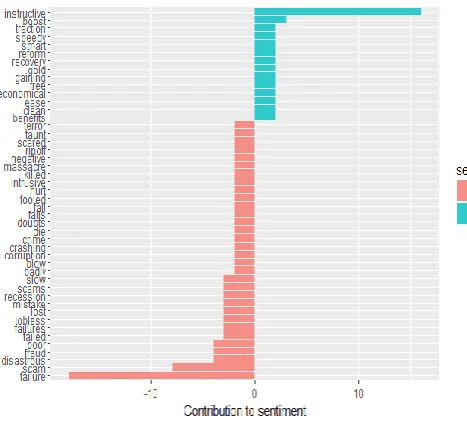
Chart -2: Polarity of the top frequent words in the tweets
Hence, the chart above clearly indicates the negative feeling of the majority of the people of the country regarding the sudden implementation of Demonetization.
Along with this, words can even be categorized as the words expressing anger, anticipation, disgust, fear, joy, sadness, surprise, and trust. Such a classification can reflect different sentiments associated with similar words depending upon the context in which they have been used. For this purpose, we have used "bing" sentiment lexicon.
Chart -3: Different sentiments associated with similar words depending upon their context
This chart clearly indicates categorization of the few frequently used words.
We even plotted the time series plot [12] indicating the way in which the sentiments of the people varied according to the time period after the announcement.
Chart -4: Time Series plot of the sentiments
[image:6.595.40.274.158.369.2]The chart above clearly shows the disruption of the majority of the people regarding Demonetization continuously. At any time period following any such decision, such an analysis must be performed in order to ensure the satisfaction of the majority of the community and taking proper measures or alternatives if required.
Table -4: Few advantages and challenges associated with the idea being implemented for sentiment analysis
ADVANTAGES CHALLENGES
Unlimited resource
availability on the cloud for large growing data
Storing data on the cloud is prone to attack
Cost effective as the user needs to pay only for the running services. Also, services can easily be expanded on user demand
Proper access control each and every time when the user starts a new service on the running cluster may often become tedious
Building R Server and all of its' other components for visualization or storage is an easy task
R language contains a lot of packages, so for accurate analysis, user should have deep knowledge of R
R is one of the most powerful languages for analysis of
unstructured data and
generating powerful insights
Such an online analysis ignores majority of the society
which is not socially
connected via internet Data and all its output is
securely held with proper multifactor authentication and security certifications
Such an analysis poses a great challenge as many predictions in the past have been wrong
and that demands for
© 2017, IRJET | Impact Factor value: 5.181 | ISO 9001:2008 Certified Journal
| Page 1006
6. CONCLUSION
Paper cohesively and coherently focuses to analyze the sentiments of people via the tweets which have been posted by them using R language on RStudio. This emerges out to be a powerful tool which can be used by any organization which will ensure their customers' satisfaction. Also, this can definitely rule out possibilities of a sudden blind decision and instead generate possibilities for more powerful forecasts and predictions which can be of utmost benefit to the society. For instance, it is a pragmatic view clearly generated after visualization of different plots on Demonetization that the idea lead and implemented by the government was for the social welfare of the society via eradicating black money and corruption from the society. However, this idea could not achieve its actual goal as can be perceived after analyzing the sentiments of the people. Moreover, we have performed our analysis on the RStudio server built on the cloud which makes the data to dilate at an exceptionally large rate.This is perfect for any data like tweets which grow in millions on a daily basis as cloud supports infinite space and other resources on a pay-go-basis which is highly cost-effective for the organization running any such tool for analysis purpose.
However, even now such analysis poses a great challenge as it does not consider the sentiments of the majority section of the society which is not connected to the internet or is socially inactive. For this offline survey must also be considered which will result in more proper and accurate analysis.
Moreover, such analysis requires great background knowledge in statistical methods and still requires large-scale research for well-defined and proven methods. Implementing the methods using R again poses a challenge and hence, the user requires a complete and deep knowledge of the language.
If these challenges are addressed suitably in the near future, then this would be the most powerful well-defined tool for powerful analysis and predictions of the upcoming events.
ACKNOWLEDGEMENT
I would like to express my profound gratitude and deep regard to Mr. Ashish Raj, Cloud Consultant at Netexperts India, for his valuable guidance and support, important feedbacks and suggestions on Cloud Computing throughout the duration of the research paper. Working under him provided me with a golden opportunity for gaining knowledge as well as immense experience on the subject. I would also like to thank Dr. Bishnu Kumar, Assistant Professor at BIT Mesra, Ranchi for his valuable suggestions on the methods to analyze the data using
statistical models and constant encouragement which helped me throughout my work.
REFERENCES
[1] Rabi Prasad Pathy, Manas Ranjan Patra, Suresh Chandra Satapathy,"Cloud Computing: Security Issues and Research Challenges".
[2] Cloud Computing articles http://www.interoute.com/
[3] AWS service articles. https://aws.amazon.com/ [4] Create an account on Amazon Web Services at:
http://aws.amazon.com/
[5] Blog on Running R on AWS at: https://aws.amazon.com/blogs/big-data/running-r-on-aws/
[6] Ronald L. Krutz, Russell Dean Vines “Cloud Security A Comprehensive Guide to Secure Cloud Computing”, Wiley Publishing, Inc., 2010
[7] Download and install complete putty package at: https://www.chiark.greenend.org.uk/~sgtatham/put ty/latest.html
[8] Create an account on Twitter for developing purpose: http://twitter.com/
[9] Article on Demonetization in India by the government:
https://www.bankbazaar.com/savings-account/demonetisation.html
[10] Article on Twitter Sentiment Analysis training dataset: http://thinknook.com/twitter-sentiment-analysis-training-corpus-dataset-2012-09-22/
[11] Blog on term frequency and inverse document frequency: http://www.tfidf.com/
[12] Article on Time series analysis: https://en.wikipedia.org/wiki/Time_series