Munich Personal RePEc Archive
Analyzing Quantitative Models
Armstrong, J. Scott and Shapiro, Alan C.
University of Pennsylvania, University of Pennsylvania
1974
Online at
https://mpra.ub.uni-muenchen.de/81696/
University of Pennsylvania
ScholarlyCommons
Marketing Papers Wharton School
April 1974
Analyzing Quantitative Models
J. Scott Armstrong
University of Pennsylvania, [email protected]
Alan C. Shapiro University of Pennsylvania
Follow this and additional works at:http://repository.upenn.edu/marketing_papers
Postprint version. Published inJournal of Marketing, Volume 38, Issue 2, April 1974, pages 61-66. Publisher URL: http://www.ama.org/pubs/jm/
This paper is posted at ScholarlyCommons.http://repository.upenn.edu/marketing_papers/96
For more information, please [email protected].
Recommended Citation
Analyzing Quantitative Models
Abstract
This article presents a framework for the evaluation of quantitative models. The framework is both simple and realistic and could be used profitably by most organizations. It incorporates not only internal accounting data but also the human elements of bias or antipathy toward the models on the part of company employees using them, which might tend to distort an internal assessment and even the capability of the model itself.
Comments
Postprint version. Published inJournal of Marketing, Volume 38, Issue 2, April 1974, pages 61-66. Publisher URL: http://www.ama.org/pubs/jm/
Analyzing Quantitative Models
J. Scott Armstrong and Alan C. Shapiro
Reprinted with permission from Journal of Marketing, Vol. 38, No. 2, (1974), 61-66
How can a potential user distinguish between a quantitative model that may be of some real value and one that is not? The model builder rarely provides much help, since most are advocates of their own work and tend to lose their objectivity toward the model. Therefore, an independent evaluation is necessary to judge the true usefulness of the model.
This article presents a framework for the evaluation of quantitative models. The framework is both simple and realistic and could be used profitably by most organizations. It incorporates not only internal accounting data but also the human elements of bias or antipathy toward the models on the part of company employees using them, which might tend to distort an internal assessment and even the capability of the model itself.
The framework will be discussed in terms of its component concepts and their interrelationships. In the course of this discussion, illustration will be made of how this
framework was used in an actual situation to evaluate a particular set of models, which will be referred to here as the FAITH models. The proponents of these models, which are currently being used by some of the largest corporations in the United States, claim they are useful for predicting the outcomes of various marketing strategies. For example, they may be used to predict market share when changes are made in prices, in product line, or in advertising. The authors do not wish to imply that the example they have selected is typical of all quantitative models. In fact, it was selected as an illustration because it contains a number of serious defects. The FAITH models use concepts from the physical sciences to deduce "fundamental laws of consumer behavior." Consumer behavior in a wide variety of situations can supposedly be predicted by first examining the pattern of brand switching among products to determine which products compete with one another. Given this description of the market, predictions may then be made by examining the relationship between the variable of interest (e.g., market share) and one or more key market variables (e.g., planned advertising expenditures by the firm). The models are very simple in terms of the data requirements; however, the nature of the relationships among the key variables tends to be very complex.
The authors conducted an evaluation of the FAITH models for a large
provide a systematic, comprehensive, and explicit evaluation. The conclusion yielded by the use of this framework contrasted sharply with that yielded by the previous evaluation.
A Framework for Evaluation
The usefulness of a quantitative model depends on both "acceptability" and "quality." Acceptability refers to approval by those in the organization who would actually use the model, while quality refers to the ability to provide better predictions or decisions. A model must score well on both characteristics if it is to be judged useful. A high-quality model that is not accepted is of no value. Usually, some trade-offs must be made between quality and acceptability.
For all practical purposes, quality and acceptability must be viewed in relative terms. That is, these concepts can only be examined by a comparison of alternative models. A model is said to be "good" if it is better than alternative models. Among the alternative models would certainly be included the way in which these predictions or decisions are currently being made. In most cases, the current method is based entirely upon the judgment of a manager. Woolsey, for example, examined four applications of complex computer models and claimed that they were inferior to the decisions currently being made subjectively. In one case, for example, two "little old ladies" did far better than a complex and expensive computer model.1
Quality and acceptability are characteristics that may depend not only upon the model but also upon the situation. The fact that the model worked for one company does not necessarily mean that it will also work for National Beverage. This is yet another reason why the potential user should carry out his own examination of the model.
Finally, it is important that the evaluation of both quality and acceptability be carried out by an unbiased evaluator. The potential user is generally unbiased prior to the purchase of a given. Once someone in the organization has become committed to the model (as happened in National Beverage's use of FAITH), internal objectivity is difficult. It is also important, in this case, to avoid the use of an outside evaluator who has a competitive model to promote. These concepts of acceptability and quality are examined in greater detail below.
Evaluating Acceptability
One must consider both whether the model will be used and, if used, how it will be used. High quality solutions are often misused and may create other problems (e.g., make the
organization more resistant to the introduction of further changes). On the other hand, low-quality solutions are often high in acceptability.
1 R. E. D. Woolsey, "A Candle to Saint Jude, or Four Real World Applications of Integer
In the framework presented here, the authors propose that the evaluation of acceptability be carried out by judging the model through the eyes of the user. In particular, the following should be examined:
1. Perceived quality – that is, the user's perception of the value of the model to the organization
2. Perceived personal value – that is, the user's perception of the benefits (or costs) of the model to his own career.
Interviews or questionnaires offer the most direct way to assess user perceptions. In some cases, however, there may also be indirect or "unobtrusive" measures. In evaluating the
acceptability of the FAITH models, a series of group and individual interviews was conducted. Members of the user group were sampled in an attempt to include all levels within the marketing division, as well as related staff groups. Two interviewers sat in on each interview and each took notes separately so that the reliability of this information could be maximized. During the
interviews, interviewers were careful to avoid evaluating what was said, since this might have biased the replies. The highlights of this effort are summarized below.
Perceived Quality of the FAITH Models
A substantial number of users did not have confidence in the assumptions of the FAITH models. Numerous comments were made along the lines of, "They make a lot of assumptions open to question." It is interesting to note that the advocates of FAITH ask people to "suspend belief" when they first explain the assumptions.
The company was unable to locate a single user who claimed to have an adequate understanding of how FAITH worked! Typical comments were: "No one can explain FAITH to me." "There's an inability to communicate." "I don't know how FAITH works."
Perceptions as to how well the FAITH models predicted were mixed. The top two levels in National Beverage felt that FAITH provided better predictions than those being made by the product managers. The middle and lower levels felt just the opposite—partially, it would seem, because they had confidence in their own judgment. Comments by these latter managers included: "FAITH can't be wrong; if their estimates are off they [FAITH advocates] claim it's because the input data were not right."
Perceived Personal Value to Users of FAITH
The low level of acceptability of FAITH also showed up in other ways. For example, when the middle and lower levels of management of National Beverage met for an all-day planning session, not a single reference was made to FAITH; yet FAITH was then regarded by top management as the foremost quantitative planning model in the company.
Because marketing managers had been told by top management to use the FAITH models, another problem arose. Middle and lower level managers said that it was common to change the inputs to the FAITH model until they found a result that agreed with their own decision. This version was then presented to top management. In other words, these managers were misusing the models.
Evaluating Quality
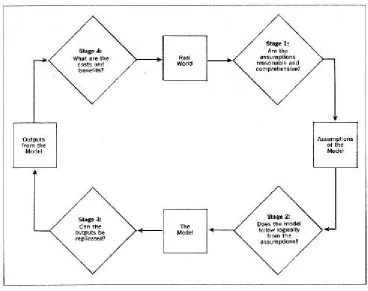
The evaluation of quality calls for an examination of four key stages as illustrated in Figure 1. The first stage relates the "real world" to the assumptions of the model: Are the
[image:7.612.122.490.415.706.2]assumptions reasonable and comprehensive? The second stage relates the model's assumptions to the final form of the model. Does the model follow logically from the assumptions? Is it possible for a mathematician to derive the same model given the initial assumptions? The third stage relates the model and its outputs: Given the same input data, can the outputs be replicated? And the fourth stage relates the outputs to the real world: Do the benefits of the model (e.g., better predictions, better assessments of risk, or better decision making) justify the costs of the model? Each of these stages is examined in detail below, again with an illustration of how they were used in evaluating the FAITH models.
Stage 1: Relationship of the Real World to the Assumptions
The first step in the assessment of the assumptions is to review written documents in order to develop an explicit listing of the key assumptions. This list may be checked by conducting interviews with the advocates of the model. The assumptions are then tested for reasonableness against: (1) empirical evidence, (2) judgments of managers, and (3) assessments by the evaluator. Admittedly, this procedure is rather crude; however, the objective at this stage is merely to identify “highly unreasonable" assumptions.
In the case of the FAITH models, the advocates —a corporate staff group from-National Beverage and members of the FAITH Corporation— were unable to provide any empirical evidence relating to the reasonableness of the assumptions. (These assumptions were based on their mathematical theory of consumer behavior known as "FAITH Dynamics.") Their appeal was strictly one of face validity—that is, the assumptions seem reasonable. There was evidence, however, that the assumptions were unreasonable. For example, one assumption stated that when the market was stable, the switching between any two specific brands was equal in both
directions; that is, the number of customers switching from Brand A to Brand B is the same as the number switching from Brand B to Brand A in a given period of time. Published empirical evidence suggested that this was not a reasonable assumption.2 According to National Beverage's product managers,’ the "independence assumption" was also unreasonable. This stated that the brand of beverage purchased by a consumer was unrelated to the brand previously purchased by that consumer. Finally, the implied assumption of low measurement error was unreasonable. This assumption arises since each FAITH model requires data from only a single point in time rather than using a series of observations over time. However, measures of market share, of prices, or of advertising are widely recognized as being subject to large components of error. Thus, the FAITH predictions would be highly sensitive to the specific time period used.
To test the assumption of low measurement error, FAITH predictions were examined for one: of National Beverage's products, referred to here as Brand C. Predictions for each of fifteen time periods were compared with actual data when different starting points were selected. Thus, when period 1 was used to obtain estimates for the FAITH model, the mean absolute percentage error (MAPE)3 for periods 2 through 16 was 4.9%. When period 3 was used for estimation, the MAPE for the remaining fifteen periods (that is, periods 1, 2, and 4 through 16) was 2.7%. In all, six different starting points were examined, and it was found that the MAPE varied from 2.7% in
2 See, for example, Donald G. Morrison, "Testing Brand: Switching Models,"
Journal of Marketing Research, Vol. 3 (November 1966), pp. 401-409.
3 Mean Absolute Percentage Error is calculated from:
the best case to 12.7% in the worst case. Since the time period being predicted was held relatively constant, the results were not consistent with an assumption of low measurement error.
Overall, then, the assumptions behind the FAITH models raised serious questions.
Stage 2: Relationship of the Assumptions to the Model
Stage 2 involves an examination of the logical structure of the model. This calls for a systematic check of the mathematics used to go from the basic assumptions to the final form of the model. This stage sometimes requires a good mathematician, especially where the model is complex.
Stage 2 should expose any implicit assumptions underlying the model. Sophisticated techniques such as mathematical programming and: simulation often tend to obscure the assumptions which underlie their use. Indeed, the mystique which surrounds the complex solution may serve to give it credibility beyond that which it rightly deserves.
The analysis of the logical structure of FAITH models turned out to be very time consuming, due both to some unnecessary complexities and to the poor documentation of the model. The conclusion reached here was the same as that reached independently by other researchers who had examined the FAITH models. There did not appear to be any mathematical inconsistencies in the models.
Stage 3: Relationship of the Model: to the Outputs
Stage 3 is merely a routine auditing step. Given the model and the data, is it possible to replicate the output? One takes a sample of the data used and enters it into the model that the advocates claim to have used. The procedure is analogous to the financial audit.
The advocates of FAITH provided copies of the model and the actual data that were used in predicting market share for fifteen periods for Brand C. It turned out that it was not possible to obtain the same predictions that FAITH advocates claimed to have gotten. In twelve of the fifteen periods, the predictions reportedly obtained by the FAITH advocates were more accurate than those actually generated using their data and their model. Overall, the average error
obtained in this replication was twice that which the FAITH advocates had claimed in this situation, and the difference was statistically significant (at the .01 level). National Beverage was unable to find any explanation for this discrepancy.
Stage 4 Relations hip between the Real World and the Outputs
Stage 4 is concerned with the value of the model's outputs as compared with the outputs of other models. This stage of analysis is generally the most important one for assessing the quality of a model.
Costs
Initial development (dollars and time) Maintenance (dollars and time)
User (ease in understanding, time to get results, need for expert assistance) Benefits
Predictive accuracy
Ability to assess uncertainty Identification of improved policies
Learning (the model improves as experience is gained) Ability to assess effects of alternative policies
Adaptability (can adapt as the environment changes)
These areas should help to provide for a more complete assessment of costs and benefits.
The assessment of costs is usually straightforward, other than the fact that costs are typically underestimated. The assessment of benefits is much more complex. Evaluators of the model should attempt to gain information on each area of benefits. In the final analysis, however, much will depend on the evaluators' subjective assessments. Furthermore, it is necessary for the evaluators to place some relative weights upon the various types of benefits.
There are many ways in which to obtain information on each of the costs and benefits. The method used in the FAITH evaluation is again presented for illustration.
The costs of the FAITH model were about $100,000 per year. This included roughly $60,000 of payments to the FAITH Corporation plus some time and expenditure by National Beverage personnel. These costs were relatively constant from year to year inasmuch as there was a continuing need for expert assistance from the FAITH Corporation.
On the benefit side, it was noted that there was no provision for the assessment of uncertainty; that is, the FAITH models provided only a single number as the forecast rather than a range of numbers. In other areas, the FAITH advocates claimed that their models were useful in obtaining more accurate forecasts, in identifying improved policies, in learning, in the ability to assess alternative policies, and in adaptability. Unfortunately, no empirical tests had been made of these claims. Since National Beverage was especially interested in improving the company's ability to predict, most attention was directed to this area.
The predictive ability of the FAITH models was tested three ways. First, their performance was examined in extreme situations to determine whether the outputs seemed reasonable; second, the FAITH models were compared with alternative reasonable models; and third, they were compared with the current subjective processes used in this firm.
a measure of the amount of brand switching taking place. If this approach were accepted as correct, then the following implications should also be true:
1. Monopolies should not advertise.
2. The level of the firm's advertising should increase in direct proportion to the number of units sold in the industry. Thus, if the industry sold twice as much of this type of beverage, National Beverage should spend twice as much on advertising.
These implications from the FAITH model did not appear to be very reasonable. It was concluded, then, that FAITH was not relevant for large changes in the market.
The next step was to determine whether alternative reasonable models might be superior. In particular, an attempt was made to develop a simpler and cheaper model for obtaining
equivalent predictions. One relatively easy way to do this is to take the predictions from a given model and fit them against the input data by using regression analysis. In other words, a model of the model is developed. Note that no actual data are needed in this step. This regression of FAITH predictions against the specified levels for advertising produced a "SON-OF-FAITH" model. The simplicity of this model is illustrated below for advertising:
S = 20.7 + 0.6A
[image:11.612.65.546.445.601.2]where S= market share (percent) as predicted by the FAITH model A= dollars of advertising (divided by 1,000,000)
Table 1
Evaluation Of Faith Models In The National Beverage Company
Ratings of FAITH As Compared With:
Management Judgment Simple Linear Model Acceptability
User perception of quality User perception of personal value Quality
Stage 1: Reasonable assumptions Stage 2: Logical structure
Stage 3: Audit of outputs
Stage 4: Cost-benefit analysis of outputs
Poor Poor Poor Good Unknown Unknown Unknown Unknown About same About same Poor Poor
Predictions from this simple linear model were extremely close to those from the FATTH model. This model explained 98% of the variance in the FAITH predictions. When the FAITH and SON-OF-FAITH predictions were graphed, the differences were so small that the two lines were almost superimposed on one another.
model similar to that shown above for advertising was developed to predict market share based on information about Brand C prices. This was obtained from a simple regression model using the first four periods of actual data on Brand C. Predictions were then made for periods 5 through 16, and these were compared with the actual market shares. The mean absolute percentage error (MAPE) of these predictions was 2.7%. For comparison, the FAITH model was calibrated using period 4, and the MAPE for periods 5 through 16 was found to be 3.0%. The superiority of the regression model was not statistically significant, but the model did provide predictions that were as accurate as those provided by the more expensive and more complex FAITH model. (This conclusion held up when different starting points were used for the Brand C data.)
Finally, there was no documentation in National Beverage for a single case where the FAITH models had led to better predictions than those obtained from product managers. No attempt had been made to obtain such a comparison in the six years of testing carried out by the company. Furthermore, the advocates of FAITH seemed to regard such a test as irrelevant.
Conclusions
Once the four stages of the analysis are completed, it is necessary to consider their net effect. At this point it is suggested that an explicit summary be prepared. This summary would compare the proposed model with its various competitors.
Such a summary is illustrated again by reference to the FAITH models. Table 1 shows the key dimensions outlined in the discussion of the framework for evaluation. A simple scale ranging from "poor" to "about the same" to "good" was used to compare the FAITH models with their major competitors—management judgment and the simple linear model. For example, the FAITH models were rated as poor on stage 1 in comparison with management judgment. Overall, the summary indicates that the FAITH models are clearly inferior to the simple linear model and are apparently inferior to management judgment.
It is rare for any one model to completely dominate another model on all the criteria. In the more typical case, where different models are judged to be superior on different criteria, the manager must decide on the relative importance of the various stages of analysis. The authors would suggest that the most important of the criteria is the cost-benefit analysis of the outputs. Beyond this, however, they have no simple solutions.
Summary
The potential user of a model should not depend entirely upon the model's advocates for an assessment of the model. Rather, he should carry out his own analysis. This article has presented a framework to guide such an analysis. This framework, which is summarized in Table 1, helps to provide a systematic, comprehensive, and explicit evaluation of a model. The