© 2018, IRJET | Impact Factor value: 6.171 | ISO 9001:2008 Certified Journal | Page 3815
Human Emotions Identification and Recognition Using EEG Signal
Processing
Ashna Y
1, Vysak Valsan
21
Fourth semester, M.Tech, Dept. of ECE, JCET, Palakkad, Affliated to Kerala Technological University, Kerala, India
2 Asst Professor, Dept. of ECE, JCET, Palakkad, Affliated to Kerala Technological University, Kerala , India
---***---Abstract - The aim is to recognize emotion from human
brain activity, measured by EEG signals. Recently, emotion classification from EEG data has attracted much attention with the rapid development of machine learning algorithms, and various real-world applications of brain–computer interface for normal people. Until now, researchers had little understanding of the details of relationship between different emotional states and various EEG features. With the help of EEG-based emotion recognition, the computer can have a look inside user’s head to observe user's mental state. We systematically perform feature extraction, feature selection, feature smoothing and pattern classification methods in the process. The best features extracted are specified in detail and their effectiveness is proven by classification results. To improve the accuracy of EEG-based emotion classification and visualize the changes of emotional states, this project systematically uses existing EEG features for emotion classification, introduces an efficient feature classification method for better results to recognize various emotional states. Automatic emotion recognition enables computer to recognize a user’s emotional state which pave the way for computers to act emotionally in the future.
Key Words: Human Computer Interface, Affective
Computing, EEG, Brain waves, Artificial Neural Networks, Emotion Recognition, Brain Computer Interactions, Neuro-Computing
1.
INTRODUCTION
Emotions play an important role in human communication and decision making. They play a major role in motivation, perception, cognition, creativity, planning, reasoning, learning, memory, & decision making. Understanding emotions & discriminating them using captured EEG signals is a not an easy process. Components of emotion include cognitive processes, subjective feelings, physiological arousal and behavioral reactions. Although in our daily life emotions seem natural to us, we have little knowledge of the mechanisms behind emotional function of the brain for modelling human emotion. In recent years, research on emotion recognition based on EEG has attracted great interest in a vast number of interdisciplinary fields, from psychology to engineering, including affective Brain Computer Interactions (aBCIs) [1].
Emotion recognition based on EEG is very challenging due to the fuzzy boundaries and differences in individual variations of emotion. Emotion is considered as a
function of time, context, space, language, culture, and races [1]. Considering the explosion of machines, emotion interaction between humans and machines has been one of the most important issues in advanced human– machine interaction and brain–computer interface. To approach the affective human–machine interaction, we need to develop a reliable emotion recognition system, which can guarantee acceptable recognition accuracy, robustness against any artifacts, and adaptability to practical applications[4].
Brain-computer interface (BCI) has been one of the most interesting biomedical engineering research fields for decades. It provides a promising technology allowing humans to control external devices by modulating their brain waves. Not only can BCI be employed to mentally control devices, but also it can be implemented for understanding our mental states. Emotion recognition is one of such applications. Automatic emotion recognition algorithms, however connects the gap between machine and human interactions.
There are several sources of information to help in the recognition of various emotions like facial expressions, voice and physiological signals. In this study we implemented an emotion recognition system based on the collected EEG signals. We used a database of EEG signals acquired during experiments to induce emotions in the participants. We calculated various parameters energy and entropy based on theta and alpha rhythms. The classification of these parameters into emotional states was accomplished with the method of artificial neural networks.
1.1 Basic Theory: Brain Waves and Different Frequency Bands of the EEG
The analysis of oscillatory activity in the EEG has a tradition that reaches back over almost 90 years to the 20s of the last century, Hans Berger reported the existence of certain oscillatory characteristics in the EEG, now referred to as alpha and beta rhythms. The decades of research since then led to the discovery of a multitude of cognitive and affective functions that bear influence upon the oscillatory activity in different frequency ranges of the brain.
© 2018, IRJET | Impact Factor value: 6.171 | ISO 9001:2008 Certified Journal | Page 3816 have been reported in response to more arousing stimuli.
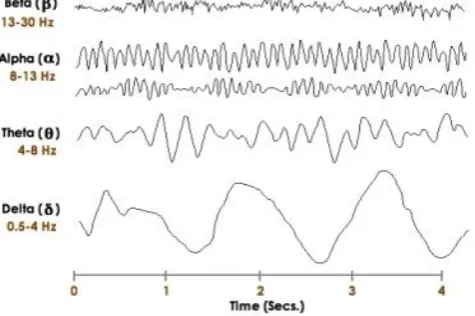
The theta rhythm comprises the frequencies between 4 to 8 Hz. Increases in theta activity upon exposure to pleasurable stimuli is detected over frontal and parietal regions. A theta increase was also reported during anxious personal compared to non-anxious object rumination. The alpha rhythm comprises the frequencies between 8 and 13 Hz. It is most prominent over parietal and occipital regions, especially during the closing of the eyelid, and decreases in response to sensory stimulation, especially during visual.
The beta rhythm comprises the frequencies between 13 and 30 Hz. Central beta activity has been associated with the sensory-motor system as it is weak during motor activity, but increases afterwards. Concerning affect, increases of beta band activity have been observed over temporal regions in response to visual and self-induced positive, compared to negative emotions. A general decrease of beta band power has been reported for stimuli that had an emotional impact on the subjective experience, compared with those that were not experienced as emotional. The gamma rhythm comprises the frequencies above 30 Hz. Gamma band oscillations are supposed to be a mechanism in integration of information represented in different sensory as well as non-sensory cortical networks.
[image:2.595.41.279.506.664.2]Taken together, the different frequency bands of the EEG have been associated with changes in the affective state with a number of cognitive functions. Consequently, it is difficult to find one-to-one mappings between any oscillatory activity of the brain and an affective or cognitive function. There is an evidence of showing the association of brain rhythms with affective responses. Affective brain-computer interfaces can make use of frequency domain as a source of information about their users’ affective states.
Fig - 1: Brain Waves and EEG Tracings
1.2 Problem Statement
The methods to estimate the emotional state was designed based on different EEG features related to emotional processes. Classification of user emotion in SVM based emotion recognition algorithm is limited to two states
only. Also, classification of accuracy is low. The number of samples which can be taken for classification is limited. The training of 2 states, normal and abnormal is only possible when we are using SVM. The proposed modification is based on emotion identification and recognition with artificial neural networks.
EEG signals were analyzed, it used feed forward neural networks to classify in six emotions based on valence and arousal, with a greater success rate. The recognisability of different emotions depends on how well the EEG features can be mapped onto chosen emotion representation which can be efficiently performed by artificial neural networks. Hence, we use artificial neural networks as pattern classifiers in this project for achieving greater classification accuracy. More number of samples can be taken when compared to the conventional case. Multiple emotion states can be tested and trained. This is a more advanced method for emotion recognition using EEG signals.
The proposed method for Identifying and Recognizing Human Emotions using EEG Signal Processing is being done on a system with an Intel Core i3 processor at 2.20 GHz, equipped with 4GB RAM, running MATLAB R2016a environment running Windows 10 and several experiments are carried out to evaluate the proposed technique.
2. SYSTEM DESCRIPTION
2.1 Block Diagram and its Overview
The block diagram presented in Figure 2 includes a normal BCI system composed by the brain signal acquisition, signal pre-processing, features extraction, selection and classification. The output of the BCI system can be one of the different kind of emotions: positive/excited, positive/calm, negative/excited, and negative/calm. The next subsections discuss about each step of our emotion recognition system based on EEG signals.
• Sensing: data acquisition using biosensors in natural or artificial situation
• Preprocessing: noise filtering, normalization, up/down sampling, segmentation
• Feature Extraction: extracting all possible attributes that represent the sensed raw biosignal.
• Feature Smoothing: The extracted features are smoothened and represented.
• Feature Selection / Space Reduction: identifying the features that contribute more in the classification.
© 2018, IRJET | Impact Factor value: 6.171 | ISO 9001:2008 Certified Journal | Page 3817 Fig -2 : Block Diagram Of Emotional State Classification
From EEG Data
2.2 Flowchart
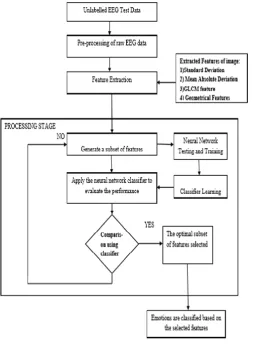
[image:3.595.55.292.85.230.2]This section presents the flowchart of the system in figure 3 developed for the recognition of human emotions based on a BCI system. We use only information from brain signals to detect the emotional state of an individual in this work. Furthermore, due to the lack of an apparatus for reading brain signals, we use one database of EEG signals.
Fig - 3: Flowchart
3. DESIGN
3.1 Emotion Identification and Recognition
Important for our case, because of the limited number of available electrodes, is the influential EEG features detected during various emotional stimuli.
Valence: positive, happy emotions result in a higher frontal coherence in alpha, and higher right parietal beta power, compared to negative emotion.
• Arousal: excitation presented a higher beta power and coherence in the parietal lobe, plus lower alpha activity.
• Dominance: strength of an emotion, which is generally expressed in the EEG as an increase in the beta / alpha activity ratio in the frontal lobe, plus an increase in beta activity at the parietal lobe.
3.2 Pre-Processing Techniques
Here, we are extracting frequency bands. Common approach in emotion detection algorithms is to decompose EEG signals to distinct frequency bands, then work on each band. The Raw EEG data is down-sampled to 200Hz sampling rate. Frequency bands can be extracted from raw EEG signals using band-pass filters between 0.5Hz to 70Hz. To pre-process data & extract frequency bands, use wiener filter. Any noise/blurred signals & artifacts can be removed.
For data pre-processing, since there is often contamination of electromyography signals from facial expressions and Electrooculogram signals from eye movements in EEG data, the raw EEG data is processed with band pass filter between 1 Hz and 75 Hz and EEG data with noise and artifacts are discarded. The 62-channel EEG signals are further down-sampled to 200Hz and EEG features are extracted with each segment of the pre processed EEG data with a 1s time window. Therefore, the features can be calculated in five frequency bands (delta: 1-3 Hz, theta: 4-7 Hz, alpha: 8-13 Hz, beta: 14-30 Hz, and gamma: 31-50 Hz), which are widely used in EEG studies using Short-term Fourier transform.
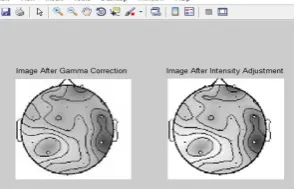
(i) Gamma Intensity Correction
[image:3.595.39.293.383.728.2]© 2018, IRJET | Impact Factor value: 6.171 | ISO 9001:2008 Certified Journal | Page 3818 brightest (white). Different camera or video recorder devices
do not correctly capture luminance. Different display devices (monitor, phone screen, TV) do not display luminance correctly neither. So, the gamma correction function is required. Gamma correction function is used to correct image's luminance. Human perception of the intensities of color or brightness, does not have a linear relationship, with respect to the values of intensity of light waves. That is, we are more sensitive to some color or brightness range. The brightness of image display devices, such as CRT monitors, does not have a linear relation of its voltage input. For calculating gamma correction the input value is raised to the power of the inverse of gamma. The formula for this is as follows:
(ii) Logarithmic Transform
There are three basic gray level transformations; Linear, Logarithmic & Power–law transformations. Logarithmic transformation further contains two type of transformation. Log transformation and inverse log transformation.
The log transformations can be defined by this formula;
s = c log(r + 1).
Where s and r are the pixel values of the output and the input image and c is a constant. The value 1 is added to each of the pixel value of the input image because if there is a pixel intensity of 0 in the image, then log (0) is equal to infinity. So 1 is added, to make the minimum value at least 1. During log transformation, the dark pixels in an image are expanded as compare to the higher pixel values. The higher pixel values are compressed in log transformation. This results in image enhancement. The shape of log curve shows that this transformation maps a narrow range of low-level grey scale intensities into a wider range of output values. Similarly maps the wide range of high-level grey scale intensities into a narrow range of high level output values. The opposite of this applies for inverse-log transform. This transform is used to expand values of dark pixels& compress values of bright pixels. The value of c in the log transform adjust the kind of enhancement.
(iii) Discrete Cosine Transform
The discrete cosine transform (DCT) helps separate the image into parts (or spectral sub-bands) of differing importance. The DCT is similar to discrete Fourier transform: it transforms a signal or image from the spatial domain to the frequency domain. A DCT expresses a finite sequence of data points in terms of a sum of cosine functions oscillating at different frequencies. The use of cosine rather than sine functions is critical for compression, since it turns out that fewer cosine functions are needed to approximate a typical signal. DCT is a Fourier-related transform but using only real numbers. The DCTs are generally related to Fourier Series
coefficients of a periodically and symmetrically extended sequence whereas DFTs are related to Fourier Series coefficients of a periodically extended sequence. DCTs are equivalent to DFTs of roughly twice the length, operating on real data with even symmetry whereas in some variants the input and/or output data are shifted by half a sample. There are eight standard DCT variants, of which four are common.
3.3 Feature Extraction
Features can be extracted from EEG signals in various ways. We have found that the following different features and electrode combinations are efficient for EEG-based emotion recognition: Mean value, Standard Deviation, Mean Absolute Deviation (MAD), Gray Level Co-occurrence Matrix (GLCM) features including Contrast, Correlation, Energy, Homogenity, Entropy, Geometric features including corners and eigen values from the EEG signals. According to the five frequency bands, we computed the traditional PSD features using Short Time Fourier Transform (STFT) with a 1-s-long window. The computation of the spectral power in the alpha band was executed by a number of methods, including EEG amplitude filtered through a band pass filter, Fourier transform, power spectral density, and wavelet transform. Most of these methods are well established and can readily be implemented in real time. Recently, advanced computational methods have been proposed to evaluate emotional arousal [8].
3.4 Performance Evaluation Parameters
In digital image processing, the performance evaluation means the analysis of parameters that improves the execution of the proposed system there by producing the optimized result. The image is defined as a Scene consists of objects of interest. The shape of the object is a binary image representing the extent of the object. In Digital Image processing, the parameters such as thresholds, bounds and weights have tuned for the successful performance of the emotion recognition system.
a) Mean Features
The mean, m of the pixel values in the defined window, estimates the value in the image in which central clustering occurs. The mean can be calculated using the formula:
Where p(i,j) is the pixel value at point (i,j) of an image of size MxN.
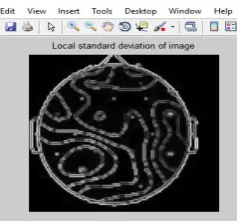
b) Standard Deviation Features
© 2018, IRJET | Impact Factor value: 6.171 | ISO 9001:2008 Certified Journal | Page 3819 c) Mean Absolute Deviation
This study aims at obtaining smoothed strain fields from digital image correlation technique (DIC), by smoothing the displacement fields prior to strain computation. Both median absolute deviation (MAD) and mean absolute deviation based smoothing algorithms are implemented for data smoothing. On implementation of these algorithms, the noise levels in the strain fields are found to be reduced to a greater extent. Mean is most basic of all statistical measure. In image processing filtering using mean is classified as spatial filtering and used for noise reduction. The MAD is also called the mean absolute deviation or mean difference.
d) GLCM Features
The image properties related to second-order statistics is estimated by the GLCM. The use of gray level co-occurrence matrices (GLCM) have become one of the most well-known and widely used texture features. The features such as contrast, correlation, variance, energy, entropy and Homogeneity are calculated.
Contrast: The local contrast of an image is denoted by this feature. The Contrast is expected to be low if the gray levels of the pixels are similar. Contrast is the difference in visual properties that makes an object distinguishable from other objects and the background. Contrast is determined by the difference in the color and brightness of the object and other objects within the same field of view.
Correlation: The gray level linear dependence between the pixels at the specified positions relative to each other is explained by this feature.
Homogeneity: The closeness of the distribution of elements in the GLCM to the GLCM diagonal and range = [0 1] is measured by homogeneity. Homogeneity is 1 for a diagonal GLCM.
e) Geometric Features
A good feature set contains discriminating information, which can distinguish one object from other objects. Geometric feature learning is a technique combining machine learning and computer vision. This method finds a set of representative features of geometric form to represent an object, by collecting geometric features from images and learning using efficient machine learning methods. Humans solve visual tasks and can give fast response to the environment by extracting perceptual information from what they see. Geometric feature learning methods can not only solve recognition problems but also predict subsequent actions by analyzing a set of sequential input sensory images, usually some extracting features of images. This technique is used in the area of artificial intelligence.
3.5 Feature Selection
Feature selection is a dimensionality reduction technique used for data mining and knowledge discovery. Feature selection implies less data transmission and efficient data mining. Feature selection can remove the irrelevant noisy features and hence improve the quality of the data set and enhance performance of learning systems. It is a technique to select the features that is relevant for classification stage. The goal of feature selection is that of reducing the number of features to be considered in classification stage. This task is performed by removing irrelevant or noisy features from whole set of available ones. It is accomplished by reducing as much as possible the information loss due to the feature set reduction. The selection process should not reduce classification performance.
The feature selection problem implies the selection, from the whole set of available features. If the considered feature set does not include all information needed to discriminate samples belonging to various classes, the achievable performance may be unsatisfactory, independent of the learning algorithm effectiveness. Finally, computational cost of classification depends on the number of features used to describe the patterns.
3.6 Classification
The extracted features are further classified using two pattern classifiers, Neural Network training and support vector machine (SVM) to build emotion recognition systems. The classifier used in proposed method is Feed Forward Artificial Neural Network over the conventional SVM. From the extracted features, we get a single data value or feature value which is fed to the classifier. The classifier will then make decisions based on the conditions. The EEG feature vector provides observations from which an emotional state can be inferred. Linear classifiers have already been applied for classifying EEG signals into different classes of emotions. Classifiers are used for decoding the feature vector into one of possible emotional states [8]. In this project, we focus on artificial neural networks for classification process.
© 2018, IRJET | Impact Factor value: 6.171 | ISO 9001:2008 Certified Journal | Page 3820 3.7 Database
We use an EEG database as the source of brain signals. This database was recorded by observing various neural patterns of brain associated with various emotions. Those were selected to indicate four different emotions in the individuals: calm/positive, calm/negative, excited/positive and excited/negative. There are some areas of the brain that are related with the human emotional behaviour: brainstem, hypothalamus, thalamus, prefrontal area and limbic system. We chose to use the EEG signals acquired from the channel FP1 in this work. The channel FP1 is located on the prefrontal area of the brain. The prefrontal area is involved in the following functions:
The choice of options and behavioural strategies most appropriate to physical and social conditions of an individual, and ability to change them.
Sustained attention and the ability to follow sequences of thoughts sorted.
Control of emotional behaviour.
We developed a code in Matlab for reading the EEG signals from the database used in this work. Beyond that, the code selects the features extracted from the EEG signals.
4. APPLICATIONS
Emotions play an extremely important role in how we arrive at a decision, planning, reasoning and other human mental states. The recognition of these emotions is becoming a vital task for e-healthcare systems. Using EEG to recognise the mental state of patients that could need a special care offers an important feedback for Ambient Assisted Living. They can be used in clinical diagnosis and cognitive neuroscience. We are targeting various applications in entertainment industry, e-learning, etc using the algorithm.
Several real-time applications were designed & implemented with proposed emotion recognition algorithms such as music therapy, adaptive advertisement, adaptive games, emotional companion, an emotion-enabled music player etc. This proposed system can be used to detect problems in electrical activity of brain that may be associated with certain brain disorders. The measurements given by EEG are used to confirm or identify various conditions, including: seizure disorders (such as epilepsy), head injury, encephalitis (inflammation of the brain), brain tumor, encephalopathy (disease that causes brain dysfunction), memory problems, sleep disorders, stroke, dementia
When someone is in a coma, an EEG may be performed to determine the level of brain activity. The test can also be used to monitor activity during brain surgery. All these disease conditions can be monitored, with the help of EEG based emotion recognition algorithm. Serious patients who are paralyzed can be kept under observation and the treatments
can be periodically checked for improvement with the EEG observation results. Various other fields of applications include:
Biomedical Engineering Neuro-Computing
Brain-Computer Interactions Psychological studies Clinical applications Affective Computing E-Healthcare systems Music-Therapy
5. RESULTS & DISCUSSIONS
[image:6.595.383.500.507.606.2]In order to extract useful information from the EEG signals, we used the following types of features: EEG frequency band power, Cross-correlation between EEG band powers, Peak frequency in various bands. The resulting features were used to train the classifier, in order to get the optimal result. For classification we have implemented artificial neural networks. However, the drawback is that the system is too much specialized in recognizing emotion from the given samples, and performs better on those samples in the database. The samples for different emotions can be separated by our MATLAB program using various pre-processing techniques, when using the same data for training and testing the neural networks. These results indicate that EEG data contains enough information to recognize emotion from the acquired signals, but there is still a lot of diversity among different people and circumstances based emotion changes.
Fig - 4: Input image of neural patterns
[image:6.595.360.508.646.741.2]© 2018, IRJET | Impact Factor value: 6.171 | ISO 9001:2008 Certified Journal | Page 3821 Fig - 6: Local standard deviation of image
Fig - 7: Local entropy of grayscale image
Fig - 8: Output displayed
The accuracies of alpha, beta and gamma bands are better than those of delta and theta bands. This result partly proves that high frequency bands have an important role in emotion activities than low frequency bands. First we classified the EEG data into delta, theta, alpha, beta and gamma bands, and done various transformations and computed the log energy of each sample. Then, a neural network based classifier was used to work on the training & testing set. Based on feature extraction, selection & computed values, most appropriate emotion was obtained as output from linear classifier. Brain regions & associated frequency bands are found most relevant to emotion & its recognition.
6. CONCLUSION AND FUTURE WORK
In this project, we systematically evaluated performance of different popular methods for feature extraction, feature selection, & pattern classification for emotion recognition using available physionet dataset & DEAP dataset. The comparative classification accuracies achieved show the superior performance of our machine learning methods using artificial neural networks. The training and testing of datasets from different sessions was done. The experimental result proves that neural signatures associated with stable EEG patterns for positive, neutral and negative emotions exist. It was found that lateral temporal areas was activated more for positive emotions than negative emotions in beta & gamma
bands & neural patterns of neutral emotions have higher alpha responses at parietal & occipital sites, also negative emotion patterns have higher delta responses at parietal & occipital sites also higher gamma responses at prefrontal sites[1]. In this project, stable neural patterns of basic emotions: positive, neutral & negative was investigated.
For future work, we can classify more categories of emotions. Moreover, various important factors such as gender, age, and race should also be considered for varying emotions. Also, to make the automatic emotion recognition models to be adaptable, factors such as individual differences and temporal evolution should be considered. Testing and training of neural network is complex for mixed emotions. This can be improved in the future work. The differences in individual variations of emotions have to be considered in the design. The time dependency of emotion occurrence in different cases has to be studied more and evaluated for better performance of the automatic emotion recognition model.
ACKNOWLEDGEMENT
I express my deep gratitude to the Almighty, the supreme guide, for bestowing His blessings upon me in my entire endeavour. I am grateful to Dr. V P Sukumaran Nair, Principal of JCET for the support to complete project work. I would like to express my sincere thanks to Prof. C. Venugopal, Professor and Head of the Department of Electronics & Communication Engineering, JCET for his support and cooperation. I express my deep sense of gratitude to project coordinator Mr. Felix M Philip for his inspiration and encouragement. I am deeply indebted to my internal guide Mr. Vysak Valsan, Assistant Professor, Department of Electronics & Communication Engineering who guided me throughout my project work. Finally, I would like to thank all the faculty members of the Department of Electronics and communication Engineering, my family and friends for their support and encouragement.
REFERENCES
[1] “Identifying Stable Patterns over Time for Emotion Recognition from EEG”, Wei-Long Zheng, Jia-Yi Zhu, and Bao-Liang Lu, IEEE 2016.
[2] “EEG-based Emotion Recognition, The Influence of Visual and Auditory Stimuli” Danny Oude Bos, Department of Computer Science, University of Twente, 2016.
[3] “Feature Extraction and Selection for Emotion Recognition from EEG”, Robert Jenke, Angelika Peer, Member, Martin Buss, IEEE Transactions On Affective Computing, Vol. 5, No. 3, July-September 2014
© 2018, IRJET | Impact Factor value: 6.171 | ISO 9001:2008 Certified Journal | Page 3822 [5] “Transfer Components between Subjects for
EEG-based Emotion Recognition” Wei-Long Zheng, Yong-Qi Zhang, Jia-Yi Zhu, Bao-Liang Lu, 2015 International Conference on Affective Computing and Intelligent Interaction (ACII)
[6] “The neural bases of emotion regulation” ,Etkin A, Büchel C, Gross JJ, 2015
[7] “Emotion recognition method using entropy analysis of EEG signals” ,Seyyed Abed Hosseini and M.B. Naghibi-Sistani, August 2011
[8] “A Review on the Computational Methods for Emotional State Estimation from the Human EEG”, Min-Ki Min-Kim, Miyoung Min-Kim, Eunmi Oh, March 2013
[9] “Towards passive brain-computer interfaces: applying brain computer interface technology to human-machine systems in general” Zander TO, Kothe C, Journal of neural engineering, 2011
[10] “Emotion Recognition Using Brain Activity”, Robert Horlings, DragosDatcu, Léon J. M. Rothkrantz, International Conference on Computer Systems and Technologies, June, 2008
[11] “Stability of Features in Real-Time EEG-based Emotion Recognition Algorithm”,ZiruiLan, CW, December 2014.
[12] “EEG alpha activity reflects attentional demands, and beta activity reflects emotional and cognitive processes”, Ray WJ, Cole HW.
[13] “Identifying Emotions on the Basis of Neural Activation”, Karim S. Kassam, Amanda R. Markey, Vladimir L. Cherkassky, George Loewenstein