© 2018, IRJET | Impact Factor value: 6.171 | ISO 9001:2008 Certified Journal | Page 3662
Analysis of Cooling Performance of Automobile Radiator Using
Nano-fluid TiO
2and water
Maheep Singh
1,
Manmohan Singh
2,Manish singla
3,Eshita Sharma
4Chitkara University, Punjab.
---***---ABSTRACT- The main objective of this paper is to analyze the heat carrying capacity of the coolant used in the radiator of an automobile by using Nano-particle titanium oxide (Tio2). The heat carrying capacity of the coolant can be increased as compared to that of conventional coolant (water) by adding Tio2 as a coolant [1]. The experiment was conducted by varying the concentrations of the Nano-particleTiO2 in water
at three different flow rates. The concentration of the TiO2
varies from 0.1% to 0.2% and the flow rate of the Nano-coolant has been kept in between 2lt/min to 4lt/min. The observations were made within a temperature range of 50oc – 30oc to analyze the effect of fluid inlet temperature on the heat transfer coefficient. The test rig consist of radiator of capacity 1000cc, ducts made up of Galvanized iron sheet of thickness 20 gauge, a pump employed for the continuous circulation of the coolant, 4 temperature sensors[2] to check temperature at different section of the radiator(inlet, outlet, wall1 i.e. front side,wall2 i.e. rear side), a hand blender used for mixing of Nano-particles with water and an immersion rod to increase the temperature of the coolant to 500c . The best results were obtained when the coolant was circulated at flow rate of 3.4lt/min at 0.15%volume concentration of TiO2 in water.
Keywords- Heat transfer coefficient, Nano-fluid, Convection, conduction, nusselt number, and Reynolds number.
1. INTRODUCTION
Under heavy loading, the engine of the automobile needs more power and hence cause the temperature of the engine to rise. For providing proper cooling to the engine, the heat dissipation is necessary and it is increased by adding nano-particles in the coolant. Radiator has fins for heat dissipation through conduction and a fan blows air towards the radiator for heat dissipation through forced convection. [3]
Water was used as conventional fluid in radiator.The heat carrying of the water is not appropriate for proper cooling of the engine. For improved efficiency of the coolant, Nano-particle (TiO2) are added in the water at different
concentrations. The nano fluid so prepared is circulated in the test rig at different flow rates and concentration of the nano particle in water. The readings were taken to find the flow rate and concentration at which max heat transfer coefficient was obtained. [4]
2. SOLUTION PROPOSED
By adding nano particles in the water at different volume concentrations and flow rates, an improved results in
Reynolds no, nusselt no, and heat transfer coefficient is obtained. Two methods are deployed for obtaining an enhanced result in the heat carrying capacity of the coolant.The first method is that the flow rate is varied to obtain maximum heat transfer rate of the coolant. The second method employs change in concentration of the nano particle in water to check for the ideal concentration for maximum efficiency of heat transfer rate. If both the methods are used simultaneously then the results for the heat transfer rate are more efficient than that obtained with water alone. [5]
1.
3. EXPERIMENTAL SETUP
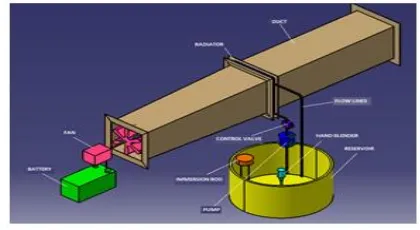
[image:1.595.327.537.476.591.2]The test rig constructional features are explained with the help of a CAD model as shown in figure 1. It focuses on observing the changes in heat transfer rate after addition of the nano-particle and obtaining the most efficient heat transfer rate of the nano-fluid. The test rig consist of a radiator, GI sheet duct[6], PT-100 temperature sensors, immersion rod for heating, a bucket as a reservoir for the nano-coolant and a hand blender for mixing of water and nano-particle.
FIGURE 1: Experimental Setup of the Proposed Solution
2. Flow Chart of proposed solution:
© 2018, IRJET | Impact Factor value: 6.171 | ISO 9001:2008 Certified Journal | Page 3663
FIGURE 2: Experimental Setup of the Proposed Solution. 1. The Nano-coolant is prepared by mixing TiO2 particles in
three different volume concentrations (0.1%, 0.15%, and 0.2%)in water (10 Litres).
2. The Nano-fluid thus prepared is stored in container (bucket). An immersion rod is used to increase the temperature of the coolant to 50°c and a hand blender is employed to mix the particles of Tio2 with water.
3. The flow rate of the coolant is varied by using a control valve from 2.7l/min to 4l/min.
4. The Nano-fluid is then pumped to the radiator inlet by using hoses (flow lines).
5. The air is then forced by using a fan which is operated by 220 volt D.C. battery.
6. The coolant is allowed to flow through the 1000cc radiator which is enclosed in duct of G.I sheet of thickness20 gauge.
7. The coolant when flows through the tubes of the radiator cools down (temperature drop) due to forced convection and conduction process.
8. The temperature drop is recorded and graphs are plotted to analyze maximum heat transfer rate.
4. EXPERIMENTAL CALCULATIONS
Nusselt no, Reynolds no and heat transfer coefficient are the three parameters that are used for observing the heat transfer rate of the coolant.The following terms are calculated with the help of specific heat capacity[7] and density[8]. The formulas of the same are given.
The specific heat capacity of the nano- coolant is calculated as:
(1)
= specific heat capacity of the nano coolant(J/Kgk) specific heat capacity of water(4180 ) specific heat capacity of TiO2(683 )
𝛗= Nano Fluid volume concentration % (at three different
values 0.1%,0.15% and 0.2%) nano fluid(kg/m3)
Density of the nano-fluid ( is calculated by using the given formula:-
(2)
Where water(1000kg/m3)
𝜌p= density of TiO2(3970 kg/m3)
Heat transfer rate is calculated by given equation:
Q= [9]
(3)
Where, m = mass flow rate of the nano-coolant(Kg/min)
Tin= Inlet temperature (oc)
Tout= outlet temperature(oc)
Heat transfer coefficient is calculated by using the given equation
From Newton’s law of cooling:
(4)
Where Q is the heat transfer rate(watt)
)
A is the surface area of the tube of radiator (217cm2)
Tb is the bulk temperature (oc) which is calculated by taking
the average of Tin and Tout
(5)
is the average wall temperature of the radiator measured from various transverse and longitudinal locations of radiator(oc)
(6)
Where n = number of tubes (50)
The average Nusselt number can be calculated as:
(7)
Where Dh= hydraulic diameter[10] of the tube and is
calculated as
(8)
© 2018, IRJET | Impact Factor value: 6.171 | ISO 9001:2008 Certified Journal | Page 3664 Here d=1.8 mm; D=15.5mm.
Finally the Reynolds number can be calculated as: Re =
(9)
Where density of nano-fluid(kg/m3)
μ = dynamic viscosity of the nano coolant( v= Fluid velocity(m/s)
5. Observations:-
5.1: Nano Fluid (TiO2+H2O)
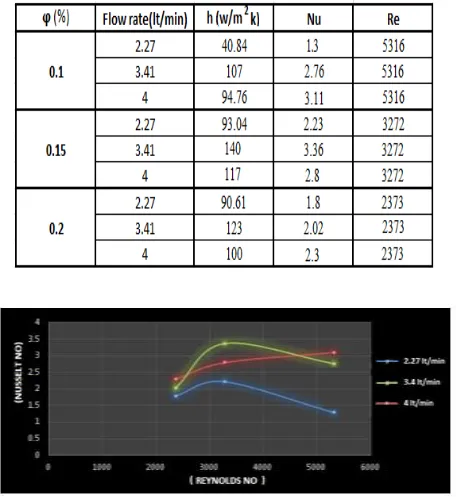
Table 1 shows the observations for TiO2 based nano-fluid.
[image:3.595.311.556.162.423.2]Heat transfer coefficient (h), Reynolds number (Rn) and Nusseltnumber (Nu) are analyzed and shown in table 1. The same is plotted in figure 3. The readings were taken at three different flow rates(2.27lt/min, 3.4lt/min, 4lt/min) and concentrations (0.1%,0.15%,0.2%). The best result was obtained at a flow rate of 4lt/min and 0.15% volume concentration.
Table 1: Analysis of TiO2based radiator coolant at different flow rates
Figure3: Representing the variations in Reynolds number vs Nusselt number at different flow and concentrations for
TiO2
At four different junctions i.e. inlet, outlet, wall1, wall2 the temperature variation is observed with change in time at different flow rates and concentrations.
The table 2 and figure 4 represents the reading of temperature and time forTiO2at 2.7 l/min flow rate and
0.10% volume concentration at regular time intervals.
[image:3.595.49.277.427.676.2]Table 2: Temperature and Time forTiO2at 2.7 l/m and 0.10 % Volume Concentration
Figure 4: Temperature vs Time for TiO2at 2.7 l/m and
0.10 % Volume Concentration
The table 3 and figure 5 represents the reading of temperature and time for TiO2 at 3.4 l/min flow rate and
0.10% volume concentration at regular time intervals.
© 2018, IRJET | Impact Factor value: 6.171 | ISO 9001:2008 Certified Journal | Page 3665
Figure 5: Temperature vs Time for TiO2 at 3.4 l/m and
0.10 % Volume Concentration
The table 4 and figure 6 represents the reading of temperature and time for TiO2 at 4 l/min flow rate and
[image:4.595.47.276.79.177.2]0.10% volume concentration at regular time intervals.
Table 4: Temperature and Time for Al2O3 at 4 l/m and 0.10 % Volume Concentration
Figure 6: Temperature vs Time for TiO2 at 4 l/m and 0.10
% Volume Concentration
The table 5 and figure 7 represents the reading of temperature and time for TiO2 at 2.7 l/min flow rate and
0.15% volume concentration at regular time intervals.
Table 5: Temperature and Time for TiO2 at 2.7 l/m and 0.15 % Volume Concentration
Figure 7: Temperature vs Time for TiO2 at 2.7 l/m and 0.15
% Volume Concentration
The Table 6 and figure 8 represents the reading of temperature and time for TiO2 at 3.4 l/min flow rate and
[image:4.595.44.280.299.521.2]0.15% volume concentration at regular time intervals.
Table 6: Temperature and Time for TiO2 at 3.4 l/m and 0.15% Volume Concentration
Figure 8: Temperature vs Timefor TiO2 at 3.4 l/m and 0.15
% Volume Concentration
The table 7 andfigure 9 represents the reading of temperature and time for TiO2 at 4 l/min flow rate and
0.15% volume concentration at regular time intervals. .
[image:4.595.309.560.307.512.2]© 2018, IRJET | Impact Factor value: 6.171 | ISO 9001:2008 Certified Journal | Page 3666
Figure 9: Temperature vs Time for TiO2 at 4 l/m and 0.15
% Volume Concentration
The table 8 and figure 10 represents the reading of temperature and time for TiO2 at 2.7 l/min flow rate and
[image:5.595.37.285.82.180.2]0.20% volume concentration at regular time intervals..
Table 8: Temperature and Time for TiO2 at 2.7 l/m and 0.20 % Volume Concentration
Figure 10: Temperature vs Time for TiO2 at 2.7 l/m and
0.20 % Volume Concentration
Table 9 and figure 11 represents the reading of temperature and time for TiO2 at 3.4 l/min flow rate and 0.20% volume
concentration at regular time intervals.
Table 9: Temperature and Time for TiO2 AT 3.4 l/m and 0.20 % Volume Concentration
Figure 11: Temperature vs Time for TiO2 at 3.4 l/m and
0.20 % Volume Concentration
The table 10 and figure 12 represents the reading of temperature and time for TiO2 at 4 l/min flow rate and
[image:5.595.39.293.303.511.2]0.20% volume concentration at regular time intervals.
Table 10:Temperature and Time for TiO2 at 4 l/m and 0.20 % Volume Concentration
Figure 12: Temperature vs Timefor TiO2at 4 l/m and 0.20
% Volume Concentration
By comparing the readings and observations from table two to table ten, it is found that the heat transfer rate is max at a flow rate of 3.4lt/min and a volume concentration of 0.15%.
5.2: Water (H2O)
The heat transfer rate of distilled water is observed and analyzes at three different flow rates (2.27lt/min, 3.4lt/min, 4lt/min). The temperature variation is observed with change in time at different flow ratesat four different junctions i.e. Inlet, outlet, wall1, wall2.
[image:5.595.310.567.309.515.2]© 2018, IRJET | Impact Factor value: 6.171 | ISO 9001:2008 Certified Journal | Page 3667
Table 11: Temperature and Time for waterat 2.7lt/m
[image:6.595.315.553.105.312.2]Figure 13: Temperature vs Time for waterat 2.7lt/min The table 12 and figure 14represent the reading of temperature and time water at 3.4 lt/min flow rateat regular time intervals.
Table 12: Temperature and Time for waterat 3.4lt/m
Figure 14: Temperature vs Time for waterat 3.4lt/min The table 13 and figure 15represent the reading of temperature and time water at 4 lt/min flow rateat regular time intervals.
Table 13: Temperature and Time for waterat 4lt/m
Figure 15: Temperature vs Time for waterat 4lt/min By comparing the readings and observations from table eleven to table thirteen, it is found that the heat transfer rate for water is max at a flow rate of 3.4lt/min.
6.
Conclusion
The following conclusions have been made from the experiment MFrom the experiment, it has been found that the nano- coolant was most efficient at 0.15% volume concentration of TiO2 in water at a flow rate of 3.4lt/min.
1. The least time taken by the nano fluid(TiO2+ H2O) is observed
in table 6 i.e. 11 minutes. At the flow rate of 3.4l/min and 0.15% volume concenteration, the heat transfer coefficient, nusselt number is maximum.
2. The results for water as a coolant have been found maximum at a flow rate of 3.4lt/min.
3. The least time taken by water(conventional coolant) is observed in table 12 i.e. 13.5 minutes. It means water dissipates heat more effectively at a flow rate of 3.4 l/min. 4. By considering the above two points it is found that the
results obtained by adding nano particle TiO2 in water is
more efficient than the conventional coolant water.
7.
References
[1] G. Roy.et al, Heat transfer enhancement by using Nano fluids in forced convection flows, International Journal of Heat and Fluid Flow 26 (2005) 530e546.
[image:6.595.49.284.423.638.2]© 2018, IRJET | Impact Factor value: 6.171 | ISO 9001:2008 Certified Journal | Page 3668 [3] X. Wang. et al, Thermal conductivity of
nanoparticles-fluid mixture, Journal of Thermophysics and Heat Transfer 13 (4) (1999) 474e480.
[4] S. Kakaç. et al, Review of convective heat transfer enhancement with Nano fluids, International Journal of Heat and Mass Transfer 52 (2009) 3187e3196.
[5] P. Naphon. et al, Effect of coil-wire insert on heat transfer enhancement and pressure drop of the horizontal concentric tubes, International Communications in Heat and Mass Transfer 33 (6) (2006) 753e763.
[6] W.Y. Lai, B. Duculescu, P.E. Phelan, R.S. Prasher, Convective heat transfer with Nano fluids in a single 1.02-mm tube, in: Proceedings of ASME International Mechanical Engineering Congress and Exposition (IMECE 2006) (2006). [7] L.C. Wei. et al, An experimental investigation of forced convective cooling performance of a microchannel heat sink with Al2O3/water Nanofluid, Applied Thermal Engineering 30 (2009) 96e103.
[8]S.Gh. Etemad. et al, Experimental investigation of convective heat transfer of Al2O3/water Nanofluid in circular tube, International Journal of Heat and Fluid Flow 28 (2) (2007) 203e210.
[9] L. Godson.et al, Enhancement of heat transfer using Nano fluidsan overview, Renewable and Sustainable Energy Reviews 14 (2010) 629e641.