© 2018, IRJET | Impact Factor value: 6.171 | ISO 9001:2008 Certified Journal | Page 3809
PV Module fault detection & diagnosis
Prashant Rajak
1, Dr. S.K. Bharadwaj
2, Dr. Suresh Kumar Gawre
31
M.Tech Scholar, Dept. of EE, MANIT, BHOPAL, INDIA
2Professor, Dept. of EE, MANIT, BHOPAL, INDIA
3Assistant Professor, Dept. of EE, MANIT, BHOPAL, INDIA
---***---Abstract
- Due to the increasing demand of renewable energy system photovoltaic (PV) electrical power generation has become the most important and promising research tycoon. In order to increase the efficiency of the PV array used further research are being carried out for the localization and detection of faults. In this paper, we present different methods for fault detection. Method 1: fault detection by signal response in PV module strings. Method 2: fault diagnosis in PV system using discrete wavelet transform (DWT). Method 3: fault location in underground PV system using wavelets and artificial neural network (ANN). Method 4: fault detection and localization using current voltage sensing framework.Key Words
:
PV array, fault detection, discrete wavelet
transform (DWT), artificial neural network (ANN).
1 INTRODUCTION
Due to the increasing demand for renewable energy systems, especially PV system, fault detection techniques descripted are becoming more and more crucial. The fault detecting techniques are helpful to us such as they provide protection against equipment failure and thus decrease the cost of maintenance for example a hot spot fault can result into a fire hazard. It is clear that fault detection algorithm will increase efficiency, reliability, performance, safety of these system.
In reference [1] to detect the fault and its location in PV string the earth capacitance measurement (ECM) and time domain reflectometry (TDR) were applied to the faulty PV string. The disconnection between the modules are located by ECM by comparing the earth capacitance of the normal string and the faulty string. While the TDR method is employed to detect the impedance mismatch in PV string for periodic inspections. In reference [2] the evaluation of the proposed method is carried out using the MATLAB software. DWT method is employed to detect and identify the inflection point. DWT helps us to extract and define the coordinated notched points in I-V curve and localize position of this deflection even when noisy condition exists.
In reference [3] it proposes a novel fault location scheme in which high frequency noise patterns are used to detect the fault location. The high frequency noise is generated due to the switching transients of the converter combined with the parasitic capacitance of PV panels and cables. DWT is used for the decomposition of the monitored signal and features are extracted while on the other hand ANN are used to automatically classify the fault locations according to the features extracted. In reference [4] we present a new
technique for fault detection using current and voltage values in comparison to maximum measured signal values obtained during normal operating conditions. Specific detection zones are also been identified in order to determine the precise faulty zone. All four cases are described briefly in this section specially the worst case scenario fault which occurs when all the faults are occurring simultaneously.
In this paper we target about the various detection techniques for detection and diagnosis of PV fault occurring in the PV strings or either in underground PV system. So that the effective method is ought to be able to diagnose the faulty condition.
1.1PROPOSED FAULT DETECTION METHODS
Fault detection by signal response in PV module strings
The objective of this method is to develop fault diagnosis technologies for PV system especially for PV arrays. Among the various methods the electrical methods are the most promising for installation as well as for testing purpose.
To detect the fault and locate its position in the PV string, the earth capacitance measurement (ECM) and time domain reflectometry (TDR) were applied to the fault PV string. ECM helps to locate about the disconnection between the modules by comparing the earth capacitance of the normal string and the faulty string. On the other hand TDR is used to detect the mismatching of impedance in PV string.
© 2018, IRJET | Impact Factor value: 6.171 | ISO 9001:2008 Certified Journal | Page 3810 In the passive part the simulated data is compared with
the weather information of the PV site. If the difference of those data becomes greater than the threshold fault value then the system is considered to possess a fault.
Then at the fault separation part the fault is distinguished whether it is on A.C side or D.C side of the system. If the fault seems to be on the D.C side i.e. in PV array the active diagnosis method should be applied to locate the fault in PV array.
[image:2.595.313.554.114.270.2]In the active diagnosis method the target of diagnosis is the PV string. If a string has a trouble such as disconnection or degradation, the string output becomes zero or the I-V curve shape changes. Therefore, we can find which string has a trouble in advance and can carry out the recovery process as soon as it is possible as depicted in the below figure.
Fig. 2 Fault location target in PV string
BEHAVIOUR OBSERVED
TDR response waveform were changed according to the impedance mismatch position. The disconnection between the modules were clearly distinguished by TDR. This method is easily affected by the installation circumstances such as wiring, mounting the modules, mounting the materials.
Fault diagnosis in PV system using discrete wavelet transform (DWT)
This method is proposed to prevent the most common occurring fault in resident PV system (RPS) which is partial shading. It is well known to us that partial shading I-V curve of PV array has some notched and stepped points which are related to signature of shaded cells. In fact the value of the vertical height in the I-V curve represents the percentage of shading. Likewise, the horizontal or voltage distance from
VOC of the notched point is related to the number of cell
string which have been bypassed by diodes.
In this method DWT is employed to interpret traced I-V curve of PV system and defining these coordinated points in related diagnosis effort and also localize position of this deflection even under noisy condition.
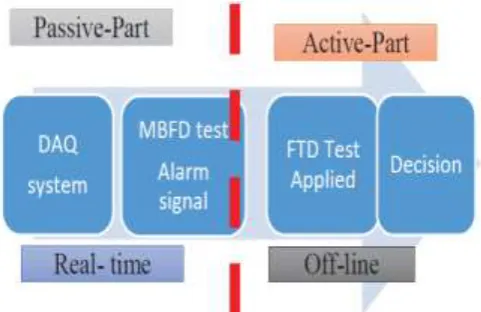
Fault diagnosis block diagram and procedure:
[image:2.595.50.292.286.422.2]This method consist of two parts passive part and active part.
Fig.3 Steps of fault detection methodology of PV panel for RPS
PASSIVE DIAGNOSIS
Residue signal is generated by comparing the measured power PV signal and simulated model on real time to observe the alarm signal and abnormal condition in the system. After manifesting it an error signal is definitely observed.
ACTIVE DIAGNOSIS
In this part load is disconnected from the PV and power generation and MPPT mode of inverter is interrupted. Thus by changing the switching pattern of the inverter I-V curve of the PV array is traced.
BEHAVIOUR OBSERVED
DWT is used as a preprocessing tool to implement fault diagnosis of RPS. DWT lets us to extract the features even in the presence of noise. DWT gives us an ease to access the percentage of shading.
Fault location in underground PV system using wavelets and artificial neural network (ANN)
© 2018, IRJET | Impact Factor value: 6.171 | ISO 9001:2008 Certified Journal | Page 3811 Fig. 4 Flowchart of proposed algorithm
The measured time domain signal is transformed into a time frequency domain by splitting it into low and high frequency components with a DWT based MRA technique. DWT is used foe decomposition of monitored signal and Different norms of noise at each level provides the location of fault and is used as extracted feature for pattern recognition. The extracted features are then used as inputs of a multilayer neural network classification algorithm. Thus the output of ANN classifier gives the exact location of fault.
BEHAVIOUR OBSERVED
The DWT based MRA technique was analyzed to extract the unique features of the noise signal measured at the mid-point of the DC to DC converter. Then a three layered feed forward classifier was adopted for pattern recognition to identify exact location of fault. Compared to existing methods the proposed method does not require an external high frequency signal injector, reduces the number of voltage sensors, and can locate the fault when the system is under operation. It can also operate under noisy condition.
Fault detection and localization using current voltage sensing framework
In this method we present a new technique for fault detection using current and voltage values in comparison to the maximum measured value obtained during normal operating conditions. Specific detection zones are identified to determine the precise faulty zone. In this method current voltage measurement are compared with the nominal data of the solar network. Here voltage value are used for localization of fault while current measurement were used to determine which type of fault has occurred. Under short circuit condition current signal value remain to be within the range of normal operating condition. In this method we do overcome these challenges by incorporating voltage data along with the current signals in framework for fault detection and localization.
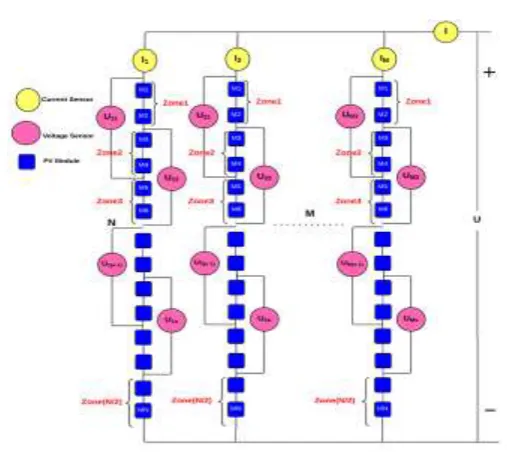
2 Fault detection and localization model for a PV system
[image:3.595.305.559.72.298.2]The photovoltaic array model is depicted in fig.5. In this model series parallel configuration is used. The entire PV module consist of (N*M) where, N is the number of modules connected in series and M is the number of modules connected in parallel in each string.
Fig.5 Schematic diagram of solar photovoltaic array (N*M)
The purple circle represents a voltage sensor and the yellow circle represents a current sensor. Each branch has 1 current sensor and ‘S’ voltage sensor.
2.1 Equations Used
The number of voltage sensor is determined by
S = n * (N - 1) / 4 * n – 2 (1)
Where ‘n’ is the number of PV modules covered by one voltage sensor
‘N’ is the number of PV modules connected in series in a branch
As the value of ‘n’ becomes smaller it becomes easier to locate the fault
Under normal operating conditions following conditions are true:
𝐼1 = 𝐼2 = 𝐼3 = ⋯ = 𝐼M (2)
Where 𝐼1 is the current sensor in branch 1
𝐼2 is the current sensor in branch 2
𝐼3 is the current sensor in branch 3
𝐼M is the current sensor in branch M and so on.
𝑈11 = 𝑈12 = ⋯ = 𝑈21 = 𝑈22 = ⋯𝑈S (3)
𝑈11 is the first voltage sensor in branch 1
𝑈12 is the second voltage sensor in branch 1
[image:3.595.43.284.93.195.2]© 2018, IRJET | Impact Factor value: 6.171 | ISO 9001:2008 Certified Journal | Page 3812 𝑈22 is the second voltage sensor in branch 2
And 𝑈S is standard voltage as shown in (4)
𝑈S = (n/N)* 𝑈M (4)
Where 𝑈M is the maximum output voltage of the entire PV array. But under abnormality the above mentioned conditions does not hold good. In this scenario the output current of the faulty branch is not the same as of healthy branch.
2.2 Conditions for Occurrence of Fault
When the difference between any voltage sensor in a branch and the standard voltage is greater than the threshold voltage. When the current in any branch is below the standard current.
Procedure for detection and localization of fault
Each branch is divided into different zones to determine the exact location of fault. The classification of fault has been done on the value of the output current and the variation of voltage signal of each branch. The output current of the faulty branch is compared to the rated current. If the output current falls 10% below the rated current no fault is said to Occurred. An open circuit fault is said to occur if the output current of the designated branch is zero. On the other hand if the current is reported to have healthy values, but the difference between any voltage sensor in a branch and the standard voltage is greater than the threshold voltage then a short circuit fault is said to occur. If the current is reduced to more than 40% of the rated value then the phenomenon of hot spot fault is said to be existing.
3. CONCLUSIONS
Various techniques where introduced for determining and locating the types of PV faults. Different algorithms were also developed to carry out the fault detection and diagnosis methodology. The major objective of each and every method proposed is to develop a robust and effective model with a minimum number of human operator involved. Through the fault detection system development, we clarified the output characteristics in faulty PV array.
While detecting the faults in PV string by using signal response, TDR is unable to clearly estimate the position of open circuit fault.
The other two fault detection methods were also based on current voltage measurement but the results gained low accuracy in terms of fault localization when compared to the last detection technique described.
The first three proposed methods incorporated current voltage measurement and compared such data against the nominal solar network. In these methods the voltage values were used to localize the fault while the current values were
used to determine whether a fault has occurred or not. This leads to error specifically under short circuit conditions. Under such conditions current value remains to be within the range of normal operating conditions. So, in the last detection technique we do overcome this challenge by incorporating voltage data along with the current signals in a framework for fault detection and localization.
REFERENCES
[1] T. Takashima, J. Yamaguchi and M. Ishida, "Fault
detection by signal response in PV module strings," 2008 33rd IEEE Photovoltaic Specialists Conference, San Diego, CA, USA, 2008,pp.1-5.doi: 10.1109/PVSC.2008.4922843
[2] M. Davarifar, A. Rabhi, A. Hajjaji, E. Kamal and Z.
Daneshifar, "Partial shading fault diagnosis in PV system with discrete wavelet transform (DWT)," 2014 International Conference on Renewable Energy Research and Application (ICRERA), Milwaukee, WI,
2014, pp. 810-814.
doi: 10.1109/ICRERA.2014.7016497
[3] I. M. Karmacharya and R. Gokaraju, "Fault Location in
Ungrounded Photovoltaic System Using Wavelets and ANN," in IEEE Transactions on Delivery Power, vol. 33, no. 2, pp. 549-559, April2018.doi: 10.1109/TPWRD.2017.2721903
[4] M. Alajmi and I. Abdel-Qader, "Fault detection and
localization in solar photovoltaic arrays using the current-voltage sensing framework," 2016 IEEE International Conference on Electro Information Technology (EIT), Grand Forks, ND, 2016,pp.03070312.doi:10.1109/EIT.2016.753527
[5] H. Braun et al., "Signal processing for fault detection in
photovoltaic arrays," 2012 IEEE International Conference on Acoustics, Speech and Signal Processing (ICASSP), Kyoto, 2012, pp.1681-1684. doi: 10.1109/ICASSP.2012.6288220
[6] W. Rezgui, H. Mouss, N. Mouss, D. Mouss, M. Benbouzid
and Y. Amirat, "Photovoltaic module simultaneous open-and short-circuit faults modeling open-and detection using the I–V characteristic,"2015 IEEE 24th International Symposium on Industrial Electronics (ISIE), Buzios,2015,pp.855-860.
doi: 10.1109/ISIE.2015.7281582
[7] T. Shimakage, K. Nishioka, H. Yamane, M. Nagura and M.
Kudo, "Development of fault detection system in PV system," 2011 IEEE 33rd International Telecommunications Energy Conference (INTELEC), Amsterdam, 2011, pp. 1-5.doi: 10.1109/INTLEC.2011.6099727
[8] W. Chine, A. Mellit, A. M. Pavan and V. Lughi, "Fault
© 2018, IRJET | Impact Factor value: 6.171 | ISO 9001:2008 Certified Journal | Page 3813 Conference on Clean Electrical Power (ICCEP),
Taormina,2015,pp.6772.doi:10.1109/ICCEP.2015.71776 02
[9] I. A. Karim, "Fault analysis and detection techniques of
solar cells and PV modules," 2015 International Conference on Electrical Engineering and Information Communication Technology (ICEEICT), Dhaka, 2015, pp.1-4. doi: 10.1109/ICEEICT.2015.7307349
[10] H. Jain and S. K. Gawre, "Detection and classification of
current interruptions and transients by using Wavelet Transform and neural network," 2016 International Conference on Electrical Power and Energy Systems (ICEPES), Bhopal, 2016, pp. 462-468. doi: 10.1109/ICEPES.2016.7915975
[11] Suresh K. Gawre, N.P. Patidar And R.K. Nema, (2012)