© 2017, IRJET | Impact Factor value: 5.181 | ISO 9001:2008 Certified Journal | Page 2597
Development of 2D Map and 3D Model of GIT Campus using GIS
Technology
Kartik R. Kulkarni
1, Yatish C. H.
1, Kiran P. Kamble
1, Ashish A. Kulkarni
1, Shashank C. Bangi
21
Student, Dept. Of Civil Engineering, K.L.S Gogte Institute of Technology, Belagavi, Karnataka, India
2
Assistant Professor, Dept. Of Civil Engineering, K.L.S Gogte Institute of Technology, Belagavi, Karnataka, India
---***---Abstract -
Geographical data can be represented both in 2Dand 3D. Geographic Information Systems (GIS) combined with 3D visualization technology is an emerging tool for urban planning and landscape design applications. It has become an essential tool since its purpose is to extract the relevant information in the available data, thus helping it in Exploring, Analyzing and Designing process. In this work the campus of K.L.S Gogte Institute of Technology is selected as the study area which is located in Udyambag Belagavi. The objective of this study is to create the 2D map and 3D model of the campus and to present the current status using the GIS concept. The aim of this project is to show how softwares like google earth, SketchUp and QGIS can be used to represent 2D and 3D environment with more reliability, accuracy and less time.
Key Words: 2D and 3D campus map, SketchUp, Google Earth,
KML, campus model.
1. INTRODUCTION
Virtual 3D modeling is a very important and hot topic for researchers of geomatics. 3D city models have evolved to important tools for urban decision processes and information system especially in planning, simulation, networks, and navigation. Educational Institute or University has its own campus which is an important indicator for the quality of Educational Institute. Usually campus includes the academic and non-academic buildings. In the modern digital era, the demand of 3D Campus is increasing. Virtual 3D model of campus gives a good and photo-realistic appearance. In this paper, we are giving a simple and cheapest solution to create virtual 3D campus of any educational institute. This method and techniques will be very useful for the owner of College, Institute or University. By using this method they can make a virtual model of campus. These 3D campus models can also be published on the website of that Institute or University. In this study, we used simple digital images and very cost effective SketchUp software. So the need of this kind of study is very important and useful for 3D modeling community.
2. LITERATURE REVIEW
[1] Hardik Panchal, RizwankhanSmita Senugupta and
N.L.Sarda conducted the work on a semi-automatic approach for creating 3D building information.
Photorealistic outdoor and basic indoor models has been presented using software such as SketchUp, AutoCAD, Keyhole Markup Language(KML) and CityGML.
[2] Pradip Ashok Saymote worked on SketchUp as a
powerful tool for 3d mapping and model. In this study the author explains the ease with which SkecthUp can be worked with. ShivajiUniversity, Kolhapur, Maharashtra, India. The 3D model of the university has been created and they are painted use the tool “paint”.
[3] Surendra Pal Singh, Kamal Jain and V. Ravibabu
Mandlaworked on image based 3D modeling of campus (Department of Civil Engineering, IIT Roorkee, Uttarakhand, India) using SketchUp. In this study they selected area as Department of civil engineering, IIT Roorkee, Roorkee, Uttarakand, India. 3D model of Department of civil engineering has been made. The 3D models are created using SkecthUp software. The images of the department were taken using Sony cyber shot camera.
2.1. Inference
[1] The demand for 3D geospatial data and modeling
for urban environment continuously increasing.
[2] In the past, Integration of geospatial and 3D model
was very difficult but now the rapid evolution of 3D GIS technology and integrative modules and softwares bringing us the hope to develop geospatial 3D model.
[3] Three dimensional GIS simulation always
communicates more effectively than two dimensional maps.
2.2. Objectives
[1] To develop the 2D map of the campus and also to
calculate the areas and volume of the various buildings in the campus.
[2] To present the current status of using the 3D GIS
concept for 3D model of campus.
[3] To describe the integration of geo informatics
technique with 3D modelling software.
[4] To describe how softwares like google earth, sketch
© 2017, IRJET | Impact Factor value: 5.181 | ISO 9001:2008 Certified Journal | Page 2598 3D environment with more reliability, accuracy and
less time.
[5] To develop 3D virtual photorealistic model of the
campus and present it on most popular google earth platform.
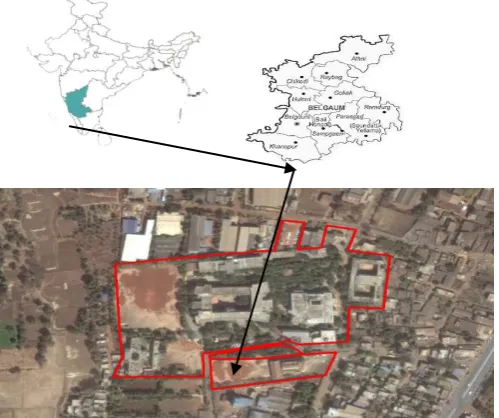
3. STUDY AREA
The campus of K.L.S Gogte Institute of Technology is selected as the study area. It extends from 15°48’49.51”N latitude to 15°49’00.09”N latitude and 74°29’08.72”E longitude to 74°29’21.32”E longitude
Fig -1: G.I.T campus, Udyambag, Belagavi
4. METHODOLGY
Fig -2: Flow chart of Methodology
The methodology involves mainly use of three softwares i.e., are SketchUp, Google Earth, and QGIS for 2D Mapping and 3D Modeling.
4.1 2D Mapping Google Earth
[1] In this the study area i.e., the GIT Campus is selected.
[2] Using the 'polygon' command the boundary of the
GIT Campus and the boundaries of each buildings are drawn.
[3] Then GIT Campus is grouped under subheadings like permanent structures, temporary structures, pavement, open spaces and vegetation.
[4] These boundaries are imported to QGIS.
QGIS
[1] The boundaries formed are on the curved surfaces of
the earth. These files are in the kmz or kml format.
[2] These curved surfaces are to be converted to flat surfaces. So this kmz files are converted to ESRI shape files format (.shx).
[3] From the property of the shape file the style of the shape file are modified. Single color for one component is allotted. If more components are there then they are categorized by giving the different colors. If necessary labels are also added.
[4] The above procedure is followed for each shape file.
These shape files together forms the campus map.
[5] A new print composer is created. In this a blank page appear.
[6] In the blank page the map is added to suitably fit the
page from the layout option. Then label if necessary, it is added.
[7] A scale bar is added from layout option. So when
there is further reference it becomes the conversion factor.
[8] Legends are added from the layout option. These all
segments are properly adjusted to fit suitable to the paper.
4.2 3D Model SketchUp
[1] In sketchup, there is a tool called 'add location' using this any location or any region from the goggle earth can be added. Using this tool the study area i.e., GIT Campus is added from the goggle earth.
[2] Using 'pencil' tool the boundary of the GIT Campus
and the boundaries of each buildings of the campus is drawn. These boundaries drawn forms the base map of the GIT Campus with all the buildings in it.
[3] Using the tool 'extrude' base map of the each
[image:2.595.37.287.260.469.2]© 2017, IRJET | Impact Factor value: 5.181 | ISO 9001:2008 Certified Journal | Page 2599 This forms the 3D view of each buildings of the
campus.
[4] The photographs of each faces of the each buildings of the campus are taken from the camera. These photographs are used as textures. These photographs are processed to the correct perspective.
[5] These photographs are textured to their
corresponding faces of each buildings. This forms the 3D view of each building with textures . This is the 3D model of the GIT Campus.
5. RESULTS AND DISCUSSION
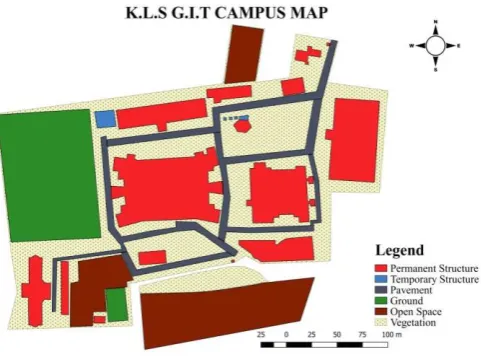
5.1 2D Mapping
The map of K.L.S G.I.T Campus has been developed using Google Earth and QGIS. It has represented the various types of structures such as permanent and temporary structures, grounds, pavements, open space, vegetation in the campus by various colors. It also gives surface areas of the same.
Fig -3: 2D Map of the Campus
Two another types of maps are generated
[1] Only Permanent Structures: It consists of Main Building Mechanical building, Library, Boys Hostel, Girls Hostel, Canteen Workshop. The surface areas of each building, also the volume are calculated.
[2] Temporary Structures, Pavements, Ground, Open Spaces, Vegetation: The temporary Structure consists of the cafes, an ice-cream parlour, Bus stand. Roads inside the campus, ground, and open spaces are also included. Their areas are also calculated.
Fig -4: 2D Map of Permanent Structures in the Campus
Fig -5: 2D Map of Temporary Structurtes in the Campus
[image:3.595.311.564.91.284.2]The areas and volumes of various sections are shown in Table-1. Similarly the area of each single building in the campus can be obtained. The volumes of the same can be obtained by entering the height information of respective buildings.
Table -1: Various areas and volume in the campus
Name Area in m2 Volume in m3
Permanent Structure 19262.01 275104 Temporary Structure 367.53 2030.64
Pavement 6847.07 -
Grounds 12263.21 -
Open Space 12011.96 -
[image:3.595.316.554.320.495.2] [image:3.595.41.282.358.538.2]© 2017, IRJET | Impact Factor value: 5.181 | ISO 9001:2008 Certified Journal | Page 2600
Table -2: The area of the whole campus
Name Area in m2
Compound 72691.76 vegetation 1989.12 Rice Mill 7668.34
Total 82349.22
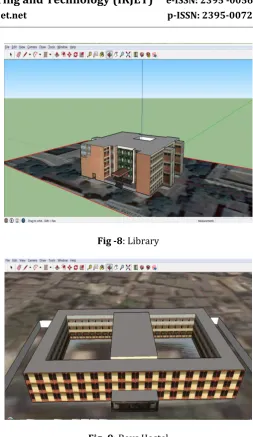
5.2 3D Modeling
With the aid of software SketchUp the 3-dimensional models of various buildings of the have been developed. These models are Geo-referenced, hence whenever they are searched on Google Earth platform the 3-dimensional model of the campus appears. The below screen shots are taken from SketchUp which reveals the various views of 3-dimensional model of the campus
Fig -6: View of the Campus
Fig -7: Side view of Auditorium
Fig -8: Library
Fig -9: Boys Hostel
5. CONCLUSIONS
[1] Various techniques are available for 3D campus
modeling. Each technique have some advantage and also some limitations. Some techniques are very costly and not very easy to make the 3D campus. Simple and cheapest solution to create virtual 3D campus of educational institute has developed.
[2] In this work the technique employed is
simple and user friendly
time effective
cost effective
[3] Developed 2d map of GIT campus.
[4] Developed 3d model of GIT campus. This virtual
3D model of campus gives a good and photo-realistic appearance.
[5] The technique employed in this study has given
the good results with higher accuracy.
[6] These 3D campus models can also be published
[image:4.595.88.239.122.199.2] [image:4.595.36.287.334.505.2]© 2017, IRJET | Impact Factor value: 5.181 | ISO 9001:2008 Certified Journal | Page 2601
REFERENCES
[1] M. Shashi and Jain Kamal, “Use of Photogrammetry in 3D modeling and Visualization of Building”, ARPN Journal of Engineering and Applied Science, 2007. 2 (2) 1819-6608.
[2] Singh Surendra Pal, Mandla V. Ravibabu and Jain
Kamal, 2012: “3-D Building Modeling from Close Range Photogrammetry”, International Conference on Geo-spatial Technologies and Applications, CSRE, Indian Institute of Technology, Bombay (IITB), India.
[3] Singh Surendra Pal, Mandla V. Ravibabu, and Jain
Kamal, 2013, “Virtual 3D City Modeling: Techniques and Applications. International Archives of the Photogrammetry, Remote Sensing and Spatial Information Sciences”, Volume XL-2/W2, ISPRS 8th 3D Geo Info Conference & WG II/2 Workshop, Istanbul, Turkey.
[4] Hardik Panchal, Rizwan Khan and SmitaSengupta,
GISE Advance Lab, Indian Institute of Technology, Bombay, Powai, Mumbai.
BIOGRAPHIES
Kartik Ramesh Kulkarni, Student,
Dept. of Civil Engineering,
K.L.S Gogte Institute Of Technology Belagavi.
Yatish C. H, Student,
Dept. of Civil Engineering,
K.L.S Gogte Institute Of Technology Belagavi.
Kiran P. Kamble, Student,
Dept. of Civil Engineering,
K.L.S Gogte Institute Of Technology Belagavi.
Ashish A. Kulkarni, Student,
Dept. of Civil Engineering,
K.L.S Gogte Institute Of Technology Belagavi
Shashank C. Bangi, Professor,
Dept. of Civil Engineering,