http://dx.doi.org/10.4236/ojfd.2014.45031
Comparison of One-Dimensional Analysis
with Experiment for CO2 Two-Phase
Nozzle Flow
Wakana Tsuru, Satoshi Ueno, Yoichi Kinoue, Norimasa Shiomi
Department of Mechanical Engineering, Saga University, Saga, Japan
Email: [email protected]
Received 15October 2014; revised 6November 2014; accepted 5December 2014
Copyright © 2014 by authors and Scientific Research Publishing Inc.
This work is licensed under the Creative Commons Attribution International License (CC BY).
http://creativecommons.org/licenses/by/4.0/
Abstract
The aim of this study is to investigate CO2 two-phase nozzle flow in terms of both experimental and analytical aspects for the optimum design of two-phase flow nozzle of CO2 two-phase flow ejector. In the experiment, it is measured that the temperature profile in the stream-wise direction of a divergent-convergent nozzle through which CO2 in the supercritical pressure condition is blown down into the atmosphere. In the analysis, a one-dimensional model which assumes steady, adia-batic, frictionless, and equilibrium is proposed. In the convergent part of the nozzle the flow is treated as single-phase flow of liquid, whereas in the divergent part the flow is treated as sepa-rated two-phase flow with satusepa-rated condition. The analytical results indicate that the tempera-ture and the pressure decrease rapidly in the divergent part, and the void fraction increases im-mediately near the throat. Although this analysis is quite simple, the analytical results can follow the experimental results well within this study.
Keywords
Carbon Dioxide, High-Speed Nozzle Flow, Gas-Liquid Two-Phase Flow with Phase Change, Blow down Test, One-Dimensional Analysis
1. Introduction
In recent years, natural refrigerants are regarded as refrigerants of refrigeration cycles. Because of the highly safety and the small global warming coefficient, carbon dioxide (CO2) is especially focused. However, wasted
and a gas-liquid two-phase flow ejector (two-phase flow ejector) is used to recover the energy [1] [2].
A two-phase flow ejector consists of a driving flow nozzle, a suction chamber, a mixing section and a diffuser, respectively. Many researches for single-phase flow ejectors have been carried out. However for two-phase flow ejectors, the mechanisms of the internal flow with phase change have not been sufficiently made clear yet be-cause of the complexly of the flow. This study is carried out on a gas-liquid two-phase flow nozzle (two-phase flow nozzle) of a driving nozzle flow section which is the most important section.
A divergent-convergent nozzle is generally used as a two-phase flow nozzle [3]. In actual CO2 refrigeration
cycle, the typical value of the inlet pressure of the expansion valve is 9 MPa which exceeds the critical pressure of CO2, 7.38 MPa. Therefore, in a CO2 two-phase flow nozzle, the pressure of the nozzle inlet and the
conver-gent section pressure are the supercritical pressure. And the flow in the diverconver-gent section is the saturated two- phase flow with phase change (boiling). The CO2 two-phase flow in the nozzle is a complicated high-speed flow
with large changes in both temperature and pressure. For the optimum design of the nozzle which has these characteristics, the investigation of the fluid mechanics of the high speed gas-liquid two-phase flow is important.
For the two-phase nozzle flow there are studies conducted by Nakagawa et al. [3]-[6]. Nakagawa et al. inves-tigated nozzle shapes experimentally [3] [4], and proposed a one-dimensional analytical model for the flow [5] [6]. In their study, they analyzed a shock wave caused by a velocity relaxation and a temperature relaxation with the one-dimensional model. A phenomenon that the flow in the nozzle is not accelerated well owing to the exis-tence of a shock wave has been explained by the analysis. On the other hand, it is necessary to analyze a phe-nomenon for the case that the flow in the nozzle accelerates and the pressure decreases sufficiently.
The purpose of this study is to conduct experimental and analytical investigations of the flow in the two-phase flow nozzle. In the experiment, in the similar way used by Nakagawa et al. [4], the CO2 flow that goes through
the divergent-convergent nozzle into the atmosphere is researched, where the temperature and the pressure dis-tribution in the mainstream direction are investigated. In the analysis, one-dimensional analytical model as-sumed to be steady, adiabatic process, frictionless and equilibrium is investigated. The model refers to the for-mularization by Sudo and Katto [7] for the study of the critical flow rate of a compressible gas-liquid two-phase flow. A method to predict various distributions of flow properties along the mainstream is considered by solving fundamental equations, which are obtained from applying conservation of mass, momentum and energy to the flow in the two-phase flow nozzle, simultaneously.
2. Experimental Apparatus and Procedure
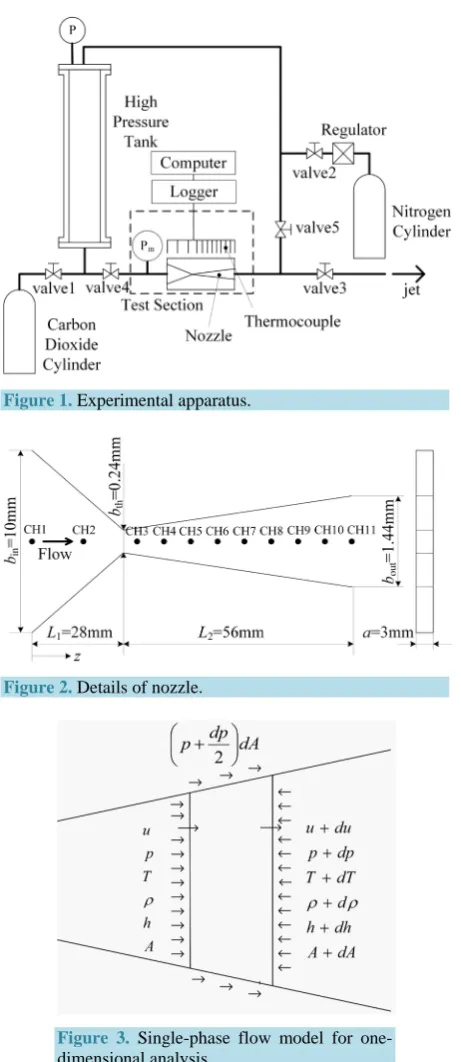
Figure 1is the schematic diagram of experimental apparatus based on Nakagawa et al. [4]. The experimental apparatus mainly consists of a high-pressure tank and a test section. The high-pressure tank is filled up with gases in the order of CO2 and N2, and high-pressure CO2 can be obtained. The test section consists of the
pres-sure measuring part at the nozzle inlet and the nozzle.
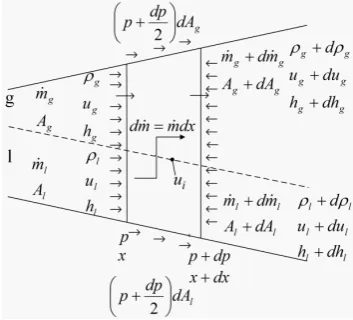
Figure 2shows the rectangular nozzle [4] used for the nozzle part, where z is the distance from the nozzle inlet in the mainstream direction. Thermocouples are set on a side wall of the nozzle as shown inFigure 2, and the temperature inside the nozzle is measured. The pressure is calculated by using assumption of saturated con-dition and the measured temperature. CO2 is emitted through the test section into the atmosphere.
The pressure in the high pressure tank is set four stages from 7.2 MPa to 10.3 MPa, and the CO2 gas is left
until the tank temperature is the same temperature of the room of 300.15 K. At the time of starting the experi-ment, valve 3 and valve 4 inFigure 1 are opened to flow CO2 in the nozzle. The outputs of the thermocouples
and the load cell are saved on a computer. The weight of the tank is measured at before and after the test, and the CO2 mass flow rate is calculated from the duration time of the emission.
3. One-Dimensional Analysis
3.1. Analytical ModelIn the CO2 nozzle flow, the temperature and the pressure distributions change rapidly, and the phase
condi-tion changes from supercritical to saturated two-phase condicondi-tion. To get the most important aspect of the complex flow, in this study, a one-dimensional analytical model is used. For this analysis, the flow is as-sumed to be steady, adiabatic, no friction and equilibrium.
Figure 1. Experimental apparatus.
Figure 2. Details of nozzle.
Figure 3. Single-phase flow model for one- dimensional analysis.
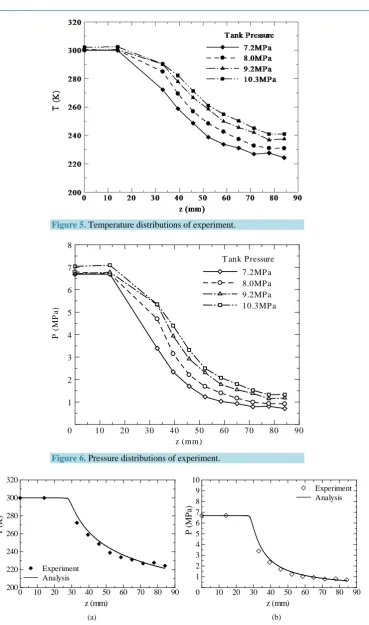
h the enthalpy, and A is the area of the cross section. Appling the laws of conservation of mass, mo-mentum and energy to a minute section shown inFigure 3, Equations (1) to (3) is obtained,
d d d d
p T
u
u T u P u A
T P A
ρ ρ ρ ρ
∂ ∂
+ + = −
∂ ∂
(1)
1
dP du 0
u
d d 0
P T
h h
dT P u u
T P
∂ ∂
+ + =
∂ ∂
(3)
where dA is positive. To obtain the temperature, the pressure and the velocity variations, dT , dP and du, Equations (1) to (3) are solved simultaneously.
The flow in the divergent section is treated as a saturated separated two-phase flow. A model of the sepa-rated gas-liquid two-phase flow is shown inFigure 4. Appling the laws of conservation of mass, momentum and energy of each phase to a minute section as shown inFigure 4, Equations (4) to (7) is obtained,
(
)
(
)
(
)
d d
1 d d 1 d d d
d d
g g g g g g g l l
l l l l l
g l g g l l
g l g l
u u u u
u u
x x P x u x u u u x A
P P u u m
ρ ρ ρ ρ ρ
ρ ρ ρ ρ ρ
ρ ρ
−
+ − + + − + − =
(4)
(
)
d d g g i d 0
g g
x
P x u u u x
u
ρ + + − = (5)
(
)
(
)
1
d 1 d l i l d 0
l l
x
P x u u u x
u
ρ −
+ − + − = (6)
(
)
(
)
2 2d d 1 1
1 d d 1 d d 0
d d 2 2
g l
g g l l g g l l
h h
x x P xu u x u u h u h u x
P P
+ − + + − + + + + =
(7)
where m , x and ui inFigure 4are the mass flow rate, the quality and the velocity of the interface of the
phases, g and l of subscripts indicate the gas and the liquid phase, and dA is positive. The pressure, the gas velocity, the liquid velocity and the quality variations of the separated saturated gas-liquid two-phase flow, dP, dug, dul and dx, are obtained by solving Equations (4) to (7) simultaneously.
InFigure 4 and Equations (4) to (7), the phase change model as changing from liquid to gas is applied to the minute mass flow rate, dm =m xd , which correspond to the quality variation in minute section, dx.
Simple and typical models of a gas-liquid two-phase flow are a separated flow model neglecting friction between the phases and a homogeneous flow model neglecting velocity difference between the phases. In the divergent section of the two-phase flow nozzle, since it is expected that the distribution of the void fraction changes significantly from 0 to 1, appropriate application of the two models is desirable. However, in this study, the whole flow in the divergent section of the two-phase flow nozzle is simply treated as a separated flow.
3.2. Analytical Object and Methods
[image:4.595.224.401.535.695.2]The analysis is carried out on the flow in the convergent-divergent nozzle [4] shown inFigure 2. The flow in the rectangular nozzle that is 3 mm wide is analyzed in the mainstream direction. The nozzle that the total length
is 84 mm is divided into 8400 cells (each section interval is 0.01 mm), and the flow is numerically analyzed by using fundamental equations which is appropriate for each section. There are not much difference between the results of the cases of 8400, 4200 and 16800 cells. Needed CO2 properties for the calculation process are
ob-tained by PROPATH.
In the convergent section of the nozzle in which flow is treated as the single-phase flow, a flow which reached saturated condition is addressed as saturated liquid. Therefore, excluding dT in Equations (1) and (3), dP and du is calculated. In the divergent section of the nozzle in which flow is treated as the separated gas-liquid two-phase flow, the velocity at the interface between the phases is the liquid velocity in case of dx>0, namely
i l
u =u . The initial quality is 0.001 at the throat. The experimental results are applied to the inlet boundary con-ditions of the analysis. Thus, the temperature measured by the thermocouple CH1 shown inFigure 2 and the measured pressure, Pin, shown inFigure 1 are used as the inlet temperature and the pressure respectively. For
the mass flow rate, the value calculated by using the experimental results is used.
4. Results and Discussions
4.1. Experimental ResultsThe experimental conditions at the nozzle inlet are listed inTable 1. The distribution of the temperature meas-ured by the thermocouples in the mainstream direction is shown inFigure 5. The CO2 temperature in the nozzle
decreases sharply, and in the case of the tank pressure of 7.2 MPa the difference in temperature between the inlet and the outlet is 80 K. As the tank pressure increases, the temperature at the nozzle outlet also increases. The nozzle outlet temperature for the tank pressure of 10.3 MPa is approximately 17 K larger than that of the tank pressure of 7.2 MPa.
Figure 6shows the pressure distribution in the mainstream direction in the nozzle obtained by using the as-sumption of saturated condition and the temperature in Figure 5. The CO2 pressure decreases sharply in the
nozzle as well as the temperature. Thus, it could be considered that CO2 accelerates sufficiently in the nozzle. As
the tank pressure increases, the nozzle outlet pressure also increases. Regarding the nozzle outlet pressure, the one for the case of the tank pressure of 10.3 MPa is approximately 0.6 MPa larger than that of 7.2 MPa.
4.2. Comparison of Experiment and Analysis
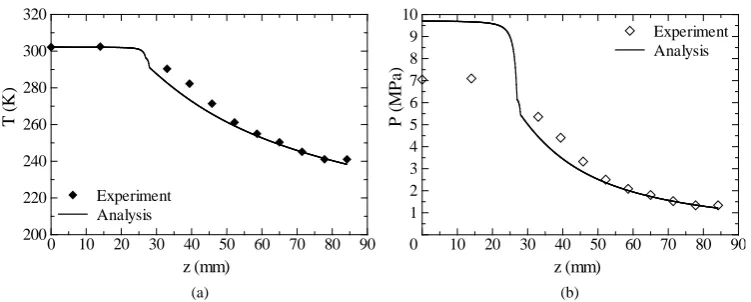
The comparison of the experimental and the analytical results of the temperature distribution (a) or the pressure distribution (b) in the cases that the tank pressure is set to 7.2, 8.0, 9.2 and 10.3 MPa are shown inFigures 7-10.
In the case of the tank pressure of 7.2 MPa, as shown inFigure 7, the experimental and the analytical results can be considered almost the same. Since the condition of the nozzle inlet is approximately saturated, the flow in the convergent section of the nozzle is treated as saturated liquid.
In the case of the tank pressure of 8.0 MPa, as shown inFigure 8, the temperature distribution of the analysis is almost the same as that of the experiment. In the pressure distribution the analytical results in the convergent section are different from the experimental results, whereas, in the divergent section, the analytical results ap-proximate to the experimental results. In the convergent section, since the critical pressure of CO2 is 7.38 MPa,
it can be considered that the discrepancy is caused by the setting of the tank pressure to the supercritical pressure and the condition is not saturated in the experiment.
RegardingFigure 9 of the tank pressure of 9.2 MPa, for above reasons, the pressure difference between the experimental and the analytical results in the nozzle convergent section is caused. For the pressure in the diver-gent section and the temperature distribution of the analysis, the analytical results are rather smaller than the
Table 1. Experimental conditions.
Tank pressure (MPa)
Inlet temperature (K)
Inlet pressure (MPa)
Inlet velocity (m/s)
Mass flow rate (kg/m3)
7.2 300.0 6.7 2.92 0.06
8.0 300.6 7.6 3.65 0.08
9.2 300.0 8.5 4.34 0.10
Figure 5. Temperature distributions of experiment.
Figure 6. Pressure distributions of experiment.
(a) (b)
Figure 7. Comparison of analysis with experiment (tank pressure = 7.2 MPa). (a) Temperature; (b) Pressure.
P
(
M
P
a
)
z (mm)
7.2MP a 8.0MP a 9.2MP a 10.3MP a T ank P ressure
0 10 20 30 40 50 60 70 80 90
1 2 3 4 5 6 7 8
z (mm)
T
(
K
)
Experiment Analysis
0 10 20 30 40 50 60 70 80 90
200 220 240 260 280 300 320
z (mm)
P
(
M
P
a)
Experiment Analysis
0 10 20 30 40 50 60 70 80 90
(a) (b)
Figure 8. Comparison of analysis with experiment (tank pressure = 8.0 MPa). (a) Temperature; (b) Pressure.
[image:7.595.129.501.273.423.2](a) (b)
Figure 9. Comparison of analysis with experiment (tank pressure = 9.2 MPa). (a) Temperature; (b) Pressure.
(a) (b)
Figure 10. Comparison of analysis with experiment (tank pressure = 10.3 MPa). (a) Temperature; (b) Pressure.
experimental results around the throat. However, in area excepting the near throat, the analytical and the ex-perimental results are approximately the same.
For the pressure in the divergent section and the temperature distribution in the case of the tank pressure of 10.3 MPa shown inFigure 10, the differences between the analytical and the experimental results at the near throat is larger than that of 9.2 MPa. Whereas, except the near throat, the analytical and the experimental results are well matched.
z (mm) T ( K ) Experiment Analysis
0 10 20 30 40 50 60 70 80 90
200 220 240 260 280 300 320 z (mm) P ( M P a) Experiment Analysis
0 10 20 30 40 50 60 70 80 90
1 2 3 4 5 6 7 8 9 10 z (mm) T ( K ) Experiment Analysis
0 10 20 30 40 50 60 70 80 90
200 220 240 260 280 300 320 z (mm) P ( M P a) Experiment Analysis
0 10 20 30 40 50 60 70 80 90
1 2 3 4 5 6 7 8 9 10 z (mm) T ( K ) Experiment Analysis
0 10 20 30 40 50 60 70 80 90
200 220 240 260 280 300 320 z (mm) P ( M P a) Experiment Analysis
0 10 20 30 40 50 60 70 80 90
[image:7.595.127.503.460.611.2]4.3. Analytical Results
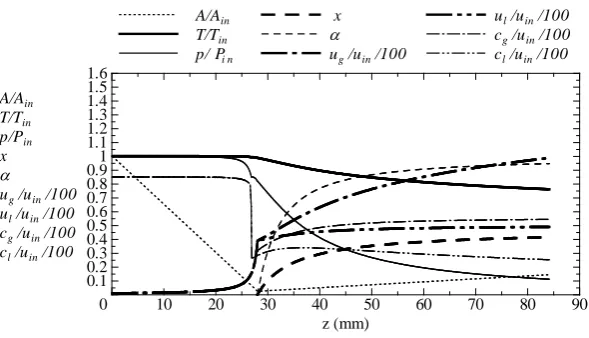
Figures 11-14show the analytical flow property distributions of the cases that the tank pressure set to 7.2, 8.0, 9.2 and 10.3 MPa, respectively. InFigures 11-14, the analytical results are marked with dotted line for cross sectional area, A Ain (Ain: cross sectional area at the nozzle inlet), bold solid line for the temperature, T Tin
(Tin: the nozzle inlet temperature), small solid line for the pressure, P Pin (Pin: the nozzle inlet pressure), bold
broken line for the quality, x, small broken line for the void fraction, α , bold chain line for the gas-phase ve-locity, ug uin 100 (uin: the nozzle inlet velocity, these values are indicated in Figures 11-14 respectively),
bold two-dot chain line for the liquid-phase velocity, u ul in 100, small chain line for the gas-phase sonic ve-locity and small two-dot chain line for cg uin 100, and the liquid-phase sonic velocity, c ul in 100. To see these figures clearly, ug, ul, cg and cl are divided by 100. The single-phase and the two-phase sonic
ve-locity and the void fraction are calculated by following formulas,
(
lu xl)
{
gug(
1 x)
lu xl}
α= ρ ρ − +ρ (8)
(
d d)
c= P ρ (9)
(
d d)
g g
c = P ρ (10)
(
d d)
l l
c = P ρ (11)
[image:8.595.166.461.351.514.2]where c in the convergent section is marked with the same small chain line as cg is marked with.
Figure 11. Analytical results (tank pressure = 7.2 MPa).
Figure 12. Analytical results (tank pressure = 8.0 MPa). z (mm) A/Ain
T/Tin
p / P i n
x
α
ug /uin /100
ul /uin /100
cg /uin /100
cl /uin /100
A/Ain
T/Tin
p/Pin
x
α
ug /uin /100
ul /uin /100
cg /uin /100
cl /uin /100
0 10 20 30 40 50 60 70 80 90
0.1 0.2 0.3 0.4 0.5 0.6 0.7 0.8 0.91 1.1 1.2 1.3 1.4 1.5 1.6 z (mm) A/Ain T/Tin
p / P i n
x
α
ug /uin /100
ul /uin /100
cg /uin /100
cl /uin /100
A/Ain
T/Tin
p/Pin
x
α
ug /uin /100
ul /uin /100
cg /uin /100
cl /uin /100
0 10 20 30 40 50 60 70 80 90
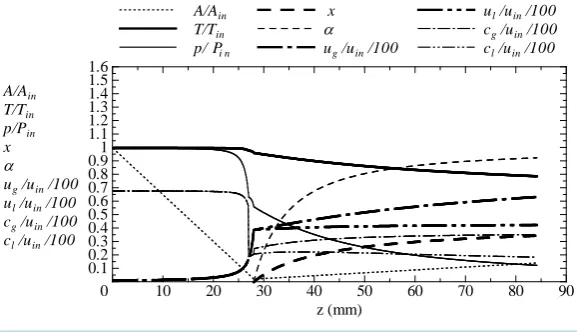
[image:8.595.167.462.539.708.2]Figure 13. Analytical results (tank pressure = 9.2 MPa).
Figure 14. Analytical results (tank pressure = 10.3 MPa).
In the case of the tank pressure of 7.2 MPa, as shown inFigure 11, the quality, x, is approximately 0.45, the void fraction, α , is approximately 0.95, the gas-phase velocity, ug, is 1.3, and the liquid-phase velocity, ul,
is 0.55. Multiplied uin and 100, ug and ul are approximately 400 m/s and 160 m/s respectively. In these
analytical results, satisfactory accelerating performance of the nozzle is indicated. To elucidate the validity of these analytical results, it is necessary to investigate these flow properties experimentally.
Compared with the sonic velocity defined in this paper, the gas-phase and the liquid-phase velocity is larger. From perspective of the sonic velocity defined in this paper, the flow in the divergent section can be considered as the supersonic flow.
In the case that the tank pressure is set to 8.0 MPa, as shown inFigure 12, general trend is the same as the tank pressure of 7.2 MPa. However, the velocity in the case of the tank pressure of 8.0 MPa is smaller than that of the case of 7.2 MPa despite the larger inlet velocity in the case of 8.0 MPa. As shown in Figure 13 and Figure 14, it can be considered that the higher pressure tank is set, the smaller velocity is calculated.
5. Summary
The flow field of the carbon dioxide high-speed two-phase nozzle flow has been investigated by the experiment and the one-dimensional analysis. Obtained results are as follows.
1) For the nozzle form used in this research and the experimental condition, the CO2 temperature and the
pressure have been significantly and monotonously decreased in the nozzle, and satisfactory accelerating per-formance has been presumed.
2) For the nozzle flow, the one-dimensional analytical model which assumes to be steady, adiabatic, no fric-tion and equilibrium is proposed. In this analytical model, the nozzle convergent secfric-tion is assumed to be single-
z (mm) A/Ain
T/Tin
p / P i n
x
α
ug /uin /100
ul /uin /100
cg /uin /100
cl /uin /100
A/Ain
T/Tin
p/Pin
x
α
ug /uin /100
ul /uin /100
cg /uin /100
cl /uin /100
0 10 20 30 40 50 60 70 80 90
0.1 0.2 0.3 0.4 0.5 0.6 0.7 0.8 0.91 1.1 1.2 1.3 1.4 1.5 1.6 z (mm) A/Ain T/Tin
p / P i n
x
α
ug /uin /100
ul /uin /100
cg /uin /100
cl /uin /100
A/Ain
T/Tin
p/Pin
x
α
ug /uin /100
ul /uin /100
cg /uin /100
cl /uin /100
0 10 20 30 40 50 60 70 80 90
[image:9.595.169.458.275.441.2]phase flow, and the nozzle divergent section is assumed to be separated gas-liquid two-phase flow.
3) The proposed analytical model is simple, and the assumption that the flow is the separated saturated gas- liquid two-phase flow does not necessarily satisfy the actual flow. However, in this experimental condition, these analytical results satisfactorily predicted these experimental results.
4) By the one-dimensional analysis, the velocity distribution in the mainstream direction in the nozzle is ob-tained, and the satisfactory accelerating performance has been indicated. Further, it is made clear that from the perspective of the sonic velocity defined in this analysis the flow in the divergent section can be considered as the supersonic flow.
References
[1] Nakagawa, M. (2004) Refrigeration Cycle with Two-Phase Ejector. Refrigeration, 79, 856-861.
[2] Akagi, S., Dang, C.B. and Hihara, E. (2006) Experimental Research of Two-Phase Ejector in Carbon Dioxide Heat Pump Cycle. Journals of Japan Society of Refrigerating and Air Conditioning Engineers, 23, 97-104.
[3] Nakagawa, M., Takeuchi, H. and Yokozaki, A. (1998) Performance of Two-Phase Nozzles Using the Refrigerant R134a. Transactions of Japan Society of Mechanical Engineers, Series B, 64, 3407-3413.
[4] Nakagawa, M., Takeuchi, H. and Berana, M.S. (2006) Supersonic Characteristics and Shock Waves in Two-Phase Flow along a Nozzle of a Carbon Dioxide Ejector. Proceedings of the 3rd Asian Conference on Refrigeration and Air-Conditioning, 1, 363-367.
[5] Nakagawa, M. and Sugiura, T. (2000) Shock Waves Caused by Velocity Relaxation in High Speed Mist Flow. Trans-actions of Japan Society of Mechanical Engineers, Series B, 66, 1495-1502.
[6] Sugiura, T. and Nakagawa, M. (2001) Shock Waves Caused by the Velocity and Temperature Relaxation of Subsonic Mist Flow in a Nozzle. Transactions of Japan Society of Mechanical Engineers, Series B, 67, 2462-2469.
[7] Sudo, Y. and Katto, Y. (1975) Study of Compressible Two-Phase Critical Flows: 1st Report, Principle of Occurrence of Critical Flow. Transactions of Japan Society of Mechanical Engineers, 41, 624-635.
![CATALYTIC DEHYDRATION OF CASSAVA-DERIVED GLUCOSE INTO 5-HYDROXYMETHYL-FURAN (5-HMF) IN 1-BUTYL-3-METHYLIMIDAZOLIUM CHLORIDE ([BMIM]Cl)](data:image/gif;base64,R0lGODlhAQABAIAAAP///wAAACH5BAEAAAAALAAAAAABAAEAAAICRAEAOw==)