http://dx.doi.org/10.4236/ojf.2015.51011
Genetic Worth Effect Models for Boreal
Conifers and Their Utility When
Integrated into Density Management
Decision-Support Systems
Peter F. Newton
Canadian Wood Fibre Centre, Canadian Forest Service, Natural Resources Canada, Sault Ste. Marie, Canada Email: [email protected]
Received 28 December 2014; accepted 14 January 2015; published 23 January 2015
Copyright © 2015 by author and Scientific Research Publishing Inc.
This work is licensed under the Creative Commons Attribution International License (CC BY). http://creativecommons. org/licenses/by/4. 0/
Abstract
Based on approaches deduced from previous research findings and empirical observations from density control experiments, genetic worth effect response models were developed for black spruce (Picea mariana (Mill) BSP.) and jack pine (Pinus banksiana Lamb.) plantations. The models ac-counted for the increased rate of stand development arising from the planting of genetically-im- proved stock through temporal adjustments to the species-specific site-based mean dominant height-age functions. The models utilized a relative height growth modifier based on known esti-mates of genetic gain. The models also incorporated a phenotypic juvenile age-mature age corre-lation function in order to account for the intrinsic temporal decline in the magnitude of genetic worth effects throughout the rotation. Integrating the functions into algorithmic variants of struc-tural stand density management models produced stand development patterns that were consis-tent with axioms of even-aged stand dynamics.
Keywords
Picea mariana, Pinus banksiana, Structural Stand Density Management Models, Phenotypic Juvenile Age-Mature Age Correlation, Canadian Boreal Forest Region
1. Introduction
reforestation species within the central portion of the Canadian Boreal Forest Region (Rowe, 1972) given their current ecological suitability and commercial importance. In the Province of Ontario, black spruce and jack pine constitute approximately 35% and 12% of the total growing stock, respectively (Watkins, 2011). The nominal silvicultural prescription employed in reforesting upland black spruce and jack pine site types under an intensive or elite management intensity following a stand replacing disturbance, such as clear cut harvesting, includes: 1) mechanical site preparation followed by planting of genetically enhanced stock; 2) controlling inter specific competition via vegetative management treatments during the pre-crown closure stage of development; and 3) density control treatments consisting of commercial thinning treatments in order to reduce mortality losses during the post-crown closure stage of development. Specific treatment decisions regarding initial spacing and thinning treatments for a given site, management intensity and volumetric objec-tive, are commonly determined using stand density management decision-support models (McKinnon et al., 2006).
Recently, however, the complexity of designing optimal crop plans has become more challenging as man-agement strategies attempt to move away from an objective strictly concerned with the maximization of volu-metric yield to one that also addresses end-product quality and value maximization goals (Emmett, 2006). For-tunately, the complexity of such crop planning has been greatly reduced with the advent of structural stand den-sity management models (SSDMMs; Newton, 2009, 2012a). Briefly, SSDMMs are distance-independent di-ameter-distribution yield models that are derived from the modeling platform used to develop stand density management diagrams (SDMDs). Since their inception in Japan in the 1960s (e.g., Ando, 1962, 1968), SDMDs have evolved over time in terms of their complexity and utility: progressing from static (Ando, 1962; Drew & Flewelling, 1979; Archibald & Bowling, 1995) to dynamic (Newton & Weetman (1993, 1994); Stankova & Shibuya (2006)) to structural (Newton et al. (2004, 2005)) models. These ecological-based crop planning tools have been developed for numerous forest tree species throughout the boreal, temperate and tropical forest re-gions (Drew & Flewelling, 1977; Jack & Long, 1996; Newton, 1997). One area where SDMDs have found the greatest affinity is in Japan where regional-specific variants have been developed for most of their commer-cial important and intensely managed coniferous stand types (e.g., Forestry Agency of Japan, 1981a, 1981b; Fu-jimori, 2001).
Commonly, SSDMMs attempt to account for various silvicultural interventions such as thinning and genetic worth effects through adjustments to the underlying driving functions; principally, through the species and site specific mean dominant height-age functions (e.g., Newton, 2012a). These modeling adjustments account for the accelerated rate of stand dynamics that frequently arise from the enhanced growth performance of individual trees following treatment. Conceptually, these approaches belong to the treatment modifier equation class of methodologies use for modeling growth responses to silvicultural treatments (Weiskittel et al., 2011). Cur-rently, however, the genetic worth effect models within the SSDMMs do not account for the expected tem-poral decay of genetic gains over time (sensu Lambeth, 1980). Consequently, in order to improve the predic-tability of SSDMMs and advance genetic worth effect modelling within the context of SDMD-based deci-sion-support systems, the objectives of this study were to introduce a modeling solution for addressing this shortcoming and subsequently integrated it into the SSDMM architecture. The proposed solution follows es-tablished practice and is consistent with previous approaches use to model genetic worth effects (e.g. Xie & Yanchuk, 2003). Operationally-relevant crop planning simulations are used to demonstrate the utility of the re-vised SSDMMs.
2. Material and Methods
2.1. Approach
plantation establishment and continues until the specified selection age, and thereafter dissipates according to an empirical juvenile age-mature age correlation model (Type 2 response). This approach assumes that for a given species, generation, region or seed lot, the genetic worth effect is known in terms of the expected height growth increase and the corresponding selection age. This information is commonly available from the results of previous tree improvement experimentation including interprovincial trials and meta-analytical summaries (e.g., Newton, 2003).
2.2. Model Formulation
The Type 1 response model expresses the genetic worth effect in terms of the percentage increase in dominant
height ( )
( )
d s H A R at the specified selection age (Equation (1)) and then embeds this increase within the
site-specific height-age model.
( )
( )
( )
( )( )
( )( )
( )( )
( )
100
100 s s s 1
d s
s
d A w A d A
H A
d A
H G H
R H + = − (1) where ( )
( )
s w AG and
( )
( )
s d AH are the specified genetic worth effect (%) at the specified selection age (A (s) (yr))
and mean dominant height (m) at A (s) as predicted by site-index-based height-age models (e.g., models devel-oped for upland black spruce by Carmean et al. (2006) and jack pine by Carmean et al. (2001)). This increase is then used to adjust the height-age estimates initiating at A(s) and proceeding to the specified rotation age, ac-cording to the following genetic-based juvenile age-mature age correlation model which was previously devel-oped for Pincaceae (Lambeth, 1980; Equation (2)).
( )
( )
( )
( )(
1.02 0.308log(
( ) ( ))
)
d d s e s i
H A i H A
R =R + A A (2)
where ( ( )) d H A i
R is the relative percentage increase in height growth at the ith age (A(i)).
The Type 2 response model first predicts a backwards predicted gain from the time of establishment to
A(s) according to the specified
( )
( )
d s H AR and the age-age correlation model (Lambeth, 1980; Equation
(3)).
( )
( )
( )
( )(
1.02 0.308log(
( ) ( ))
)
d d s e s i
H A i H A
R =R + A A (3)
Subsequently from the selection age, the increase is thereafter estimated using the juvenile age-mature age correlation relationship (Equation (2)). The Type 1 and 2 response models predict equivalent height growth per-centage gains from the specified selection age until rotation. However, they predict different stand development rates during the early phase of plantation development, specifically, from establishment until the plantation reaches the specified selection age.
2.3. Integration into SSDMMs
( )
( )
( )
( ) ( )( )
( )( )
( ) ( ) ( )( )
( )
( )( )
( ) ( )( )
( ) ( ) ( ) ( )If a Type 1 response model applies then, ˆ ˆ ˆ for
100
ˆ ˆ ˆ 1.02 0.308 log for 100
If a Type 2 response model applies then,
ˆ
d s
i i i
d s
i i i
H A
i s
d A d A d A
H A s
e i s
d A d A d A
i R
H H H A A
R A
H H H A A
A
H
′ = + =
′ = + + >
′ ( )
( )
( )
( )( )
( ) ( )( )
( ) ( ) ( ) ( ) ( )( )
( )
( )( )
( ) ( )( )
( ) ( ) ( ) ( ) 1ˆ ˆ 1.02 0.308 log for 100
ˆ ˆ ˆ 1.02 0.308 log for 100
d s
i i i
d s
i i i
H A s
e i s
d A d A d A
i
H A s
e i s
d A d A d A
i
R A
H H A A
A
R A
H H H A A
A − = + + ≤
′ = + + >
where Hˆd t′( ) is redefined as Hˆd t( ) after each age increment.
3. Results
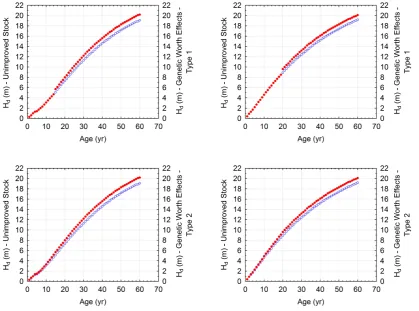
[image:4.595.107.527.357.668.2]The genetic worth effect models for black spruce and jack pine plantations are exemplified inFigure 1 using
Figure 1. Contrasted site-specific dominant height-age curves for black spruce (left hand side) and jack pine (right hand side)
meta-based estimates of genetic gain for a given site quality. Specifically, the modified site-specific mean do-minant height-age relationships arising for both response types are contrasted with that projected for unim-proved stock by species. For an expected genetic gain value of 10% at a selection age of 15 yr for black spruce and 7% at 20 yr for jack pine (Newton, 2003), plantations established on good site qualities (site index of 18 m) and managed to a rotation age of 60 yr, the Type 1 response model would predict a dominant height increase of 10% (from 5.1 to 5.6 m) at age 15 yr for black spruce, and 7% (from 8.9 to 9.6 m) at age 20 yr for jack pine, ac-cording to Equation (1). These relative increases would then decline in a linear pattern acac-cording to the juvenile age-mature age correlation relationship (Equation (2)). Similarly, the predicted genetic worth effect according to the Type 2 response model would result in increased height values from ages 1 to 15 yr for black spruce, and from ages 1 to 20 yr for jack pine (Equation (1)), maximizing at age 15 yr for black spruce and 20 yr for jack pine, according to the specified genetic worth effect and selection age provided. Thereafter the increases would decline according to the juvenile age-mature age correlation relationship (Equation (3)). As expected, the Type 1 and 2 response models predicted equivalent rotational heights (20.2 m and 20.1 m for black spruce and jack pine, respectively), rotational heights were greater for the plantations established using improved stock compared to the plantations composed of unimproved stock (e.g., 6% and 5% for black spruce and jack pine, respectively), and relative height gains dissipated over time from 10% at age 15 yr to 6% at age 60 yr for black spruce, and from 7% at age 20 yr to 5% at age 60 yr for jack pine.
Furthermore, extending these examples within the context of the revised SSDMMs enables one to assess of the differences between the response models in terms of rotational yields and productivity indices. Briefly, the hierarchical-based SSDMMs consisted of 6 sequentially-linked estimation modules (Newton, 2009, 2012a): Module A-Dynamic SDMD; Module B-Diameter and Height Recovery; Module C-Taper Analysis and Log Es-timation; Module D-Biomass and Carbon EsEs-timation; Module E-Product and Value EsEs-timation; and Module F- Fibre Attribute Estimation. Module A is a mathematical representation of a dynamic stand density management diagram and consists of a broad array of static and dynamic yield—density relationships. Module B consists of 1) Weibull-based parameter prediction equation systems for diameter distribution recovery, and 2) composite height-diameter prediction equations for diameter-class-specific height estimation. Module C employs a dimen-sional compatible taper equation to predict log products (number of pulp and saw logs) and stem volumes of in-dividual trees. Module D includes allometric-based composite biomass equations for each above-ground com-ponent (bark, stem, branch and foliage) from which diameter-class and stand-level biomass and associated car-bon-based equivalents are predicted. Module E utilizes sawmill-specific (stud and random length mill) product and value equations to predict diameter-class and stand-level chip and lumber volumes and associated monetary values. Module F contains composite equations for estimating wood density and mean maximum branch diame-ter. A schematic illustration of the structure of the SSDMM including the interrelationships and sequential flow of computations among the individual modules is provided in Newton (2012a). The algorithmic analogue of these SSDMMs was developed so that a set of crop plans could be simultaneously contrasted and assessed em-ploying a comprehensive set of yield outcome metrics and performance measures. These measures included in-dices for quantifying overall productivity, log quality and product distributions, biomass production and carbon yields, quantity and value of recoverable end-products, economic efficiency, duration of optimal site occupancy, structural stability, quality of fibre attributes, and operability status.
product values were used. Reflecting a sawlog management objective in which there is a bias towards the pro-duction of larger but few trees at rotation, the operability targets were set at a piece size and merchantable vo-lume yield threshold of 10 stems/m3 and 200 m3/ha, respectively.
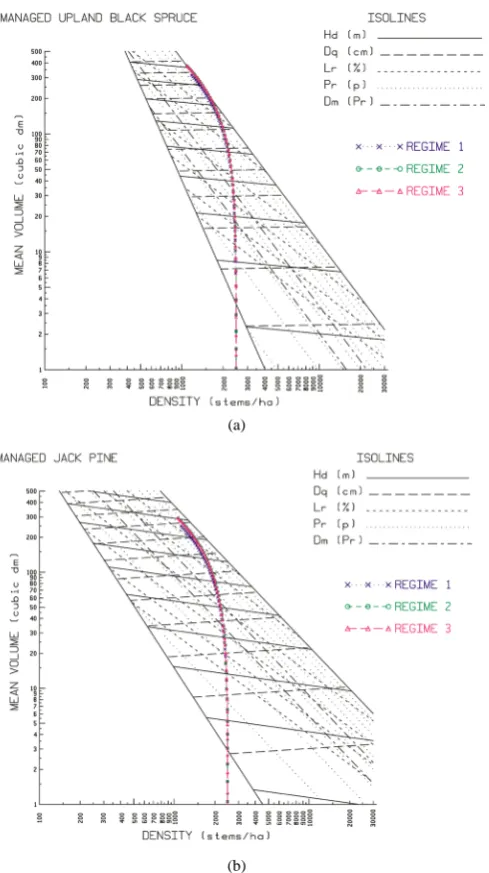
[image:6.595.83.539.336.693.2]The temporal mean volume-density trajectories for these regimes within the context of the traditional SDMD mean volume-density graphic are illustrated inFigure 2(a)for black spruce andFigure 2(b)for jack pine. The plantations composed of genetically enhanced stock (Regimes 2 and 3) attained higher levels of site occupancy irrespective of species or response model type, as evident by their greater mean size-density condition at rotation.
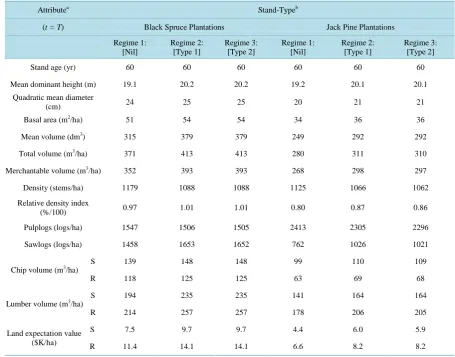
Table 1presents the resultant rotational yield estimates and Table 2 provides the rotational productivity and performance metrics by species for plantations composed of unimproved stock versus those composed of ge-netically improved stock. Contrasting the yield estimates for plantations established with unimproved stock versus those established with genetically enhanced stock, indicated that the plantations established using im-proved stock had 1) greater rotational mean tree sizes (height (6% for black spruce and 5% for jack pine), diameter (4% and 5%) and volume (20% and 17%)), 2) attained higher levels of stocking and site occupancy (basal area (6% and 6%) and relative density index (4% and 8%)), 3) produced greater total volumes (11% and 4%) and merchantable volume (12% and 11%), fewer number of pulplogs (−3% and −5%) but a greater number of sawlogs (13% and 34%), (4) greater recoverable products (chip (6% and 9%) and lumber (21% and 16%)) and higher economic worth (26% and 30%). In terms of performance measures, differences among the regimes indicated that the plantations composed of improved stock were 1) more productive in terms of volume (12%
Table 1. Rotational yield estimates for black spruce and jack pine plantations established using unimproved (Regime 1) and
genetically enhanced (Regimes 2 and 3) stock.
Attributea Stand-Typeb
(t = T) Black Spruce Plantations Jack Pine Plantations
Regime 1: [Nil]
Regime 2: [Type 1]
Regime 3: [Type 2]
Regime 1: [Nil]
Regime 2: [Type 1]
Regime 3: [Type 2]
Stand age (yr) 60 60 60 60 60 60
Mean dominant height (m) 19.1 20.2 20.2 19.2 20.1 20.1
Quadratic mean diameter
(cm) 24 25 25 20 21 21
Basal area (m2/ha) 51 54 54 34 36 36
Mean volume (dm3) 315 379 379 249 292 292
Total volume (m3/ha) 371 413 413 280 311 310
Merchantable volume (m3/ha) 352 393 393 268 298 297
Density (stems/ha) 1179 1088 1088 1125 1066 1062
Relative density index
(%/100) 0.97 1.01 1.01 0.80 0.87 0.86
Pulplogs (logs/ha) 1547 1506 1505 2413 2305 2296
Sawlogs (logs/ha) 1458 1653 1652 762 1026 1021
Chip volume (m3/ha)
S 139 148 148 99 110 109
R 118 125 125 63 69 68
Lumber volume (m3/ha) S 194 235 235 141 164 164
R 214 257 257 178 206 205
Land expectation value ($K/ha)
S 7.5 9.7 9.7 4.4 6.0 5.9
R 11.4 14.1 14.1 6.6 8.2 8.2
a
Merchantable volume specifications: 2.59 m and 5.03 m pulp and sawlog length, respectively, 4 cm merchantable top, 10 cm and 14 cm minimum log diameter for pulp and saw logs, respectively. S and R refer to stud and randomized length mill configurations, respectively. See Newton (2012a)
(a)
[image:7.595.194.439.81.518.2](b)
Figure 2.(a) SDMD graphic for black spruce plantations: (i) isolines for mean dominant height (Hd; solid horizontal lines: 4
m (bottom) - 20 m (top) by 2 m intervals), quadratic mean diameter (Dq; long-dashed horizontal lines; 4 cm (bottom) - 26 cm (top) by 2 cm intervals), mean live crown ratio (Lr; short-dashed diagonal lines; 35% (bottom), 40%, 50%, …, 80% (top)), and relative density index (Pr; dotted diagonal lines; 0.1 - 1.0 by 0.1 intervals); (ii) crown closure line (left-side solid diagonal boundary line) and self-thinning rule at a Pr = 1.0 (right-side solid diagonal boundary line); (iii) lower and upper Pr multi-dashed diagonal lines delineating the optimal density management window (Dm; 0.32 ≤ Pr ≤ 0.45); and (iv) expected 60 year size-density trajectories with 1 year intervals denoted by a vertical line for each of the 3 user-specified crop plans for plantations situated on good quality sites (SI = 18). Specifically: Regime 1—initial planting density of 2500 stems/ha with no thinning employing the null genetic response model; Regime 2—establishment density of 2500 stems/ha with no thinning employing the Type 1 genetic response model; and Regime 3—establishment density of 2500 stems/ha with no thinning em-ploying the Type 2 genetic response model; (b) SDMD graphic for jack pine plantations: (i) isolines for mean dominant height (Hd; solid horizontal lines: 4 m (bottom) - 22 m (top) by 2 m intervals), quadratic mean diameter (Dq; long-dashed horizontal lines; 4 cm (bottom) - 26 cm (top) by 2 cm intervals), mean live crown ratio (Lr; short-dashed diagonal lines; 35% (bottom), 40%, 50%, …, 80% (top)), and relative density index (Pr; dotted diagonal lines; 0.1 - 1.0 by 0.1 intervals); (ii) crown closure line (left-side solid diagonal boundary line) and self-thinning rule at a Pr = 1.0 (right-side solid diagonal boundary line); (iii) lower and upper Pr multi-dashed diagonal lines delineating the optimal density management window (Dm; 0.32 ≤ Pr ≤ 0.45); and (iv) expected 60 year size-density trajectories with 1 year intervals denoted by a vertical line for each of the 3 user-specified crop plans for plantations situated on good quality sites (SI = 18). Regimes specifics follow those
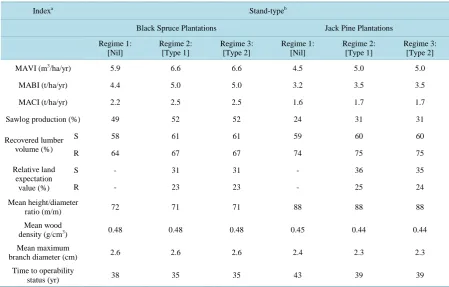
Table 2. Stand-level performance indices for black spruce and jack pine plantations established using unimproved (Regime 1) and genetically enhanced (Regimes 2 and 3) stock.
Indexa Stand-typeb
Black Spruce Plantations Jack Pine Plantations
Regime 1: [Nil]
Regime 2: [Type 1]
Regime 3: [Type 2]
Regime 1: [Nil]
Regime 2: [Type 1]
Regime 3: [Type 2]
MAVI (m3/ha/yr) 5.9 6.6 6.6 4.5 5.0 5.0
MABI (t/ha/yr) 4.4 5.0 5.0 3.2 3.5 3.5
MACI (t/ha/yr) 2.2 2.5 2.5 1.6 1.7 1.7
Sawlog production (%) 49 52 52 24 31 31
Recovered lumber volume (%)
S 58 61 61 59 60 60
R 64 67 67 74 75 75
Relative land expectation
value (%)
S - 31 31 - 36 35
R - 23 23 - 25 24
Mean height/diameter
ratio (m/m) 72 71 71 88 88 88
Mean wood
density (g/cm3) 0.48 0.48 0.48 0.45 0.44 0.44
Mean maximum
branch diameter (cm) 2.6 2.6 2.6 2.4 2.3 2.3
Time to operability
status (yr) 38 35 35 43 39 39
aMAVI, MABI and MACI denote mean annual merchantable volume, biomass and carbon increment, respectively. S and R refer to stud and
rando-mized length mill configurations, respectively. See Newton (2012a) for a complete computational summary of these metrics; bAs described in the text.
and 11%), biomass (14% and 9%), and carbon sequestration (14% and 6%) production, 2) produced a greater proportion of usable end-products (saw logs (6% and 29%) and lumber volume (5% and 2%)), and 3) attained operability status at an earlier age (−8% and −9%). Stand stability (height/diameter ratio), wood density and maximum branch size differences were inconsequential among the regimes for both species.
Comparing the Type 1 and 2 response models revealed that the rotational outcomes were approximately equivalent within each species. This is in accord with expectation given that both response models constrain mean dominant height to be equivalent at the specified selection age and thereafter proceed along approximately identical height-age pathways until rotation. The only real difference relates to the early phase of plantation de-velopment: i.e., from establishment and until the specified selection age is reached. During this period, the Type 2 response model predicts a greater rate of development than does the Type 1 response model given that the ge-netic worth effect initiates at the time of plantation establishment rather than at the specified selection age. Hence, the Type 2 response model attained greater mean dominant heights for each year before the selection age was reached, resulting in a slight increase in the rate of stand development. As a consequence, plantations growing according to the Type 2 response model would attain crown closure status slightly earlier than planta-tions growing according to the Type 1 response model.
4. Discussion
been the most frequently applied. This is principally due to the fact that existing equations which drive the over-all dynamics of growth and yield simulators can be readily modified without the need of new data acquisition, model specification and parameterization initiatives (Weiskittel et al., 2011).
Once the treatment modifier equation method has been selected and the expected effects of the treatments are known in terms of their magnitude, duration and temporal initiation, existing models can be modified accor-dingly. For genetic worth effects, both the Type 1 and 2 response models were included given that genetic gains are long-term in their duration and affect stand dynamics over most or all of the rotation. The presented response models differentiate themselves in this regard: Type 1 is applicable from the specified selection age until rota-tion age whereas the Type 2 is applicable from the time of establishment until rotarota-tion age. However, their ef-fects on stand dynamics achieved equivalence once the selection age is reached. Although temporary and per-manent increases in site quality arising from silvicultural treatments are commonly referred to as Type 1 and 2 response types, respectively (e.g., Snowdon & Waring, 1984), this terminology is used within a rotational con-text, in this study. The treatment equation modification approach has also been used to embedded genetic worth effects within empirical benchmark yield models for coniferous species in central Canada (Penner, 2004) and stand-level growth and yield simulators for black spruce and jack pine in eastern Canada (STAMAN, McInnis & Tosh, 2004), and for conifers in western Canada (Tree and Stand Simulator (TASS); Goudie, 2004).
The new response models when integrated into the algorithmic analogues of the SSDMMs were evaluated on their biological and empirical realism across a wide range of site qualities, initial densities, thinning treatments and rotation ages employing Bakuzis graphical matrices (sensu Leary, 1997). Based on results derived from nested simulations for each response type and species involving 5 site classes (11 - 19 m by 2 m intervals), 5 ro-tational lengths (50, 60, 70, 80 and 90) and 5 initial densities (1500, 2000, 2500, 3000 and 3500 stems/ha) and with and without commercial thinning treatments (35% basal area removal 25 years before rotation), indicated that the predictions from the revised SSDMMs were acceptable given the lack of evidence of consequential de-partures from expectation in terms of accepted stand dynamical theoretical constructs (e.g., Sukatschew’s effect, Eichhorm’s rule, self-thinning theory and yield-density relationships) and yield forecast expectations. Further-more, the resultant stand development patterns consistently indicated an increase in temporal stand dynamics due to genetic worth effects which yielded increased volumetric and end-product outcomes and earlier stand operability status.
The site-based mean dominant height—age functions which largely govern the rate of stand development within most SDMD-based and stand-level growth and yield models, is the logical entry point for incorporating temporal developmental impacts arising from genetic worth effects. This approach is similar to the method uti-lized by Newton (2003) in assessing species-specific meta-based genetic worth effects for conifers in central and eastern Canada, and by Xie & Yanchuk (2003) in terms of integrating genetic worth effects within the Table In-terpolation Program for Stand Yield (TIPSY) growth and yield simulator used in managing conifers in western Canada. A similar modelling approach has been used in quantifying responses to other silvicultural treatments including N-based forest fertilization (Newton & Amponsah, 2007) and chemical and mechanical vegetative management control (Newton, 2012b). However, difference between these earlier efforts and those presented in this study relate to the response model variants considered (Type 1 and 2) and the explicit accounting for the an-ticipated temporal decline in the genetic gain effect over time (Lambeth, 1980), through the use a correla-tive-based dissipation factor.
Plantations established with genetic improved stock for both black spruce and jack pine are relatively young (<30 yrs) and are largely without parental information in terms of genetic gain and selection age specifics. This data information gap negates an empirical assessment of the models in terms of their predictive accuracy. How-ever, the employment of a well accepted approach (treatment modifier equation) using published genetic gain estimates derived from meta-analytical studies combined with a well-established phenotypic juvenile age-mature age correlation function, provides a conceptual basis for acceptance. Furthermore, output from a large number of simulations confirmed that the genetic worth effect models when incorporated into the SSDMM produced stand development patterns consistent with ecological axioms derived from stand dynamic and forest production theo-ries.
superiority (Newton, 2003). Thus other effects, such as altered crown morphology and wood quality impacts which may accompany height growth superiority, are not accounted for in the current approach. Further research is required to determine the effect of these secondary effects on individual tree growth and overall stand dynam-ics before the full extent of genetic worth effects on forest productivity is known with certainty.
5. Conclusion
The analytical approach used to account for the accelerated rate of stand development arising from genetic worth effects was through adjustments to the site-based dominant height-age functions given that these functions govern stand dynamics and structural change within SSDMMs. The presented models are also applicable to past generations of the SDMD-based models and other height-driven growth and yield simulators used in forest management planning. Conceptually, the approach parallels the analytical logic proposed by others for project-ing genetic worth effects and falls within the treatment modifier equation class of modelproject-ing methodology used to quantify responses to silvicultural interventions. The results of this study provide additional support for this approach in that the development of species-specific modified height-age functions and embedding them into stand-level decision support models enabled greater predictive realism in long-term yield forecasts. Although empirical predictive ability was not explicitly addressed, the revised models predicted stand development pat-terns that were consistent with axioms of even-aged stand development.
References
Ando, T. (1962). Growth Analysis on the Natural Stands of Japanese Red Pine (Pinus densiflora Sieb. et. Zucc.). II. Analysis of Stand Density and Growth (in Japanese; English Summary). Bulletin of the Government Forest Experiment Station, 147,
1-77.
Ando, T. (1968). Ecological Studies on the Stand Density Control in Even-Aged Pure Stand. Bulletin of the Government
Forest Experiment Station, 210, 1-152.
Archibald, D. J., & Bowling, C. (1995). Jack Pine Density Management Diagram for Boreal Ontario. Northeast and North-west Science & Technology: Ontario Ministry of Natural Resources.
Carmean, W. H., Hazenberg, G., & Deschamps, K. C. (2006). Polymorphic Site Index Curves for Black Spruce and Trem-bling Aspen in Northwest Ontario. Forestry Chronicle, 82, 231-242. http://dx.doi.org/10.5558/tfc82231-2
Carmean, W. H., Niznowski, G. P., & Hazenberg, G. (2001). Polymorphic Site Index Curves for Jack Pine in Northern On-tario. Forestry Chronicle, 77, 141-150. http://dx.doi.org/10.5558/tfc77141-1
Drew, T. J., & Flewelling, J. W. (1977). Some Recent Japanese Theories of Yield-Density Relationships and Their Applica-tion to Monterey Pine PlantaApplica-tions. Forest Science, 23, 517-534.
Drew, T. J., & Flewelling, J. W. (1979). Stand Density Management: An Alternative Approach and Its Application to Doug-las-Fir Plantations. Forest Science, 25, 518-532.
Emmett, B. (2006). Increasing the Value of Our Forest. Forestry Chronicle, 82, 3-4. http://dx.doi.org/10.5558/tfc82003-1
Forestry Agency of Japan (1981a). Manual of Stand Density Control Diagram for Sugi Plantations. Tokyo: Japan Forest Technology Association.
Forestry Agency of Japan (1981b). Manual of Stand Density Control Diagram for Hinoki Plantations. Tokyo: Japan Forest Technology Association.
Fujimori, T. (2001). Ecological and Silvicultural Strategies for Sustainable Forest Management. Amsterdam: Elsevier Science Publishers B. V.
Goudie, J. (2004). Integration of Genetics into Growth Models: State of the Art in BC. Proceedings of the Genetics and
Growth Modeling Workshop, Corvallis, 4-6 November 2003, 95-110.
Jack, S. B., & Long, J. N. (1996). Linkages between Silviculture and Ecology: An Analysis of Density Management Dia-grams. Forest Ecology and Management, 86, 205-220. http://dx.doi.org/10.1016/S0378-1127(96)03770-X
Lambeth, C. M. (1980). Juvenile-Mature Correlations in Pincaceae and Implications for Early Selection. Forest Science, 26,
571-580.
Leary, R. A. (1997). Testing Models of Unthinned Red Pine Plantation Dynamics Using a Modified Bakuzis Matrix of Stand Properties. Ecological Modelling, 98, 35-46. http://dx.doi.org/10.1016/S0304-3800(96)01935-7
McInnis, B., & Tosh, K. (2004). Genetic Gains from 20 Years of Cooperative Tree Improvement in New Brunswick.
For-estry Chronicle, 80, 127-133. http://dx.doi.org/10.5558/tfc80127-1
Sin-gle-Species Stands of Jack Pine, White Spruce, and Black Spruce in Ontario. Northeast Science and Information Section: Ontario Ministry of Natural Resources, Report TR-046.
Newton, P. F. (1997). Stand Density Management Diagrams: Review of Their Development and Utility in Stand-Level Management Planning. Forest Ecology and Management, 98, 251-265. http://dx.doi.org/10.1016/S0378-1127(97)00086-8
Newton, P. F. (2003). Systematic Review of Yield Responses of Four North American Conifers to Forest Tree Improvement Practices. Forest Ecology and Management, 172, 29-51. http://dx.doi.org/10.1016/S0378-1127(02)00327-4
Newton, P. F. (2009). Development of an Integrated Decision-Support Model for Density Management within Jack Pine Stand-Types. Ecological Modelling, 220, 3301-3324. http://dx.doi.org/10.1016/j.ecolmodel.2009.07.025
Newton, P. F. (2012a). A Decision-Support System for Density Management within Upland Black Spruce Stand-Types.
En-vironmental Modelling and Software, 35, 171-187. http://dx.doi.org/10.1016/j.envsoft.2012.02.019
Newton, P. F. (2012b). Yield Responses of Black Spruce to Forest Vegetation Management Treatments: Initial Responses and Rotational Projections. International Journal of Forestry Research, 2, 1-15. http://dx.doi.org/10.1155/2012/150157
Newton, P. F., & Amponsah, I. G. (2007). Systematic Review of Short-Term Growth Responses of Semi-Mature Black Spruce and Jack Pine Stands to Nitrogen-Based Fertilization Treatments. Forest Ecology and Management, 237, 1-14.
http://dx.doi.org/10.1016/j.foreco.2006.10.009
Newton, P. F., & Weetman, G. F. (1993). Stand Density Management Diagrams and Their Utility in Black Spruce Manage-ment. Forestry Chronicle, 69, 421-430. http://dx.doi.org/10.5558/tfc69421-4
Newton, P. F., & Weetman, G. F. (1994). Stand Density Management Diagram for Managed Black Spruce Stands. Forestry
Chronicle, 70, 65-74. http://dx.doi.org/10.5558/tfc70065-1
Newton, P. F., Lei, Y., & Zhang, S. Y. (2004). A Parameter Recovery Model for Estimating Black Spruce Diameter Distri-butions within the Context of a Stand Density Management Diagram. Forestry Chronicle, 80, 349-358.
http://dx.doi.org/10.5558/tfc80349-3
Newton, P. F., Lei, Y., & Zhang, S. Y. (2005). Stand-Level Diameter Distribution Yield Model for Black Spruce Plantations.
Forest Ecology and Management, 209, 181-192. http://dx.doi.org/10.1016/j.foreco.2005.01.020
Penner, M. (2004). Development of Empirical Yield Curves for the PJ1, SP1, SB1, PO1, and SF1 Standard Forest Units.
http://www. forestresearch.ca/Projects/fibre/YC-PJ1-SP1-SB1-PO1-SF1.pdf
Rowe, J. S. (1972). Forest Regions of Canada. Ottawa: Government of Canada, Department of Environment, Canadian For-estry Service.
Snowdon, P., & Waring, H. D. (1984). Long-Term Nature of Growth Responses Obtained to Fertilizer and Weed Control Applied at Planting and Their Consequences for Forest Management. Proceedings of the IUFRO Symposium on Site and
Productivity of Fast Growing Plantations, Pretoria and Pietermaritzberg, 30 April-11 May 1984, 701-711.
Stankova, T. V., & Shibuya, M. (2006). Stand Density Control Diagrams for Scots Pine and Austrian Black Pine Plantations in Bulgaria. New Forests, 34, 123-141. http://dx.doi.org/10.1007/s11056-007-9043-x
Watkins, L. (2011). The Forest Resources of Ontario 2011.
http://www.web2.mnr.gov.on.ca/mnr/forests/public/publications/FRO_2011/forestresources_2011.pdf
Weiskittel, A. R., Hann, D. W., Kershaw Jr., J. A., & Vanclay, J. K. (2011). Forest Growth and Yield Modeling. Oxford: John Wiley & Sons. http://dx.doi.org/10.1002/9781119998518