www.hydrol-earth-syst-sci.net/20/39/2016/ doi:10.5194/hess-20-39-2016
© Author(s) 2016. CC Attribution 3.0 License.
Accelerated gravity testing of aquitard core permeability and
implications at formation and regional scale
W. A. Timms1,2, R. Crane2,3, D. J. Anderson3, S. Bouzalakos1,2, M. Whelan1,2, D. McGeeney2,3, P. F. Rahman3, and R. I. Acworth2,3
1School of Mining Engineering, University of New South Wales, Sydney, Australia
2UNSW Connected Waters Initiative affiliated with the National Centre for Groundwater Research and Training,
Sydney, Australia
3Water Research Laboratory, School of Civil and Environmental Engineering, University of New South Wales,
Sydney, Australia
Correspondence to: W. A. Timms ([email protected])
Received: 11 November 2014 – Published in Hydrol. Earth Syst. Sci. Discuss.: 9 March 2015 Revised: 20 October 2015 – Accepted: 12 November 2015 – Published: 15 January 2016
Abstract. Evaluating the possibility of leakage through low-permeability geological strata is critically important for sus-tainable water supplies, the extraction of fuels from coal and other strata, and the confinement of waste within the earth. The current work demonstrates that relatively rapid and real-istic vertical hydraulic conductivity (Kv) measurements of aquitard cores using accelerated gravity can constrain and compliment larger-scale assessments of hydraulic connectiv-ity. Steady-state fluid velocity through a low-Kporous sam-ple is linearly related to accelerated gravity (glevel) in a cen-trifuge permeameter (CP) unless consolidation or geochemi-cal reactions occur. A CP module was custom designed to fit a standard 2 m diameter geotechnical centrifuge (550g max-imum) with a capacity for sample dimensions up to 100 mm diameter and 200 mm length, and a total stress of ∼2 MPa at the base of the core. Formation fluids were used as influent to limit any shrink–swell phenomena, which may alter the per-meability.Kvresults from CP testing of minimally disturbed cores from three sites within a clayey-silt formation varied from 10−10to 10−7m s−1(number of samples,n=18). Ad-ditional tests were focussed on the Cattle Lane (CL) site, whereKv within the 99 % confidence interval (n=9) was 1.1×10⁻⁹to 2.0×10⁻⁹m s−1. TheseK
vresults were very similar to an independent in situ Kv method based on pore pressure propagation though the sequence. However, there was less certainty at two other core sites due to limited and variableKv data. Blind standard 1g column tests underes-timated Kv compared to CP and in situ Kv data, possibly
due to deionised water interactions with clay, and were more time-consuming than CP tests. OurKv results were com-pared with the set-up of a flow model for the region, and considered in the context of heterogeneity and preferential flow paths at site and formation scale. Reasonable assess-ments of leakage and solute transport through aquitards over multi-decadal timescales can be achieved by accelerated core testing together with complimentary hydrogeological moni-toring, analysis, and modelling.
1 Introduction
Clay or other low-permeability sediment and rock often dominate sedimentary sequences and can form important aquitards (Potter et al., 1980). These hydraulic barriers often overlie aquifers that yield strategically important fresh wa-ter resources and form important cap rocks or seals between shallow aquifers and deeper strata targeted for depressurisa-tion during gas or mineral extracdepressurisa-tion (Timms et al., 2012). The current work compares the results of steady-state cen-trifuge permeability testing of semi-consolidated drill core samples with column tests at standard gravity (1gat earth’s surface, 9.8065 m s−2). Results of laboratory tests were also compared with in situ permeability, based on analysis of pore pressure propagation at formation scale.
confine-ment and disposal (including high-level radioactive waste and the sequestration of carbon dioxide and saline effluents) and act as protective covers for regional aquifers (Cherry et al., 2004). Effective shale and claystone flow barriers are re-quired to disconnect shallow aquifer systems from underly-ing coal seams that are depressurised to produce gas (Timms et al., 2012; APLNG, 2013). Fine-grained geologic media are also commonly used as engineered barriers to limit hor-izontal seepage of mine water (Bouzalakos et al., 2014), for containment of tailings (Znidarˇci´c et al., 2011), and disposal of municipal refuse and nuclear waste (Rowe et al., 1995). Low-permeability material is defined byKof < 10−8m s−1 (Neuzil, 1986). The US EPA requires low-permeability waste barriers for hazardous waste landfills withKof < 10−9m s−1 (US EPA, 1989).
Aquitards volumetrically constitute the bulk of sedimen-tary geologic deposits (Potter et al., 1980), and are typically assumed saturated if located below a water table (Cherry et al., 2004). Water-saturated K and diffusion coefficients for aquitards are therefore not applicable to variably saturated or non-water-saturated low-permeability strata. Research is lacking for semi-consolidated clayey aquitards (e.g. alluvial, colluvial, and aeolian deposits), compared with aquitard re-search on glacial tills (Grisak and Cherry, 1975), claystones (Smith et al., 2013; Jougnot et al., 2010), and shale (Neuzil, 1994; Josh et al., 2012). Clay-bearing sediments formed via alluvial, colluvial, and aeolian processes frequently occur in the geosphere. For example clayey-silt aquitards account for 60 % of the∼100 m thick alluvial sediment sequences in the Mooki catchment of Australia’s Murray–Darling Basin (Far-ley, 2011). The relative lack of information on the dominant type of sedimentary deposit represents a key gap in the cur-rent theoretical understanding of clay mineralogy and geo-chemistry.
Aquitard research on alluvial sediments is important be-cause recharge by slow seepage provides essential ground-water supplies for municipal ground-water supply and crop irrigation in relatively dry inland settings (Acworth and Timms, 2009). Increased effective stress associated with aquifer drawdown for irrigation, may release saline water stored within shal-low aquitards with implications for the continuation of high yields of fresh water. Characterising the effects of variable chemical composition of formation water on the hydraulic conductivity of such sediments is therefore essential to de-termine the long-term changes to fresh water.
As an example, revised calculation of hydraulic parame-ters based on water level recovery from a bore pump test in glacial till (K=10−11m s−1) has been required to im-prove the fit with the data emerging over ∼30 years (van der Kamp, 2011). Various field and laboratory methods are available to directly measure or indirectly calculate hydraulic conductivity along the horizontal (Kh)or vertical (Kv), and saturated and unsaturated or multi-phase flow (e.g. liquid and gas). Obtaining realistic measurements of groundwater flow and solute transport within aquitards is by definition a slow
process, requiring relatively time-consuming and expensive field and/or laboratory studies.
Methods for measuring the in situ permeability of clay formations include: slug tests (piezometer tests, falling-head tests), aquifer pumping tests with piezometers in the aquitard, aquifer pumping tests with observation wells in the aquifer only, measurement of seasonal fluctuations of pore pressure, measurement of pore pressure changes and settlement due to surface loading, and numerical analysis of local and re-gional groundwater flow (van der Kamp, 2001). Neuman and Witherspoon (1968) developed generic analytical solutions for drawdown within an aquiclude, in which vertical flow oc-curs, but is sufficiently small to have no effect on water levels within an overlying or underlying aquifer. Type curves were presented for analytical solutions applying to an infinitely thick and a finite thickness aquiclude. In contrast, analysis of a leaky aquitard–aquifer system was presented by Neu-man and Witherspoon (1972). The ratio method compares drawdown within an aquitard with drawdown in an underly-ing aquifer from which extraction was occurrunderly-ing. Drawdown data are then used to calculate hydraulic diffusion of pres-sure transients, andKv, assuming a uniform, homogeneous aquitard.
Deconvolution of the pressure response to depth through an aquitard can be analysed with a Fourier transform or har-monic analysis (Boldt-Leppin and Hendry, 2003). The hy-draulic diffusivity (hyhy-draulic conductivity divided by specific storage) is expressed analytically, either based on the ampli-tude or phase shift of harmonic signals, assuming that the thickness of the aquitard is semi-infinite. Jiang et al. (2013) further developed the harmonic analysis method for finite aquitards in a multi-layer system in the instance of wa-ter level monitoring within aquifers above and below an aquitard, but not monitoring within the aquitard. Coherence analysis of water level fluctuations in bounding aquifers from indeterminate stresses (e.g. pumping, recharge, rainfall or earthquake) was used to deriveKvfor deep rock aquitards on the basis of interpolated groundwater level data measured at irregular intervals of at least 10 days over a duration of several decades.
A more direct method of determining in situ hydraulic pa-rameters is possible using fully grouted vibrating wire trans-ducers and high-frequency data recording within deep for-mations, as recently demonstrated by Smith et al. (2013) for a bedrock claystone at up to 325 m below ground (BG). Pore pressure and barometric pressure were recorded at 30 min in-tervals and analysed, assuming no leakage in the grouted sys-tem, for barometric response, earth tides, and rainfall events. Core samples from the same drill holes were vacuum sealed on site for consolidation testing and triaxial permeameter testing. The in situ compressibility and specific storage cal-culated from barometric pressure responses were as much as an order of magnitude smaller than laboratory results.
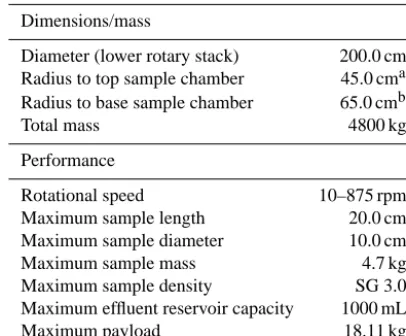
Table 1. Specifications and performance details of the
Broad-bent GT-18 centrifuge permeameter (CP) system as constructed by Broadbent (2011).
Dimensions/mass
Diameter (lower rotary stack) 200.0 cm Radius to top sample chamber 45.0 cma Radius to base sample chamber 65.0 cmb
Total mass 4800 kg
Performance
Rotational speed 10–875 rpm
Maximum sample length 20.0 cm
Maximum sample diameter 10.0 cm
Maximum sample mass 4.7 kg
Maximum sample density SG 3.0
Maximum effluent reservoir capacity 1000 mL
Maximum payload 18.11 kg
a385 G at 875 rpm;b556 G at 875 rpm.
depend on factors such as the preparation and size of core samples, configuration of equipment and uncertainties of measurement, the influent water that is used and the stresses that are applied relative to in situ values, and whether perme-ability is directly measured from steady-state flow, or sub-ject to additional parameters and assumptions with alterna-tive flow regimes. Laboratory testing of clayey-silt cores by standard rigid and flexible wall column techniques requires 1–2 weeks, compared with < 1 week for centrifuge perme-ameter (CP) methods in unsaturated samples (ASTM, 2010). Constant or falling-head tests in rigid-walled column per-meameters at natural gravity require a large water pressure gradient and/or long testing times for low-permeability sam-ples. They are subject to potential leakage, and may not repli-cate in situ confining stresses. Column testing of core sam-ples is possible for some test conditions in triaxial cells on both Kh and Kv, for example those used in geotechnical and petroleum studies (Wright et al., 2002). However, stan-dard practice for testing ultra-low-permeability cores (e.g. Kv<1×10⁻¹⁰m s−1)typically consists of applying a con-fining pressure to a watertight system and measuring small transient pore pressures with high-resolution pressure trans-ducers (API, 1998).
Geotechnical centrifuges are used to subject porous sam-ples to high artificial gravities in order to characterise their hydraulic and/or consolidation properties (Conca and Wright, 1998; Nakajima and Stadler, 2006; Znidarˇci´c et al., 2011), and for physical modelling as part of geotechnical de-sign (Garnier et al., 2007; Parks et al., 2012). Accelerated gravity acts on both the solid particles and fluids within the porous sample without use of a large fluid pressure gradi-ent to drive flow. The technique can be applied to investigate slow hydrogeological processes over shorter timescales; i.e. flow through low-permeability layers that would take
sev-eral years under in situ conditions can be reproduced in a geotechnical centrifuge within hours or days, depending on test conditions.
A CP, or a column mounted on a centrifuge strong box, is commonly used for hydraulic characterisation of porous me-dia. Accelerated gravity achieves a steady-state equilibrium for fluid flow through the CP within hours or days of instru-ment operation (for an unsaturated sample), while simulta-neously applying stresses to the solid matrix. A permeameter column, mounted on a geotechnical centrifuge is rotated suf-ficiently fast to accelerate flow and approximate in situ total stresses, while the targetg level is designed to ensure that the matrix is not consolidated and chemical equilibrium is maintained. Steady-state flow can provide more reasonable Kresults than transient flow techniques. Although transient tests are even more rapid than steady-state tests in the cen-trifuge, more complex instrumentation is required to ensure reliable results (Zornberg and McCartney, 2010).
The geotechnical centrifuge system described in this pa-per is moderately sized and relatively economical to opa-perate, whilst able to perform both unsaturated and saturated testing of porous media with real-time measurement of various pa-rameters during flight (Table 1). These attributes mean that CP testing of relatively large diameter cores (up to 100 mm diameter) in this facility is comparable in cost to testing of small cores (38 mm diameter) using alternative methods such as He-gas permeation. The system has been success-fully used for testing low-permeability rock cores (Bouza-lakos et al., 2013; Jiang et al., 2015). To date, there were no other directKvmeasurements on these deep shales available (APLNG, 2013) and alternative laboratory methods were not successful in obtaining aKv value from these very low-K rocks (Bouzalakos et al., 2013).
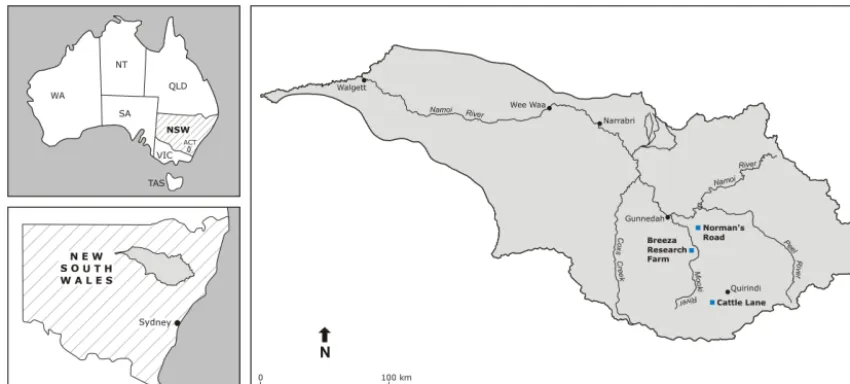
Figure 1. Location of study sites in eastern Australia, state of New South Wales (NSW). The Norman’s Road (NR), Breeza Farm (BF) and
Cattle Lane (CL) sites are shown within the Namoi catchment.
2 Geology of study sites
Semi-consolidated sediment cores were obtained from three sites in the Australia Murray–Darling Basin, in the Up-per Mooki subcatchment of the Namoi catchment (Fig. 1). Groundwater is extracted in this area for irrigation and town water supplies, with drawdowns of more than 10 m over 30 years. It can take years or decades for changing pore pres-sures to be transmitted through these mixed sediments that are heterogeneous, even though the effects of groundwater extraction were assumed to occur rapidly within homoge-neous, high-permeability sediments (Kelly et al., 2013). The alluvial sedimentary geology of the valley features signifi-cant heterogeneity but a general fining upwards that reflects climatic drivers of sedimentation (Kelly et al., 2014). This study found that the architectural features and the net (sand and gravel) to gross (total volume) line plot that identifies low-permeability clays and silts of the valley-filling sequence are best represented by a distributive fluvial system. In this type of fluvial system, the avulsion frequency increases at a slower rate than the aggradation rate.
Core drilling was completed at three research sites (Fig. 1) including Cattle Lane (CL), located south of the town of Caroona (31◦310900S, 150◦280700E), the Breeza farm (BF) operated by the New South Wales (NSW) Department of Primary Industries, south-east of Gunnedah (31◦1003200S,
150◦2501500E), and Norman’s Road (NR), east-southeast of
Gunnedah (31◦204800S, 150◦260700E).
Clayey-silt sediments at the Cattle Lane site are approx-imately 30 m thick (Timms and Acworth, 2005) and ex-tend throughout the valley (Wiesner and Acworth, 1999), as shown by numerous CCPT (conductivity cone penetrometer) profiles. The porewater salinity profile at the site, increas-ing from 10 to 30 m depth through the clay, is consistent
with a diffusion dominated transport over thousands of years (Timms and Acworth, 2006). The saturated zone fluctuates in response to rainfall events between the ground surface and approximately 2 m depth, while water levels in the confined gravel aquifer at > 50 m depth display a delayed and damp-ened response to the same rainfall events. There is no ground-water extraction for irrigation from this aquifer in the vicinity of the site, and the valley has been artificially drained to pre-vent ponding of surface water and soil salinisation. Detailed geological studies and particle dating have identified that the clayey silt in the top∼30 m at this site accumulated grad-ually at 0.2–0.3 mm year−1 by weathering of alkali basalts (Acworth et al., 2015). Flow testing of 100 mm diameter cores from the CL site, reported by Crane et al. (2015) has revealed evidence for dual porosity flow when a hydraulic gradient is imposed on the low-permeability sediments, with further work in progress to identify the nature and signifi-cance of these potential flow paths.
3 Study site characterisation and sampling 3.1 Drilling and core sampling
Equipment and procedures for coring were compliant with ASTM D1587-08 (2008a) to obtain samples that were as undisturbed as possible. A rotary drilling rig equipped with Triefus triple core barrels, lined with seamless clear PET, was used in push coring mode. Local creek water was used as a drilling fluid and casing was used to stabilise the hole behind the push core barrel such that drilling fluid additives were not required. The holes were therefore fully cased to the maxi-mum depth of push core drilling at up to 40 m BG.
The non-rotating core barrel was forced into the formation, whilst a rotating device on the outside of the tube removes the cuttings as the barrel was advanced. The cutting edge of the non-rotating sample tube projects several millimetres beyond the rotary cutters. The thin-walled core barrel complied with the standard for undisturbed sampling, with an area ratio of less than 25 % for an open-drive sampler. The area ratio of 16 % was based on a core barrel design with an external di-ameter of 110 mm and internal didi-ameter of 101 mm (C size). The 1.5 m length core barrel was a composite open sampling system with a core nose screwed onto the base with a bev-elled end to cut the core as the barrel pushed into the for-mation. After the core was extracted from the ground, an air supply was connected to the top of the core barrel to slide the core out of the barrel whilst it remained in the clear PET liner without rotation, distortion, or compression.
The cores contained within PET liners were transferred di-rectly from the core barrels to a cool room on site, and thence to a laboratory cool room, reducing the potential for moisture loss. Semi-consolidated clay cores were selected from below the saturated zone for CP tests, at depths up to 40 m BG. Sediment core samples of lengths between 50 and 100 mm were prepared for CP testing. The moisture content and bulk density of cores was measured using methods adapted from ASTM D7263-09 (2009). These measurements were com-pleted immediately on the drill site.
The preferred method for preservation of drill core was double plastic bagging of sections of core within their PET liners using a food grade plastic sealing system (with brief application of a vacuum to extract air from the plastic bag). Alternatively, core within PET core barrel liners were trimmed of air or fluid filled excess liner immediately after drilling, and then sealed with plastic tape. All cores were stored at 4◦C in a portable cool room on the drill site and
then at the laboratory. Sections of cores, particularly at the nose end, that appeared to be damaged or disturbed were ex-cluded from permeability or bulk density testing. Additional steps that were taken in the laboratory to ensure core test-ing was representative of in situ conditions are described in Sect. 4.1.
After coring, the holes were completed as monitoring piezometers and the casing was jacked out. The piezometers
were constructed of screwed sections of 50 mm PVC cas-ing with O-rcas-ing seals, with a 1.5 m machine slotted screen packed with pea-sized washed gravel. The annulus was then filled with a bentonite seal, backfilled to the surface and com-pleted with a steel casing monument and cement monument pad.
3.2 Groundwater sampling for influent
Fluid forK testing (influent) should be taken from the for-mation at the same depth as the core. Forfor-mation water can be synthesised if it is not possible to sample directly from aquitard strata, by estimating the ionic strength, Na/Ca ra-tio, and pH. In this study, groundwater from piezometers at a similar depth to the core was obtained using standard ground-water quality sampling techniques (Sundaram et al., 2009). A 240 V electric submersible pump (GRUNDFOS MP1) and a surface flow cell were used to obtain representative sam-ples after purging stagnant water to achieve constant field measurements of electrical conductivity and other parame-ters (Acworth et al., 2015 and unpublished data).
4 Centrifuge permeameter methods and calculations 4.1 Preparation of cores
To ensure that cores were tested under saturated realistic con-ditions, drill cores were adequately preserved, stored, pre-pared, and set on a vacuum plate prior to centrifuge testing. Cores from PET drill core liners were trimmed and inserted into an acrylic liner for the CP using a core extruder. The custom made core extruder had five precision cutting blades driven by a motorised piston suitable for a 100 mm diameter core. Cores for CP testing in this study were 100 mm diam-eter C size core, with a length of 50–100 mm. A close fit between the clay core and the liner was achieved using this extruder.
A vacuum plate system for core samples was designed to ensure fully saturated cores, remove air at the base of the core, and ensure an effective seal between the CP liner prior to testing at accelerated gravity. The vacuum plate device was designed to fit the CP liners containing the cores, drawing ponded influent from the top to the base of the cores using a standard laboratory vacuum pump at 100 kPa of negative pressure. After 12–48 h, or upon effluent flow from the base, the acrylic liners containing the prepared cores were then transferred directly to the CP module without disturbing the sample.
content was not affected by the use of a vacuum to expel air from sealing bags or from the top or base of the cores fitted into the CP liners.
A self-seal was observed forming from material swelling at the interface with the liner within minutes of introducing the influent solution. Prior to the self-seal development, leak-age along the liner interface was identified by a flow rate of several orders of magnitude higher than the steady-state flow Kvvalue. The swelling that occurred to self-seal the core was estimated at less than 0.02 % of the cross sectional area of the core by comparing flow rates through the CP drainage hole (described in Sect. S3 in the Supplement). It was calculated that this area of swelling was sufficient to seal an annulus aperture of∼0.01 mm between the clay core and the acrylic liner.
Given the relatively shallow depth of these cores, and the semi-consolidated status, the maximum glevel in the cen-trifuge was limited to prevent structural changes in the core matrix. To minimise changes in porosity of the core during testing, the g level and the weight of ponded fluid on the cores were therefore designed to ensure that total stress was less than estimated in situ stress at the depth from which the core was drilled.
Blind permeability tests were carried out by an inde-pendent laboratory, which adapted a constant/falling-head method (AS 1289 6.7.3/5.1.1, 1991) with methods from Head (1988). For these 1g column tests, a sample diame-ter of 45.1 mm and length 61.83 mm was used, and a con-fining pressure of 150 kPa and back pressure of 50 kPa was applied, providing a vertical uniaxial stress of 100 kPa. The test time was up to 100 h. These standard 1gcolumn tests used deionised water as the influent.
4.2 Centrifuge permeameter testing
The Broadbent CP module and some unique systems devel-oped as part of this study are described in this section, with further details in Sects. S1 and S3. A conceptual plan of a CP is shown in Fig. 2. The CP contains a cylindrical clay sample with lengthLand diameterD, and is spinning in a centrifuge around a central axis at an angular velocityω. The perme-ameter has an inlet face at a radiusr, and a drainage plate at a radius ofr0. The co-ordinatezis defined as positive from the base of the sample towards the central axis of rotation, consistent with definitions in 1gcolumn testing (McCartney and Zornberg, 2010). This frame of reference is in an oppo-site direction to that defined by Nimmo and Mello (1991), but is convenient for interpretation and comparison of col-umn flow tests.
[image:6.612.310.520.66.351.2]Influent was fed from burettes located next to the cen-trifuge via a pair of custom designed low voltage peristaltic pumps mounted either on the centrifuge beam, or outside the centrifuge and through the low flow rotary union. In this study, the outlet face was a free drainage boundary, and is discussed further in Sects. S2 and S3.
Figure 2. Cross sectional diagram of a core sample subjected to
centrifugal force, with a free drainage boundary condition at the base of the core.
TheK value is based on flow rate, flow area, radius, and revolutions per minute (RPM), although the method was adapted from a unsaturated/saturated flow apparatus (UFA) centrifuge to this CP system (Sect. 4.3). Importantly, both testing systems are for steady-state flow with free drainage due to zero pressure at the base of the core.
consid-ered as a steady-state flow condition. This protocol provided additional quantitative measures to the ASTM D7664 (2010), which states that steady-state conditions have been attained “if the outflow is approximately equal to the inflow”. Sec-tion S4 discusses the uncertainty of the measured data in more detail.
4.3 Kvcalculations and statistical analysis
Hydraulic conductivity calculations for the CP in this study were based on ASTM D6527 (2008b) and ASTM D7664 (2010) with a form of Darcy’s Law that incorporates the additional driving force within a centrifuge. The gradi-ent in the cgradi-entrifuge elevation potgradi-ential (Nimmo and Mello, 1991), or the gradient in centrifuge “elevation head” (Zorn-berg and McCartney, 2010) due to the centrifuge inertial force driving was defined as flow away from the centre of rotation (or in the opposite direction to zin Fig. 2). The g level was defined at the mid-point of the core. A ponded in-fluent above the top of the core prevented loss of saturation along the core (Nimmo and Mello, 1991). The centrifuge in-ertial (elevation) head gradient and hydraulic head gradient (stationary centrifuge at 1g) were calculated at 0.005 m in-crements through the core.
Statistical analysis of the data followed a basic small-sampling theory using the Student’stdistribution, following the approach of Gill et al. (2005) and extending the approach of Timms and Anderson (2015) for estimating sample num-bers required for CP testing. Upper and lower confidence in-tervals (UCI, LCI) were calculated from the mean±t(n−1).
sn/n1/2, wheresnis the sample standard deviation andt(n−1)
is the value of the Student’stdistribution at the selected con-fidence limits (CL) of 90 and 99 %. The concon-fidence inter-vals were calculated for the increasing number (n) ofKvdata from each core.
4.4 Fluid pressure and total stress calculations
Fluid pressures and hydraulic gradient through the centrifuge core were determined following the approach of Nimmo and Mello (1991). The total fluid pressureP (kPa) was calculated in Eq. (1)
P =ρw r0
Z
r0
rω2dr , (1)
assuming a fluid density ρw of 1.0 g cm−3 and where r is
the radius of rotation (cm), and ω is the angular velocity (s−1). The total stress S (kPa) was determined through the centrifuge core, following Eq. (2)
S=ρs r0
Z
r0
[image:7.612.313.546.61.353.2]rω2dr , (2)
Figure 3. Centrifuge permeameter testing at low stresses of a
semi-consolidated clayey-silt core sample (CL 26.1 m depth; Test 39-1) showing variation ofglevel,Kv, and influent and effluent flow rate during the test (after Timms et al., 2014).
assuming core bulk densityρsof 1.9 g cm−3. The total stress
and fluid pressure were calculated at 0.005 m increments through the core. The effective stress was then calculated as the difference between total stress and fluid pressure. An in-crease in effective stress associated with dein-creased fluid pres-sures near the base of the free draining core may cause con-solidation of the core matrix near the boundary.
The total stress applied to the core, relative to stress, may affect the porosity of the core sample, depending on the stress history. In situ stress of the cores (Si)at the sampling depth
below ground (D)was calculated using Eq. (3)
Si=ρsDg . (3)
It was assumed that the overlaying formations were fully saturated and of a similar bulk density to the supplied core samples.
5 Results and discussion
Table 2. Core descriptions and index properties.
Core ID BF C2.8 BF C2.16 and C2.15 CL C4.8a CL C4.20a NR C3.23
Depth (m BG) 11.00–11.35/ 22.50–22.90/ 11.27–11.47 28.50–28.70 33.00–33.35/
11.35–11.68 21.93–22.18 33.35–33.68
Description Sandy clay; Clayey silt; Silty clay; Silty clay; Clayey silt;
brown brown brown pale brown brown
Moisture (% wt.) 24.7 28.2 45.7 36.4 –
D50(mm) 0.025 0.0068 – – < 0.0013
Bulk wet density (g cm−3) 1.88 1.81 1.71 1.77 1.72
Particle density (g cm−3) 2.52 2.47 2.58 2.50 2.58
Initial void ratio 0.67 0.75 1.20 0.93 0.89
Initial degree of saturation (%) 93 95 96 99 74
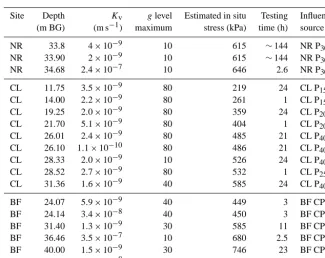
Table 3.Kvresults from CP tests indicatingglevel maximum and testing time. The influent source column identifies the site (NR, CL, BF) and depth (P20is piezometer screen at 20 m depth) of groundwater sampling. Calculations were based on Eq. (3) for in situ stress.
Site Depth Kv glevel Estimated in situ Testing Influent (m BG) (m s−1) maximum stress (kPa) time (h) source
NR 33.8 4×10⁻⁹ 10 615 ∼144 NR P30
NR 33.90 2×10⁻⁹ 10 615 ∼144 NR P30
NR 34.68 2.4×10⁻⁷ 10 646 2.6 NR P30
CL 11.75 3.5×10⁻⁹ 80 219 24 CL P15
CL 14.00 2.2×10⁻⁹ 80 261 1 CL P15
CL 19.25 2.0×10⁻⁹ 80 359 24 CL P20
CL 21.70 5.1×10⁻⁹ 80 404 1 CL P20
CL 26.01 2.4×10⁻⁹ 80 485 21 CL P40
CL 26.10 1.1×10⁻¹⁰ 80 486 21 CL P40
CL 28.33 2.0×10⁻⁹ 10 526 24 CL P40
CL 28.52 2.7×10⁻⁹ 80 532 1 CL P25
CL 31.36 1.6×10⁻⁹ 40 585 24 CL P40
BF 24.07 5.9×10⁻⁹ 40 449 3 BF CP25
BF 24.14 3.4×10⁻⁸ 40 450 3 BF CP25
BF 31.40 1.3×10⁻⁹ 30 585 11 BF CP40
BF 36.46 3.5×10⁻⁷ 10 680 2.5 BF CP40
BF 40.00 1.5×10⁻⁹ 30 746 23 BF CP40
BF 40.10 4.3×10⁻⁸ 30 746 23 BF CP40
silt size boundary is defined at 0.002 mm), except for one sandy clay core. The large proportion of silt relative to clay is an important characteristic of this formation, with clay min-eralogy dominated by smectite (Timms and Acworth, 2005; Acworth and Timms, 2009).
Moisture content varied from 24.7 to 36.4 % by weight, and was consistent with site measured data on the core (Sect. S5), although not all the cores were fully saturated as received by the external laboratory. Bulk wet density varied from 1.71 to 1.88 g cm−3 and particle density from 2.47 to 2.58 g cm−3. TheKvof cores tested in the CP module (Ta-ble 3) varied from 1.1×10⁻¹⁰to 3.5×10⁻⁷m s−1(n=18). Accelerations up to 100gwere applied during CP testing of semi-consolidated sediment cores and were more typically
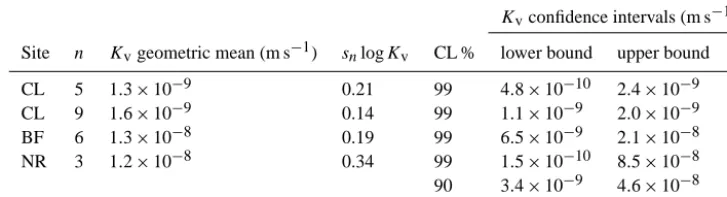
[image:8.612.134.460.268.526.2]Table 4. Geometric mean, standard deviation (sn)and confidence limits (CL %) analysis forKvdata using the CP method to test core from the clayey-silt formation at the CL, BF, and NR sites.
Kvconfidence intervals (m s−1)
Site n Kvgeometric mean (m s−1) snlogKv CL % lower bound upper bound
CL 5 1.3×10⁻⁹ 0.21 99 4.8×10⁻¹⁰ 2.4×10⁻⁹ CL 9 1.6×10⁻⁹ 0.14 99 1.1×10⁻⁹ 2.0×10⁻⁹ BF 6 1.3×10⁻⁸ 0.19 99 6.5×10⁻⁹ 2.1×10⁻⁸ NR 3 1.2×10⁻⁸ 0.34 99 1.5×10⁻¹⁰ 8.5×10⁻⁸ 90 3.4×10⁻⁹ 4.6×10⁻⁸
Anomalous flow via preferential pathways could be read-ily identified by a flow rate of several orders of magnitude greater than otherwise observed. Anomalous flow was often observed along the interface of the cores and the liner during the early minutes of a test before sealing occurred and steady-state conditions were established. On one occasion a prefer-ential flow path developed during the test, which caused very fast flow at accelerated gravity that was easily detected. A test failure like this could be readily identified and excluded from further evaluation.
A small uncertainty inKvresults for the CL site was cal-culated at a confidence limit of 99 % using the methods de-scribed in Sect. 4.3. By increasing the number of samples, the confidence bounds forKv were narrowed from a range of 4.8×10⁻¹⁰ to 2.4×10⁻⁹m s−1 (n=5) to a range of 1.1×10⁻⁹to 2.1×10⁻⁹m s−1(n=9). Increasing the num-ber of samples from five to nine decreased the standard devi-ation, although a similar geometric mean occurred with the increased sample number (Table 4). However, there was less certainty at two other core sites (BF and NR) due to limited and more variable Kv data. At the BF site the 99 % con-fidence interval had relatively wide Kv bounds for n=6, while at NR site, a confidence interval of 90 % results in similarly wideKvbounds forn=3. However, such a small number of samples is not considered sufficient for statistical analysis. This evaluation of the results highlights the relative Kvvariability and small sample set for the BF and NR sites, and the need for further testing, particularly at the NR site. This issue will be expanded in the following discussion.
5.2 Pore fluid pressure and stress conditions at accelerated gravity
How realistic the Kv measured by CP testing is of in situ conditions depends in part on the magnitude of stress and any structural changes that occur within the core matrix. Sec-tion S2 provides background on the definiSec-tion and signifi-cance of hydrostatic pore pressure, centrifuge inertial (eleva-tion) head, and gradients driving fluid flow. Section S2 also discusses the possibility thatKvalues reported in this study could be biased on the high side, considering total stress at the base of the core under steady-state conditions.
During centrifuge testing effective stress is maximum at the base of the free draining core, where fluid pressure is zero, and thus effective stress is equal to total stress under hy-drostatic conditions (no flow). In both testing methods in this study, the total stress was less than estimated in situ stress; however, the stress history of the core sample and effective stress dynamics were uncertain. It appears that the stresses during these tests were likely within an acceptable range to minimise structural changes including swelling and consoli-dation. There was no evidence of significant changes in core length due to consolidation of the samples during spot checks of core length with a digital calliper. However, further atten-tion on these processes, including instrumentaatten-tion to mea-sure fluid presmea-sures and core matrix changes during testing is required in future studies. A separate geotechnical study of these semi-consolidated sediments, including oedometer testing is in progress to better quantify the relationship be-tween stress and permeability in these semi-consolidated ma-terials. In future studies of semi-consolidated materials, mea-surement of consolidation state (over consolidation ratio) and pre-consolidation stress is recommended prior to centrifuge testing to ensure that an appropriate centrifuge stress is ap-plied.
5.3 Comparison of in situKvand column testing methods at the CL site
A comparison ofKv from in situ and column testing meth-ods are shown in Fig. 4 for the CL site. Results from the CP method (1.1×10⁻¹⁰ to 3.5×10⁻⁹m s−1,n=9) were sim-ilar toKv values from the independent and in situ method (1.6×10⁻⁹to 4.0×10⁻⁹m s−1)confirming that the sequence is of low-permeability at the CL site with a reasonable level of confidence (Table 4). However,Kvfrom both in situ and CP methods were higher than the 1gcolumn tests of cores from 11.27 to 11.47 and 28.24 to 28.33 m BG from this site (1.4×10⁻⁹, 1.1×10⁻¹⁰, and 1.5×10⁻¹⁰m s−1,n=3).
Figure 4. Vertical hydraulic conductivity (Kv)measurements by centrifuge permeameter and column permeameter compared with in situ Kv derived from pore pressure data at 6 h intervals over 4 years interpreted with harmonic analysis (after Timms and Ac-worth, 2005) for the Cattle Lane site with massive clayey-silt from the surface to 35 m depth.
lag pore pressure analysis resulted in a Kv value of 1.6× 10⁻⁹m s−1, while the change in amplitude over a vertical clay sequence of 18 m (from a 17 m depth piezometer to the inferred base of the aquitard at 35 m depth) resulted in aKv value of 4.0×10⁻⁹m s−1.
It is noted that the reliability of harmonic analysis related methods may be compromised by specific storage measure-ments. Jiang et al. (2013) relied on indirect specific stor-age values derived from downhole sonic and density log data from boreholes in the region, while Timms and Ac-worth (2005) calculated specific storage from barometric and loading responses that were recorded in the same groundwa-ter level data set and boreholes used for harmonic analysis.
The reduced test times of CP testing may be attributed to the reduced time required to achieve steady-state flow with centrifugal forces driving flow. Alternatively, the relatively longer time required for 1gcolumn testing may be attributed to deionised water interaction with clay that reduced infiltra-tion rates into the cores (10–100 lowerKvresult for 1g col-umn tests compared with CP tests). It is known that decreased ionic strength of influent (e.g. deionised water) causes a lin-ear decrease in permeability, and that the relative concentra-tions of sodium and calcium can affect permeability due to swelling and inter-layer interactions (e.g. Shackelford et al., 2010; Ahn and Jo, 2009). Differences inKvvalues from the two laboratory testing methods could be due to differences
in test set-up (e.g. 45 vs. 100 mm diameter core) and stress changes that occur as discussed in Sects. 5.2 and S2.
CP testing was relatively rapid, typically with a few hours up to 24 h required for steady-state flow CP, compared with an average of 90 h (73, 96, and 100 h for the tests reported here) for 1g column testing. In addition, an extended test of 830 h in the CP (unpublished data) verified that no sig-nificant changes occurred over extended testing periods. The CP technique can therefore reduce average testing time to
∼20 % of the time that would be required in 1g labora-tory testing systems, similar to the reduced time requirement of centrifuge methods for unsaturated hydraulic conductiv-ity functions compared with 1gcolumn tests ASTM (2010). The relative time advantage of testing cores at accelerated gravity may be greater at lower Kv, due to the increased time required to establish steady-state flow conditions. The relative time advantage could be significant for contami-nant transport testing, which requires several pore volumes of steady-state flow, compared to permeability testing where steady-state flow is established before one pore volume.
The similarity ofKv measurements with different scales at the CL site (Fig. 4) indicates that in this part of the allu-vial depositKis independent of vertical scale from centime-tres to several mecentime-tres. TheseKvresults from both in situ and laboratory methods provide an important constraint for eval-uations of hydraulic connectivity, particularly as there is a general lack ofKvdata for these sediments. Complimentary studies of hydraulic connectivity to quantify leakage rates include pore pressure monitoring and piezometer slug test-ing at various depth intervals along with hydrogeochemical and isotope tracer data. Recent geological studies of the allu-vial sequence (Acworth et al., 2015) outlined in Sect. 2, and identification of dual porosity structures in the large diameter cores (Crane et al., 2015) indicate that it may be possible for vertical leakage to occur through clayey silts if a vertical hy-draulic gradient were to be imposed. A diffusion dominated salt profile through the sequence suggest negligible vertical flow (Timms and Acworth, 2006); however, a proper assess-ment of flow connectivity requires vertical hydraulic gradi-ents to also taken into account any salinity variations with depth and pore pressure variations that have occurred over at least the past decade.
5.4 Geological and regional context for permeability of a clayey-silt aquitard
TheKv measurements reported in this paper are important because there is a lack of aquitard data for alluvial groundwa-ter systems globally. Even where many groundwagroundwa-ter inves-tigations have been completed (e.g. Murray–Darling Basin) there continues to be a lack of information on the thick clayey-silt sediments at various spatial scales.
allu-vial sequence extends to over 100 m depth, we focussed this study on sediments defined by a low net-to-gross ratio (Larue and Hovadik, 2006) of < 0.4 that reflects that clay-rich part of the sequence (Timms et al., 2011). We assumed a log-normal distribution ofKvwithin this formation, which as noted by Fogg et al. (1998) might be justified within individual facies, but not over the full stratigraphic section. It was also assumed that the standard deviation of the samples tested is similar to the standard deviation of the total population of Kv results from the formation, which may only be known if a signifi-cantly large number of samples are tested.
Kvvalues for cores from the NR and BF sites were signif-icantly larger than for the CL site, although additional data from the NR site are required to increased confidence inter-vals (Tables 3 and 4). Based on the data set currently avail-able for each site there did not appear to be any significant Kv trend with depth, except at the CL site, with a possible decrease ofKvby a factor of 3 with depth increasing from 11 to 28 m BG. Further testing is in progress to better identify any spatially significant trends inKv.
Kv results obtained from the CP for these clayey-silt aquitards were significantly larger than Kvfor consolidated rock cores tested in this system (Bouzalakos et al., 2013). The relatively low glevels in this study (up to 80g), com-pared to rock core testing (up to 520g; Bouzalakos et al., 2013) were necessary for the shallow and semi-consolidated nature of the clayey-silt cores. In fact, steady-state flow was achieved at lowglevels forKvvalues that were at least 100 times higher than the current detection limit and uncertainty of the CP system (Sect. S4).
The vertical permeability of the clayey-silt aquitards in this region, and the relative importance of matrix flow and preferential flow through fractures and heterogeneities are critical to the sustainability of the groundwater resource. TheKvdata reported in this study for these silty and semi-consolidated sediments are higher than reported for regional flow modelling in this area (McNeilage, 2006), indicating that the aquitards allow for significant recharge to underly-ing aquifers.
A regional groundwater flow model developed by Mc-Neilage (2006), with a two-layer MODFLOW code, deter-mined the dominant source of recharge to be diffuse leak-age through the soil (and aquitards) in the Breeza groundwa-ter management area. As in typical groundwagroundwa-ter modelling practice (Barnett et al., 2012), the aquitard was not explic-itly modelled, with water instead transferred from a shallow to a deeper aquifer using a vertical leakance value (units in day−1).
The calibrated groundwater model indicated that approxi-mately 70 % of the long-term average groundwater recharge (11 GL year−1)was attributed to diffuse leakage in this area that included the CL and NR sites. This volume is equivalent to 20 mm year−1, or aKvof∼6×10⁻¹⁰m s−1assuming a unit vertical hydraulic gradient over an area of approximately 500 km2. The actualKvor leakance values were not reported.
The calibrated leakance values were found to vary over 3 orders of magnitude across the Breeza area, with relatively high values in isolated areas in the south, centre, and north. In comparison, theKvresults on clayey-silt cores appear to be higher than the apparentKv of the regional groundwa-ter model, but with a similar degree of hegroundwa-terogeneity. The reasons for this discrepancy are not yet clear, but may be at-tributed to non-unique calibration of the regional flow model (e.g. underestimation of inter-aquifer leakance) or the lack of representativeKv values for this aquitard at a scale that accounts for heterogeneities and preferential flow paths.
TheKvresults in this study are within the range of values reported elsewhere for semi-consolidated clay-silt sediments. For example, Neuzil (1994) reviewed aquitardKvvalues for intact muds and lacustrine clays (10−8–10−11m s−1) com-pared to consolidated materials such as shale with values as low as 10−16m s−1for argillite. A detailed study of a clayey-marl and limestone aquitard in France (Larroque et al., 2013) found a quasi-systematic bias of 1 order of magnitude be-tween petrophysicalKvestimates (10−8–10−10m s−1), com-pared with values (10−9–10−11m s−1)from hydraulic diffu-sivity monitoring between 30 and 70 m BG. However, the empirical petrophysical relationships between porosity, pore size and intrinsic permeability do not adequately account for structural effects of clay materials. Field piezometer rising head tests (n=225) indicated thatKv of a lacustrine clay aquitard around Mexico City was 10−8–10−9m s−1 in two areas, 100 times greater than matrix-scale permeability (Var-gas and Ortega-Guerrero, 2004). However, in a third area of the Mexico City aquitard, the field tests were 10−10m s−1 in-dicating the regional variability that can occur within clayey deposits.
Studies of glacial till aquitards in Canada, the US, and Denmark find that regional permeability is typically at least 2 orders magnitude greater than laboratory tests (van der Kamp, 2001; Fredericia 1990; Bradbury and Muldoon, 1990; Gerber and Howard, 2000), although one study (Husain et al., 1998) showed that for a thick glacial till aquitard in southern Ontario, Canada, the regional permeability is similar to the laboratory-obtained measurements, indicating the absence of significant permeable structures.
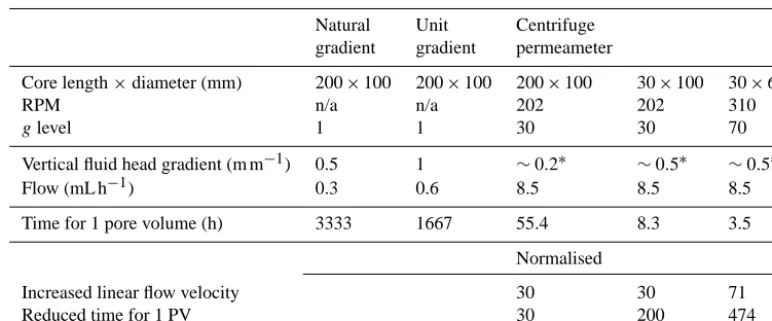
Table 5. Linear flow velocity at natural gradient, unit gradient, and for various centrifuge permeameter set-ups (assuming a Kv of 10−8m s−1).
Natural Unit Centrifuge gradient gradient permeameter
Core length×diameter (mm) 200×100 200×100 200×100 30×100 30×65
RPM n/a n/a 202 202 310
glevel 1 1 30 30 70
Vertical fluid head gradient (m m−1) 0.5 1 ∼0.2∗ ∼0.5∗ ∼0.5∗
Flow (mL h−1) 0.3 0.6 8.5 8.5 8.5
Time for 1 pore volume (h) 3333 1667 55.4 8.3 3.5
Normalised
Increased linear flow velocity 30 30 71
Reduced time for 1 PV 30 200 474
∗Fluid head gradient depends on the depth of influent on the core and the length of the core.
lack preferential flow paths at some sites, and in other areas preferential flow may occur through features such as frac-tures and heterogeneity at a range of scales (Crane et al., 2015). Further work is required to determine permeability at a range of scales, and to better understand preferential flow paths. The current conceptual model on which the numerical models in this region are based (simple layered aquitard over-lying an aquifer) do not allow for spatial variability in con-nectivity mechanisms that could be important across a large valley alluvial fill sequence. Multiple mechanisms for ver-tical connectivity, including matrix flow, fracture flow, and sedimentary heterogeneity, could be important in aquitards. The relative importance of each of these pathways for verti-cal flow would depend on the spatial sverti-cale and loverti-cal setting in each aquitard.
5.5 Groundwater flow at natural gradient and accelerated conditions
To determine if accelerated flow conditions are realistic for hydrogeological environments, the linear flow velocity for various CP set-ups was compared with other flow scenar-ios. The rationale behind this comparison was that if the flow rate was consistent with scaling laws for physical modelling, with a unit gradient as a point of reference, then the results could be consider realistic for atypical in situ vertical hy-draulic gradient. In Table 5, an in situ hyhy-draulic gradient of 0.5 is compared with CP set-ups for 100 and 65 mm diame-ter cores of various lengths for an aquitard madiame-terial with aKv of 10−8m s−1. The vertical flow rate varies from 0.3 mL h−1 under in situ conditions to 8.5 mL h−1 in the CP, such that linear flow velocities remain very low at 10−8–10−6m s−1. The flow rate during centrifugation wasNtimes greater than if a hydraulic gradient of 1 was applied to the core samples at 1g. This increase in flow rate is consistent with scaling
laws for physical modelling (Tan and Scott, 1987) providing further evidence that theKvresults are realistic.
The accelerated flow conditions, whilst realistic for hy-drogeological environments, can also be an advantage for experimental studies of solute transport. Kv results of the order of 10−9m s−1 were obtained in ∼20 % of the time required for 1g column permeameter tests. Solute break-through experiments require longer testing periods of steady-state flow than for permeability testing. For example, Timms and Hendry (2008) and Timms et al. (2009) described con-tinuous CP experiments over 90 days to quantify reactive so-lute transport during several pore volumes (PV) of flow. The comparisons of time required for 1 PV provided in Table 5 illustrate the possible advantages of CP for contaminant flow that may affect the structural integrity of the material.
6 Conclusions
An accurate and reasonable measurement of the vertical hy-draulic conductivity (Kv)of aquitards is a critical concern for many applications. For example, following an empirical analysis of selected case studies, Bredehoeft (2005) reported that the collection of new field data may render the prevail-ing conceptual hydrogeological models invalid in 20–30 % of model analyses. Bredehoeft (2005) coined the term “con-ceptual model surprise” to explain this phenomenon. He then went on to explain that “often one does not have hydraulic conductivity values for confining layers because of the diffi-culties associated with acquiring such data”.
draw-down, the associated release of water into adjacent aquifers over long time periods, and the possibility of preferential flow (Jiang et al., 2015). Realistic information on aquitard hydraulic properties could improve confidence in conceptual and numerical hydrogeological models of aquifer–aquitard systems.
In the absence of direct measurement of aquitard perme-ability there is a real risk that aquitard parameters may be ignored or misrepresented in analyses resulting in a corre-sponding underprediction of vertical connectivity via pref-erential flow paths and/or overprediction of aquifer storage and transmissivity. This is an especially important consider-ation in the analysis of aquifer tests that may not have been conducted for sufficient periods of time to identify distant boundary conditions or the characteristic effects of aquitard leakage and/or storage (Neuman and Witherspoon, 1968). In very low-permeability strata, however, there are practi-cal limitations to pump tests and packer testing below about 10−8m s−1, depending on the equipment and the thickness of strata that is subject to testing. It is recognised that in many heterogeneous systems time lags for the propagation of draw-down responses through an aquitard can be significant (Kelly et al., 2013).
Core-scale measures of aquitard hydraulic conductivity are an integral component of hydrogeological studies con-cerning aquifer connectivity. The availability of core-scale facies measurements enables the up-scaling of bore log and geophysical data to determine upper and lower hydraulic conductivity bounds for regionally up-scaled aquitard units. Any differences between K values at various scales are important for indicating the possibility of preferential flow through heterogeneous strata or aquitard defects (e.g. faults and fractures). The availability of these bounded estimates helps to constrain the uncertainty analyses conducted on re-gional groundwater flow models to yield more confident pre-dictions (Gerber and Howard, 2000).
Nevertheless, regional groundwater flow models generally use hydraulic resistance (leakance) values to transfer water vertically between aquifers (Barnett et al., 2012) rather than spatial discretisation of aquitards that control this transfer. While this simplification is justified in many models, such an approach is not capable of identifying rapid flow pathways through defects in the aquitards or the release of stored water from an aquitard to an aquifer and cannot resolve the tical hydraulic head distribution across the aquitard to ver-ify drawdown responses. An aquitard should be subdivided into at least three thinner layers to effectively model tran-sient pressure responses (Barnett et al., 2012). Rather than assigning constant theoretical values for aquitard properties through these multiple layers a combination of realistic and rapid laboratory measurement and direct in situ measure-ments could improve confidence in conceptual understanding and model predictions.
The Supplement related to this article is available online at doi:10.5194/hess-20-39-2016-supplement.
Acknowledgements. Funding from the Australian Research Coun-cil and National Water Commission, through the National Centre for Groundwater Research and Training Program 1B is gratefully acknowledged. The contributions of N Baker and A Ainsworth of Broadbent and Sons, Huddersfield, UK, are acknowledged and J McCartney for a helpful discussion on the theory of fluid flow during centrifuge testing. We appreciated research support at the Breeza farm provided by M McLeod and S Goodworth of the NSW Department of Primary Industries. Clayey-silt cores were drilled by New South Wales Office of Water, with S McCulloch, H Studhome, and G Regmi. Experimental testing was assisted at UNSW by A Hartland, B Bambrook, M Aitkins, P King, S May, and T Meyers. Five reviewers and an editor are thanked for their constructive comments on earlier drafts of the paper.
References
Acworth, R. I. and Timms, W.: Evidence for connected water pro-cesses through smectite dominated clays at Breeza, New South Wales, Aust. J. Earth Sci., 56, 81–96, 2009.
Acworth, R. I., Timms, W. A., Kelly, B. F. J., McGeeney, D., Ralph, T. J., Larkin, Z. T., and Rau, G. C.: Late Cenozoic Palaeoval-ley fill sequence from the Southern Liverpool Plains, New South Wales – implications for groundwater resource evaluation, Aust. J. Earth Sci., 62, 657–680, 2015.
Ahn, H. S. and Young Jo, H. Y.: Influence of exchangeable cations on hydraulic conductivity of compacted bentonite, Appl. Clay Sci., 44, 144–150, 2009.
API: Recommended Practices for Core Analysis. Recommended Practice 40, 2nd Edn., American Petroleum Institute Publishing Services, Washington DC, 1998.
APLNG: Groundwater Assessment, Australia Pacific LNG Up-stream Project Phase 1, Q-LNG01-15-TR-1801, Australia Pacific LNG, Milton, Queensland, Australia, 266 pp., 2013.
AS: Methods of testing soil for engineering purposes, Standard methods 1289 2.1.1; 5.1.1; 5.3.2 and 6.7.3 Australian Standards, Sydney, 1991.
ASTM: Standard practice for thin-walled tube sampling of soils for geotechnical purposes, American Society for Testing and Mate-rials International, ASTM D1587-08, West Conshohocken, PA, USA, 2008a.
ASTM: Standard test method for determining unsaturated and sat-urated hydraulic conductivity in porous media by steady state centrifugation, American Society for Testing and Materials In-ternational, ASTM D 6527-08, West Conshohocken, PA, USA, 2008b.
ASTM: Standard test methods for laboratory determination of den-sity (unit weight) of soil specimens, American Society for Test-ing and Materials International, ASTM D7263-09, West Con-shohocken, PA, USA, 2009.
ASTM: Standard test method for measurement of hydraulic con-ductivity of unsaturated soils, American Society for Testing and Materials International, ASTM D 7664-10, West Conshohocken, PA, USA, 2010.
Badenhop, A. M., and Timms, W. A.: Long-term salinity changes in an inland aquifer, NSW, Australia, in: Proceedings of the 34th Hydrology and Water Resources Symposium, Engineers Aus-tralia, Sydney, NSW, 43–51, 19–22 November 2012.
Barnett, B., Townley, L. R., Post, V., Evans, R. E., Hunt, R. J., Peeters, L., Richardson, S., Werner, A. D., Knapton, A., and Boronkay, A.: Australian Groundwater Modelling Guidelines, National Water Commission, Canberra, Australia, 2012. Boldt-Leppin, B. E. J. and Hendry, J. M.: Application of harmonic
analysis of water levels to determine vertical hydraulic conduc-tivities in clay-rich aquitards, Ground Water, 41, 514–522, 2003. Bouzalakos, S., Timms, W., Rahman, P., McGeeney, D., and Whe-lan, M.: Geotechnical centrifuge permeater for characterizing the hydraulic integrity of partially saturated confining strata for CSG operations, in: Reliable Mine Water Technology, Vol. I – 1–778, edited by: Brown, A., Figueroa, L., and Wolkersdorfer, C., Den-ver, Colorado, USA (Publication Printers), Proceedings of the International Mine Water Congress, Colorado School of Mines, 1193–1198, 5–9 August 2013.
Bouzalakos, S., Crane, R., Liu, H., and Timms, W. A.: Geotechni-cal and modelling studies of low permeability barriers to limit
subsurface mine water seepage, in: 4th International Conference on Water Management in Mining, Vina del Mar, Chile, 161–171, 28–30 May 2014, 2014.
Bradbury, K. R. and Muldoon, M. A: Hydraulic conductivity deter-minations in unlithified glacial and fluvial materials, in: Ground Water and Vadose Zone Monitoring, edited by: Nielsen, D. M. and Johnson, A. I., ASTM STP 1053, American Society for Test-ing and Materials, Philadelphia, 138–151, 1990.
Bredehoeft, J.: The conceptualization model problem–surprise, Hy-drogeol. J.,13, 37–46, 2005.
Broadbent: Operating Manual for Modular Geotechnical Centrifuge with GT2/0.65 Permeameter And GT6/0.75 Beam Environ-ments, Broadbent and Sons. Ltd., Huddersfield, UK, 2011. Cherry, J. A., Parker, B. L., Bradbury, K. R., Eaton, T. T.,
Gotkowitz, M. G., Hart, D. J., and Borchardt, M. A.: Role of Aquitards in the Protection of Aquifers from Contamination: A “State of the Science” Report, AWWA Research Foundation, Denver, CO, USA, 2004.
Conca, J. L. and Wright, J.: The UFA method for rapid, direct mea-surements of unsaturated transport properties in soil, sediment and rock, Aust. J. Soil. Res., 36, 1–25, 1998.
Crane, R. A., Cuthbert, M. O., and Timms, W.: Technical Note: The use of an interrupted-flow centrifugation method to characterise preferential flow in low permeability media, Hydrol. Earth Syst. Sci., 19, 3991–4000, doi:10.5194/hess-19-3991-2015, 2015. Farley, C.: Aquitards and groundwater sustainability:
three-dimensional mapping of aquitard architecture, unpublished hon-ours thesis, School of Civil and Environmental Engineering, Uni-versity of New South Wales, 2011.
Fogg, G. E., Noyes, C. D., and Carle, S. F.: Geologically based model of heterogeneous hydraulic conductivity in an alluvial set-ting, Hydrogeol. J., 6, 131–143, 1998.
Fredericia, J.: Saturated hydraulic conductivity of clayey tills and the role of fractures, Nordic Hydrol., 21, 119–132, 1990. Garnier, J., Gaudin, C., Springman, S. M., Culligan, P. J.,
Good-ings, D., Konig, D., Kutter, B., Phillips, R., Randolph, M. F., and Thorel, L.: Catalogue of scaling laws and similitude questions in geotechnical centrifuge modelling, Int. J. Phys. Model. Geotech., 3, 1–23, 2007.
Gerber, R. E. and Howard, K.: Recharge through a regional till aquitard: three-dimensional flow model water balance approach, Ground Water, 38, 410–422, 2000.
Gill, D. E., Corthesy, R., and Leite, M. H.: Determining the minimal number of specimens for laboratory testing of rock properties, Eng. Geol., 78, 29–51, 2005.
Greve, A. K., Andersen, M. S., and Acworth, R. I.: Monitoring the transition from preferential to matrix flow in cracking clay soil through changes in electrical anisotropy, Geoderma, 179–180, 46–52, 2012.
Grisak, G. E. and Cherry, J. A.: Hydrologic characteristics and re-sponse of fractured till and clay confining a shallow aquifer, Can. Geotech. J., 12, 23–43, 1975.
Head, K. H.: Manual of Soil Laboratory Testing, Pentech Press, London, UK, 1988.
Husain, M. M., Cherry, J. A., Fidler, S., and Frape, S. K.: On the long term hydraulic gradient in the thick clayey aquitard in the Sarnia region, Ontario, Can. Geotech. J., 35, 986–1003, 1998. Jiang, Z., Mariethoz, G., Taulis, M., and Cox, M.: Determination
leaky system using water-level signals in adjacent aquifers, J. Hydrol., 500, 170–182, 2013.
Jiang, Z., Mariethoz, G., Raiber, M., Timms, W. A., and Cox, M.: Application of 1D paleo-fluvial process modeling at a basin-scale to augment sparse borehole data: example of a Permian forma-tion in the Galilee Basin, Australia, Hydrol. Proc., in press, 2015. Josh, M., Esteban, L., Delle Piane, C., Sarout, J., De-whurst, D. N., and Clenell, M. B.: Laboratory characterisa-tion of shale properties, J. Petrol. Sci. Eng., 88, 107–124, doi:10.1016/j.petrol.2012.01.023, 2012.
Jougnot, D., Revil, A., Lu, N., and Wayllace, A.: Transport properties of the Callovo-Oxfodrian clay rock under par-tially saturated conditions, Water Resour. Res, 46, W08514, doi:10.1029/2009WR008552, 2010.
Kelly, B. F. J., Timms, W. A, Andersen, S. M., Ludowici, K., Blak-ers, R., Badenhop, A., McCallum, A. M., Rau, G. C., and Ac-worth, R. I.: Aquifer heterogeneity and response time: the chal-lenge for groundwater management, Crop Pasture Sci., 64, 1141– 1154, 2013.
Kelly, B. F. J., Timms, W., Ralph, T., Giambastini, B., Comu-nian, A., McCallum, A. M., Andersen, M. S., Acworth, R. I., and Baker, A.: A reassessment of the Lower Namoi Catchment aquifer architecture and hydraulic connectivity with reference to climate drivers, Aust. J. Earth Sci., 61, 501–511, 2014.
Larue, D. K. and Hovadik, J.: Connectivity of channelized reser-voirs: A modelling approach, Petrol. Geosci., 12, 291–308, 2006. Larroque, F., Cabaret, O., Atteia, O., Dupuy, A., and Franceschi, M.: Vertical heterogeneities of hydraulic aquitard parameters: pre-liminary results from laboratory and in situ monitoring, Hydrol. Sci. J., 58, 912–929, 2013.
McCartney, J. S. and Zornberg, J. G.: Centrifuge permeameter for unsaturated soils II: Measurement of the hydraulic characteristics of an unsaturated clay, J. Geotech. Geoenviron. Eng., 136, 1064– 1076, 2010.
McNeilage, C.: Upper Namoi Groundwater Flow Model, NSW De-partment of Natural Resources, New South Wales, Parramatta, 2006.
Nakajima, H. and Stadler, A. T.: Centrifuge modeling of one-step outflow tests for unsaturated parameter estimations, Hydrol. Earth Syst. Sci., 10, 715–729, doi:10.5194/hess-10-715-2006, 2006.
Neuman, S. P. and Witherspoon, P. A.: Theory of flow in aquicludes adjacent to slightly leaky aquifers, Water Resour. Res., 4, 103– 112, 1968.
Neuman, S. P. and Witherspoon, P. A.: Field determination of the hydraulic properties of leaky multiple aquifer systems, Water Re-sour. Res., 8, 1284–1298, 1972.
Neuzil, C. E.: Groundwater flow in low permeability environments, Water Resour. Res., 22, 8, 1163–1195, 1986.
Neuzil, C. E.: How permeable are clays and shales?, Water Resour. Res., 30, 145–150, 1994.
Nimmo, J. R. and Mello, K. A.: Centrifugal techniques for mea-suring saturated hydraulic conductivity, Water Resour. Res., 27, 1263–1269, 1991.
Parks, J., Stewart, M., and McCartney, J. S.: Validation of a cen-trifuge permeameter for investigation of transient infiltration and drainage flow processes in unsaturated soils, Geotech. Testing J., 35, GTJ103625, doi:10.1520/GTJ103625, 2012.
Potter, P. E., Maynard, J. B., and Pryor, W. A.: Sedimentology of Shale – Study Guide and Reference Source, Springer-Verlag, New York, 1980.
Rowe, R. K., Quigley, R. M., and Booker, J. R.: Clayey Barrier Sys-tems for Waste Disposal Facilities, E&FN Spon, London, 1995. Shackelford, C. D., Sevick, G. W., and Eykholt, G. R.: Hydraulic
conductivity of geosynthetic clay liners to tailings impoundment solutions, Geotext. Geomembranes, 28, 149–162, 2010. Smith, L. A., van der Kamp, G., and Hendry, M. J.: A new technique
for obtaining high-resolution pore pressure records in thick clay-stone aquitards and its use to determine in situ compressibility, Water Resour. Res., 9, 732–743, 2013.
Sundaram, B., Feitz, A., de Caritat, P., Plazinska, A., Brodie, R., Coram, J., and Ransley, T.: Groundwater Sampling and Analysis – a Field Guide, Record 2009/27, Geoscience Australia, 95 pp., 2009.
Tan, T. S. and Scott, R. F.: Centrifuge scaling considerations for fluid-particle systems: discussion by R. N. Taylor and response, Geotechnique, 37, 131–133, 1987.
Timms, W. and Acworth, R. I.: Propagation of porewater pressure change through thick clay sequences: an example from the Yarra-manbah site, Liverpool Plains, New South Wales, Hydrogeol. J., 13, 858–870, doi:10.1007/s10040-005-0436-7, 2005.
Timms, W. and Acworth, R. I.: Rethinking a conceptual model: ad-vective vs. diffusive chloride flux in a low permeability clay se-quence, International Association of Hydrogeologists Congress on Aquifer Systems Management, Dijon, France, 30 May–1 June 2006.
Timms, W. and Anderson, D.:Geotechnical centrifuge technology for characterising the interaction of tailings and pore water over decadal time periods, Australian Institute of Mining and Metal-lurgy, Conference Proceedings: Tailings and Mine Waste Man-agement for the 21st Century, 247–262, 2015.
Timms, W. A. and Hendry, M. J.: Long term reactive solute trans-port in an aquitard using a centrifuge model, Ground Water, 46, 616–628, doi:10.1111/j.1745-6584.2008.00441.x, 2008. Timms, W., Hendry, J., Muise, J., and Kerrich, R.: Coupling
cen-trifuge modeling and laser ablation ICP-MS to determine con-taminant retardation in clays, Environ. Sci. Technol., 43, 1153– 1159, 2009.
Timms, W., Kelly, B. F. J., Blakers, R., Farley, C., Regmi, G., Larsen, J., and Bowling, A.: Implications of 3D geological ar-chitecture for surface-groundwater connectivity in the Mooki catchment, in: NSW International Association of Hydrogeolo-gists Symposium 2011 – Uncertainty in Hydrogeology, edited by: McLean, W. and Milne-Holme, B., Sydney, Australia, 4– 5 September 2011, available at: www.3pillarsnetwork.com.au/ kb/iah-nsw-symposium-timms-.pdf (last access: 21 May 2015), 2011.
Timms, W., Acworth, I., Hartland, A., and Laurence, D.: Leading practices for assessing the integrity of confining strata: applica-tion to mining and coal seam gas extracapplica-tion, in: Internaapplica-tional Wa-ter and Mining Association Symposium Proceedings, edited by: Clint, D., McCullough, C. D., Lund, M. A., and Wyse, L., Bun-bury, Western Australia, 29 September to 4 October 2012, 139– 148, 2012.
perme-ability strata, in: Proceedings of International Congress on Phys-ical Modelling in Geotechnics (ICPMG), Perth, Balkema, 14–17 January 2014.
US EPA: Requirement for hazardous waste landfill design, con-struction and closure, EPA/625/4–89/022, Cincinnati, OH, USA, 1989.
van der Kamp, G.: Methods for determining the in situ hydraulic conductivity of shallow aquitards – an overview, J. Hydrol., 9, 5–6, 2001.
van der Kamp, G.: Determining the hydraulic properties of aquitards, 2nd Canadian Symposium on Aquitard Hydrogeology, University of Ottawa, Canada, 21–23 June 2011.
Vargas, C. and Ortega-Guerrero, A.: Fracture hydraulic conductivity in the Mexico City clayey aquitard: field piezometer rising-head tests, Hydrogeol. J., 12, 336–344, 2004.
Wiesner, T. and Acworth, R. I.: Groundwater contamination inves-tigation using CCPTs, Water 99 Joint Congress, Brisbane, Aus-tralia, 6–8 July 1999.
Wright, M., Dillon, P., Pavelic, P., Peter, P., and Nefiodovas, A.: Measurement of 3-D hydraulic conductivity in aquifer cores at in situ effective stress, Ground Water, 40, 509–517, 2002. Znidarˇci´c, D., Miller, R., van Zyl, D., Fredlund, M., and Wells, S.:
Consolidation Testing of Oil Sand Fine Tailings, Proceedings Tailings and Mine Waste, 2011, Vancouver, BC, 6 to 9 Novem-ber 2011.