Sociology Theses Department of Sociology
12-16-2015
Social Change in Attitudes Toward Euthanasia and
Suicide for Terminally Ill Persons, 1977-2014: An
Age-Period-Cohort Analysis
Brandon Attell
Follow this and additional works at:https://scholarworks.gsu.edu/sociology_theses
This Thesis is brought to you for free and open access by the Department of Sociology at ScholarWorks @ Georgia State University. It has been accepted for inclusion in Sociology Theses by an authorized administrator of ScholarWorks @ Georgia State University. For more information, please [email protected].
Recommended Citation
Attell, Brandon, "Social Change in Attitudes Toward Euthanasia and Suicide for Terminally Ill Persons, 1977-2014: An Age-Period-Cohort Analysis." Thesis, Georgia State University, 2015.
TERMINALLY ILL PERSONS, 1977-2014: AN AGE-PERIOD-COHORT ANALYSIS
by
BRANDON KYLE ATTELL
Under the Direction of Ben Kail, PhD
ABSTRACT
Several longitudinal studies show that over time the American public has become more
approving of euthanasia and suicide for terminally ill persons. Yet, these previous findings are
limited because they derive from biased estimates of disaggregated hierarchical data. Using
insights from life course sociological theory and recently developed cross-classified mixed
effects logistic regression, I better account for this liberalization process by disentangling the
age, period, and cohort effects that contribute to longitudinal changes in these attitudes. Findings
indicate that while attitudes toward euthanasia and suicide have liberalized over time, they
remained relatively stable over the past 10 years. Furthermore, this study finds significant age
effects in which the probability of agreement to euthanasia and suicide steadily decreases
throughout the life course. Contrary to previous research, this study finds that when controlling
for age and period effects, there are no significant birth-cohort effects that contribute to
longitudinal changes in these attitudes.
TERMINALLY ILL PERSONS, 1977-2014: AN AGE-PERIOD-COHORT ANALYSIS
by
BRANDON KYLE ATTELL
A Thesis Submitted in Partial Fulfillment of the Requirements for the Degree of
Master of Arts
in the College of Arts and Sciences
Georgia State University
Copyright by Brandon Kyle Attell
TERMINALLY ILL PERSONS, 1977-2014: AN AGE-PERIOD-COHORT ANALYSIS
by
BRANDON KYLE ATTELL
Committee Chair: Benjamin Lennox Kail
Committee: Erin Ruel
Wendy Simonds
Electronic Version Approved:
Office of Graduate Studies
College of Arts and Sciences
Georgia State University
ACKNOWLEDGEMENTS
I would first like to thank Ben Kail for directing this project, spending time reviewing the
various drafts that it went through, providing insightful feedback, and never letting me leave his
office with my statistics questions unanswered. My gratitude is also extended to Erin Ruel and
Wendy Simonds for their committee work on this project. Their thoughtful comments both
guided and improved my thesis considerably. I would also like to thank Elisabeth Burgess of the
Gerontology Institute at GSU for thoughtful conversations and feedback on a much earlier
version of this project.
I am deeply indebted to the friends I have made in graduate school for the social support
they have provided during this time of professional socialization. In no particular order, Leah
Kozee Youngblood, Eryn Grucza-Viscarra, and Ana LaBoy have been the sisters that I never had
growing up. To all three of you, thank you for: burritos, beer, karaoke, dancing, laughing,
cupcakes, car rides, and Eryn’s 30th birthday party. I would also like to thank Jacob Allen for the encouragement and motivation he has offered to me in graduate school, and for always listening
at length when I wanted to talk sociology or statistics.
To Linda Treiber, thank you for inspiring me to be a sociologist and for your continued
support and faith in me. To Gail Markle, thank you for inspiring me to be a better writer and
showing me the perseverance it takes to be a good academic.
TABLE OF CONTENTS
ACKNOWLEDGEMENTS ... v
LIST OF TABLES ... viii
LIST OF FIGURES ... ix
1 INTRODUCTION... 1
2 LITERATURE REVIEW ... 3
2.1 Changing Attitudes in America ... 3
2.2 Temporal Variation: Life Course Theory ... 9
2.3 Moderation of Cohort Effects ... 12
2.4 Summary and Hypotheses ... 13
3 METHODS ... 15
3.1 Age-Period-Cohort Analysis ... 15
3.2 Measures ... 18
3.2.1 Dependent Variables ... 18
3.2.2 APC Variables ... 18
3.2.3 Moderation of Cohort Effects Variables ... 19
3.2.4 Control Variables ... 19
3.3 Plan of Analysis ... 20
4 RESULTS ... 24
6 CONCLUSION ... 46
REFERENCES ... 47
APPENDICES ... 53
LIST OF TABLES
Table 1. Summary Statistics For All Variables in the Analysis ... 25
Table 2. Support for Euthanasia and Suicide by Age, Period, and Cohort Membership... 27
Table 3. Cross-Classified Mixed Effects Logistic Regression of Support for Euthanasia ... 29
Table 4. Cross-Classified Mixed Effects Logistic Regression of Support for Suicide ... 33
Table 5. Level-2 Period Effects with Level-1 Covariates... 35
LIST OF FIGURES
Figure 1. Support for Euthanasia and Suicide Over Time ... 26
Figure 2. Predicted Probability of Support for Euthanasia and Suicide by Age ... 31
Figure 3. Predicted Probability of Support for Euthanasia and Suicide by Period ... 31
1 INTRODUCTION
On October 27, 1997 the state of Oregon made U.S. history by becoming the first state to
enact legislation that legally permitted physicians to prescribe medication to terminally ill
persons that would end their life. In regards to the legislation, termed the Death with Dignity
Act, attitudes mattered. The legislation barely passed voter approval with a rate of 51 percent
(Curran 1998). Following the foundation set in place by the Oregon Death with Dignity Act,
voters in Washington in 2008 legalized the Washington Death with Dignity Act with an approval
rate of almost 58 percent. In 2009 in Montana and 2014 in New Mexico, state Supreme Courts
ruled that physicians who help individuals requesting compassionate care at the end of life are
not violating public policy. In 2013, the state of Vermont legislature passed the Patient Choice
and Control at End of Life Act, which gave physicians legal rights to prescribe life-ending
medication to individuals with terminal illnesses.
Five states now legally allow for physician aide in the ending of life, which represents a
liberalization of attitudes toward euthanasia and suicide for terminally ill persons. Indeed, the
passage of legislature alongside the hearings of state Supreme Courts reflects a growing approval
of personal control over the end of life, especially when individuals are terminally ill.
Unfortunately, there is little research that documents and explains these trends. The majority of
research to date has primarily considered cross-sectional demographic determinants of these
attitudes. Very few studies exist regarding longitudinal changes in attitudes toward euthanasia
and suicide for terminally ill persons. This dearth of literature raises important questions, such
as: what exactly are the trends over time, especially in recent years when four states have
Using cumulative data from the 1977-2014 General Social Survey (GSS), I contribute to
the body of literature on attitudes toward euthanasia and suicide for terminally ill persons in
several ways. First, my analysis adds an additional 10 years of survey data to the existing
longitudinal trend research on this topic. Second, using age-period-cohort analysis I more
accurately decompose social change in these attitudes over time. Third, I determine if previously
found cross-sectional demographic determinants of attitudes toward euthanasia and suicide such
2 LITERATURE REVIEW
2.1 Changing Attitudes in America
Attitudes of the American public have significantly liberalized over time on a variety of
social phenomena. Homosexuality1, once widely considered to be deviant and immoral, has
become more socially accepted since the early 1990s (Loftus 2001). For instance, the tolerance
and equality framing of the gay rights movement led to a sea change in public attitudes toward
same-sex marriage; whereas 71 percent of the U.S. population disapproved of same-sex marriage
in 1986, only 56 percent disapproved in 2006 (Baunach 2011), and by 2010 only 40%
disapproved2 (Baunach 2012). Furthermore, from the early 1970s onward, Americans became
more supportive of free speech and first amendment rights (Davis 2012; Davis 1975), moved
away from discriminatory attitudes regarding racial inequality (Bobo et al. 2012; Firebaugh and
Davis 1988), and increasingly favored women’s equality across a variety of measures
(Bolzendahl and Myers 2004; Campbell and Marsden 2012). A recent Gallup analysis of
American’s moral attitudes from 2001 to 2014 reports record high approval rates regarding the
morality of birth control, divorce, and sex between unmarried men and women (Riffkin 2014).
Clearly, there are many domains in which American’s attitudes have become more liberal over
time.
Similarly, this liberalization process is mirrored in rising approval rates toward
euthanasia and suicide for terminally ill persons. Early research began by documenting
cross-sectional demographic correlates; for instance, in 1977 the General Social Survey (GSS), a
1 Many of the findings from previous research reported in this thesis derive from analyses of the General Social
Survey. Data collected from the GSS involve the use of several problematic terms, among them the words
“homosexuality”, “male”, and “female.” These words have clinical and pathological connotations, and sociologists have pointed out their problematic usage. I use these words in this thesis to match the language used during data collection and subsequently how other scholars report findings in peer-reviewed work.
2 Baunach (2011; 2012) uses separate decomposition techniques to model longitudinal changes in attitudes toward
nationally representative sample of the American public’s opinion on a variety of topics,
included several measures asking respondents about their attitudes toward euthanasia and suicide
for terminally ill persons. Two years later, in 1979, B.K. Singh used the 1977 GSS data to
publish the first empirical paper on attitudinal correlates, focusing on how sociodemographic and
socioeconomic characteristics, religious and political ideology, and geographic region predict
attitudes toward euthanasia and suicide for terminally ill persons (Singh 1979). Stated broadly,
Singh (1979) found that: as age increased, approval of euthanasia and suicide decreased; men
and those who were white were more approving of euthanasia and suicide; increased income and
education positively affected attitudes; approval for both measures was higher for non-Catholics;
and those living in New England, the Pacific region, and the Mountain region all expressed
higher approval rates.
Previous research also finds that attitudes toward euthanasia and suicide for terminally ill
persons vary by gender, race, educational attainment, political affiliation, and religious ideology.
Compared to men, women are less likely to support euthanasia or suicide for terminally ill
persons (DeCesare 2000; Finlay 1985). Whites are more likely than blacks and “other races” to
approve of euthanasia and suicide for terminally ill persons, which most scholars attribute to the
historical mistrust that nonwhites have toward the medical profession (DeCesare 2000;
Jorgenson and Neubecker 1980; Lichtenstein et al. 1997; Wasserman, Clair and Ritchey 2006).
Contrary to the preliminary evidence provided by Singh (1979), in regard to education,
additional research shows that an inverse relationship exists in which approval toward the
voluntary taking of life decreases as educational attainment increases (Blackhall et al. 1999;
Finaly 1985). This is likely because higher education reflects social class positions in which
2011). Additionally, individuals who identify as Democrats or liberals, rather than as
Republicans or conservatives, are the most supportive of euthanasia and suicide for terminally ill
persons (DeCesare 2000). Finally, because of the ideological commitments associated with
religion, religious ideology also has strong connections to the voluntary taking of life. Compared
to Protestants, Catholics, or Jewish individuals, those who report no religious affiliation have the
greatest approval of suicide and euthanasia for terminally ill persons (Burdette, Hill and Moulton
2005; DeCesare 2000).
Alongside research documenting these demographic correlates, a parallel body of
empirical studies examines longitudinal changes in attitudes toward euthanasia and suicide for
terminally ill persons. Perhaps the earliest was a comparison of several nationally representative
surveys conducted by Benson (1999), who found an overall liberalization of attitudes toward
these social phenomena. When it comes to attitudes toward euthanasia, Gallup data reveal a
significant trend: in 1947, only 37% of individuals stated that euthanasia should be allowed, but
by 1996, this number increased to 69% (Benson 1999). Data from the GSS reveal a similar
trend: in 1977, 60% of individuals stated that euthanasia should be allowed, and by 1998,
approval rates increased slightly to 68% (Benson 1999). In regard to suicide for terminally ill
persons, GSS data demonstrates a sea change of support: in 1977, only 38% of individuals
agreed that a person has the right to end his or her own life if they have an incurable disease
(Benson 1999). By 1998, the percentage of those in support for suicide jumped to 61% (Benson
1999).
In 2000, DeCesare replicated B.K. Singh’s classic 1979 study of attitudes toward
euthanasia and suicide for terminally ill persons. Utilizing the same coding schemes and
determine whether and how the effects of demographic correlates have changed over time.
DeCesare’s findings mirror the trends outlined by Benson (1999): approval of euthanasia
increased from 62.4% in 1977 to 70.4% in 1996, and approval of suicide for terminally ill
persons increased from 39.6% of individuals in 1977 to 65.8% of individuals in 1996 (DeCesare
2000). Using the two endpoints of 1977 and 1996 in separate regression models, DeCesare then
determined that the demographic correlates of attitudes toward euthanasia and suicide for
terminally ill persons largely remained the same (DeCesare 2000).
In a follow up to Benson (1999), Allen et al. (2006) utilized Gallup data and report a
longer time-period trend: in 1936 46% of individuals approved of euthanasia for terminally ill
persons, but by the year 2002, that number had increased to 72%. Utilizing GSS data, Moulton,
Hill, and Burdette (2006) analyzed attitudes toward euthanasia from 1977-2004. Although
Moulton et al. do not report specific rates of approval of euthanasia, they do state that “with the
exception of spikes in opposition during the late 1970s/early 1980s and the early 1990s, attitudes
toward euthanasia have remained fairly stable since the early 1970s” (2006:259). Moulton et al.
took their analysis a step further than the existing trend research by decomposing the longitudinal
effect of religious ideology on attitudes toward euthanasia. The results of their analysis indicate
that across all religious denominations monitored by the GSS, attitudes toward euthanasia
significantly liberalized over time, with moderate Protestants exhibiting the most change over
time.
Perhaps the most comprehensive analysis to date of longitudinal trends in attitudes
toward euthanasia and suicide for terminally ill persons has been carried out by Duncan and
Parmelee (2006) utilizing GSS data from 1977 to 2002. Their findings on approval rates of
DeCesare 2000; Moulton, Hill, and Burdette 2006), indicating an increase in support of
euthanasia and suicide for terminally ill persons from 1977 onward. However, their unique
contribution rests in their cohort analysis of the “old, middle, and new” birth cohorts,
respectively representing individuals born: before 1924, between 1924 and 1959, and after 1959
(Duncan and Paremelee 2006). The main findings of their cohort analysis indicate that: the
approval trends for those in the “middle” birth cohort are almost identical to the aggregate trends
that do not take cohort into account; the highest rates of approval on both measures are from
individuals in the “new” birth cohort; and across all three cohorts there exists a rapid increase in
approval of suicide for terminally ill persons from 1977 to the late 1980s, while the acceptance
of euthanasia for terminally ill persons grows much slower across the same time period (Duncan
and Paremelee 2006).
Taken together, there are several conclusions that can be drawn regarding social change
in attitudes toward euthanasia and suicide for terminally ill persons. First, public approval on
both measures has increased over time, although the magnitude of the increase over time is
greater for suicide for terminally ill persons. Second, when utilizing pooled analytic techniques,
as is the case with the Moulton et al. (2006), demographic correlates change over time, as made
evident by the increasing liberalization of attitudes across all religious groups. Third, cohorts
play an important role in shaping attitudes toward euthanasia and suicide for terminally ill
persons, with those in a younger cohort showing higher approval rates on both measures
compared to those in the older cohort.
While this body of previous research is important in examining attitudes toward
euthanasia and suicide for terminally ill persons, there are several methodological issues that
suicide for terminally ill persons is dichotomous. A dichotomous response structure can be
described as answers to a question that only have two options, in this case yes or no. In
statistical analyses, dichotomous dependent variables require special consideration regarding
hypothesis testing. Both Singh (1979) and DeCesare (2000) model the relationship between
demographic variables and attitudes toward euthanasia and suicide for terminally ill persons
using ordinary least squares (OLS) regression. OLS regression is not appropriate for modeling
dichotomous dependent variables because 2 of the assumptions of OLS regression are a
univariate normal distribution of scores on the dependent variable and linear relationships
between independent and dependent variables. The dichotomous structure of responses to the
GSS euthanasia and suicide questions violates these assumptions of OLS regression because they
take on the shape of a logistic s-shaped curve, and are therefore non-normally distributed and
non-linear. The results of the analyses carried out by Singh (1979) and DeCesare (2000) are
therefore biased, and should have been properly modeled using binary logistic regression.
Additionally, almost all of the longitudinal research to date on this topic has not
statistically accounted for change over time. The research carried out by Benson (1999), Allen et
al. (2006), and Duncan and Parmelee (2006) are descriptive statistics that describe percentage
change over time, rather than inferential statistics that account for contributors to change over
time, such as race or gender, or determine if yearly changes in attitudes are significantly different
from one another. Indeed, these studies (Allen et al. 2006; Benson 1999; Duncan and Paremelee
2006) demonstrate that attitudes have changed over time, but do not determine whether time
predicts the likelihood of supporting or not supporting euthanasia or suicide.
One exception is the findings of Moulton et al. (2006), who account for the survey year in
they treat year of survey as an individual-level variable3, which ignores the hierarchical structure of the data. Properly accounting for the year of survey requires a multilevel statistical approach
in which individuals are nested within survey years. Accordingly, the treatment of year of
survey as an individual-level variable is a disaggregation of the hierarchically structured data
(Hox 2010). Disaggregation of hierarchically structured data typically results in false positive
tests of statistical significance (Hox 2010; Snijders and Bosker 2012), yielding inappropriate
conclusions about the relationship between the two variables tested. Accordingly, the year of
survey measure analyzed by Moulton et al. (2006) should have been modeled in a multilevel
framework.
Furthermore, the most recent longitudinal research on attitudes toward euthanasia and
suicide for terminally ill persons (Moulton et al. 2006) ends with data from the 2004 GSS. The
most recently available data from the GSS include samples from 2006, 2008, 2010, 2012, and
2014. Thus, it is important to understand whether attitudes toward euthanasia and suicide for
terminally ill persons changed since 2004, particularly in light of the passage of the 2008
Washington Death with Dignity Act and the 2009 ruling of the Montana Supreme Court that
upheld compassionate care for the end of life. Moreover, this analysis will update our
understanding of – in addition to religious ideology – whether the effects of other demographic
correlates change over time (for example, by racial identity or political affiliation).
2.2 Temporal Variation: Life Course Theory
A life course theoretical perspective is particularly useful for examining social change
over time. In general, the life course perspective consists of several central themes: “the
3 Individual-level variables refer to characteristics of people that are modeled in multi-level frameworks. Typical
interplay of human lives and historical times, the timing of lives, linked or interdependent lives,
and human agency in choice making” (Elder 1994: 5). The life course perspective does not
necessarily encompass a single theory, but rather a paradigm of theoretical assumptions that
account for social change over an individual’s life (Elder 1998). Three such assumptions are that
social change: (a) occurs between and within cohorts; (b) takes place over an extended period of
time; and (c) is determined by one’s social location across a variety of domains (Mayer 2009).
Cohort is of central importance in the sociological study of change over time. The term
cohort refers to a group of individuals who collectively experience some event at the same time
(Ryder 1965). For example, all individuals who marry in a given year or all women who give
birth in a given year are both examples of cohorts. The most commonly used cohort in the study
of social change over time is the birth cohort, or all individuals born in a given year (Glenn
2005). The birth cohort is an important determinant of individuals’ attitudes toward social
phenomena because the timing of birth provides an anchoring frame of reference and worldview
unique to that cohort that shape attitudes and opinions toward various social phenomena (Alwin
and McCammon 2003). For example, individuals born during the Great Depression who
experienced childhood poverty are likely to hold different viewpoints on social security and
social welfare policy compared to individuals born during the post World-War II era, when the
United States experienced an economic boom on many fronts.
For the purposes of this research, cohort attitudes are individual level characteristics that
are stable across time within any given cohort. However, because each cohort is born in its own
milieu, cohorts may differ from one another in terms of their attitudes. As newly born individuals
replace those who pass away from previous cohorts, they likely bring new ideas, opinions, and
as “cohort succession” (Firebaugh 1997). For instance, individuals in newer birth cohorts belong
to a generation of declining trust in the medical profession (for example, see Blendon, Benson,
and Hero 2014), compared to individuals in older birth cohorts who witnessed the rise of medical
authority and power (Starr 1982). Attitudes toward euthanasia and suicide for terminally ill
persons may also vary directly as a function of these cohort differences in generational attitudes.
Although cohort succession is one way attitudes may change over time, there are two
additional temporal parameters that may account for change over time. The first of those is age.
Age is an important determinant of attitudes because as individuals live longer, they experience
more formative life events that shape their beliefs and opinions (Elder 1994). Accordingly, as
members of any given cohort become older, it is likely that their opinions and attitudes toward
social phenomena change. This process is known as intracohort change (Firebaugh 1997). Age,
or intracohort change, is particularly important in understanding attitudes toward euthanasia and
suicide for terminally ill persons because the transition to late adulthood is when most
individuals experience the onset of multimorbidity, relinquish previously held roles or statuses,
and shift their attention to the management of chronic conditions (Bury 1982; Marengoni et al.
2011). As individuals age with chronic illnesses, strain will be placed on the already fragmented
American health care system (Wiener and Tilly 2002). Attitudes toward euthanasia and suicide
for terminally ill persons will be especially important during this time as older adults
contemplate end of life care, compared to younger adults who may not yet be confronting these
issues.
The third temporal parameter that may account for attitudinal change over time includes
exposure to events that life course sociologists call period effects. Period effects refer to specific
crash of 1929, the civil rights movement of the 1960s, or the terroristic attacks on the United
States on September 11, 2001. Thus, period effects can be thought of as those historical events
that impact all the attitudes of all the people who experience them – largely independent of their
age or cohort membership. To date, previous research on attitudes toward euthanasia and suicide
for terminally ill persons has completely ignored the role of period effects in contributing to
attitudinal change. It is plausible that major historical events in the right to die movement, such
as the passage of the Oregon Death with Dignity Act (Dowbiggin 2003), were key in shaping
public opinion towards euthanasia and suicide for terminally ill persons. Therefore, period
effects are included in my analysis to account for these important moments of history.
Age, period, and cohort effects are synergistic and work together in a longitudinal nature
to account for social change over time. That is, trends in societal attitudes cannot be assessed at
one point in time, but rather must be accounted for using longitudinal data that can account for
age, period, and cohort effects (Glenn 2005). Said another way, to fully understand that nature of
change over time, it is necessary to consider all three temporal parameters (i.e. age, period, and
cohort). Failure to account for all three parameters may lead to incorrect inferences as to why
change is occurring over time.
2.3 Moderation of Cohort Effects
While cohorts hold a central place in shaping individual’s attitudes and opinions, they
cannot wholly account for attitudinal change over time. This is because within cohorts,
individuals are born into stratifications across a variety of social domains, such as race, class,
gender, and sexuality, which all shape the lived experience across the life course (Newman
2003), a process which Mannheim (1972) terms the stratification of experience. Therefore, the
toward social phenomena depend on both an individual’s existence within a cohort as well as
their lived experience along the lines of stratified social domains within that cohort
2.4 Summary and Hypotheses
Synthesizing all of these viewpoints, the life course theoretical perspective frames my
work on attitudinal changes toward euthanasia and suicide for terminally ill persons in several
ways. The theoretical viewpoint posits that attitudinal change is tied to cohorts, perhaps through
cohort succession (i.e. cohort effects), intracohort change (i.e. age effects), or period effects.
Within a cohort, however, these attitudes may also be shaped by the specific location of an
individual within various stratifications, such as race, class, gender, and sexuality.
Taking together the review of previous literature as well as the life-course theoretical
perspective, I test the following hypotheses in this research. Based on the previous trend
research noting the liberalization of attitudes over time (Allen 2006, Benson 1999, DeCesare
2000, Duncan and Parmelee 2006, Moulton, Hill, and Burdette 2006), hypothesis 1 states that
public approval of euthanasia and suicide for terminally ill persons will continue to increase
following the addition of the 2006-2014 GSS data.
Based on a life-course perspective (Firebaugh 1997, Ryder 1965), hypothesis two states
that longitudinal changes in attitudes toward euthanasia and suicide for terminally ill persons are
independently determined by age, period, and cohort effects.
Based on the life course perspective (Mannheim 1972) and previous research noting
cross-sectional demographic differences in attitudes toward the voluntary taking of life
(Blackhall 1999, Burdette, Hill, and Moulton 1999, DeCesare 2000, Finlay 1985, Jorgenson and
Neubecker 1980, Lichtenstein et al. 1997, Wasserman, Clair and Ritchey 2006), hypotheses
of euthanasia and suicide for terminally ill persons is determined by the stratification of
experience. Specifically:
H3a: Women will be less approving of these attitudes.
H3b: Compared to whites, blacks and those reporting “other race” will be less
approving of these attitudes.
H3c: As education increases, support for the voluntary taking of life decreases.
H3d: Democrats will be more approving of these attitudes compared to
republicans.
H3e: Compared to Protestants, Catholics, or Jewish individuals, those who report
no religious affiliation will have the greatest approval of suicide and euthanasia
3 METHODS
The data for this research comes from the cumulative 1977-2014 General Social Survey
(GSS). The GSS monitors public opinion and social change through periodic surveys using a
national probability sample of all English speaking non-institutionalized individuals 18 years of
age and older living in the United States (Smith, Hout, and Marsden 2012). The GSS began as
an annual survey of the U.S. public in 1972 and in 1994 switched to a biannual survey design.
My analysis is restricted to only the years containing focal variables of interest, and therefore
does not include the 1972-1976 annual survey years, and the 1980, 1984, and 1987 survey years.
Pooling the available data for years 1977-2014 creates a dataset of 22 cross-sectional, nationally
representative surveys (N=47,249 prior to listwise deletion), which are ideal for use in
age-period-cohort analyses (Yang and Land 2013). I limited analysis to those individuals with
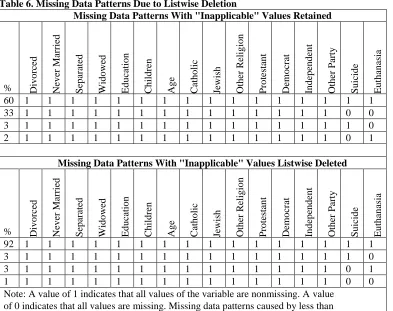
non-missing values on all study variables (N=28,493)4. The GSS is the best data for this analysis
because it is the longest running nationally representative survey of the American public.
3.1 Age-Period-Cohort Analysis
Age-period-cohort (APC) analyses have a long-standing history in the development of
longitudinal research on attitudinal trends. Their early appeal was to social scientists interested
in studying the effects of aging, where traditional experimental methods in the laboratory could
not capture the longitudinal effects of age on attitudinal measures (Glenn 2005). Social scientists
interested in the process of aging and attitudinal change foundered with the use of the
cross-sectional survey as well, because “differences by age shown by cross-cross-sectional data may or may
not be age effects, because the people of different ages are members of different cohorts and may
have been shaped by different formative experiences and influences” (Glenn 2005:3). APC
analysis was developed, therefore, to surpass the problems associated with cross-sectional
findings and to decompose longitudinal change by accounting for the unique role that age
effects, period effects, and cohort effects have in shaping public opinion.
From its inception, APC analysis has suffered from what is referred to as the
“identification problem.” The identification problem refers to the situation in which variance in
the dependent variable of interest cannot be explained because the independent variables are
linear functions of one another. In regard to APC analysis, for example, an individual’s birth
cohort is a linear function of their age and survey year (birth cohort=survey year-age). Vice
versa, age is a linear function of birth cohort and survey year (age=survey year-birth cohort).
Because the variables are linear functions of one another, they will be perfectly collinear and
therefore their effects cannot be simultaneously estimated (Warner 2013). Accordingly,
simultaneously estimating these effects requires special statistical models that until recently have
been unavailable (Yang and Land 2006).
The identification problem has plagued APC analyses for more than thirty years (for
example, see Fienberg and Mason 1979; Glenn 2005; and Mason and Fienberg 1985). In the
past, APC studies have treated period and cohort as fixed effects. Treating the period and cohort
effects as fixed effects, however, runs the risk of violating the assumption of independence of
errors term of ordinary least squared regression because the error term is likely correlated among
members of the same cohort or among people observed during the same period, and assumes that
the impact of level-1 covariates (e.g. age) are equivalent across higher order units (i.e. period and
cohort). In other words, it is predicated on the assumption that the group level variances are
equal and, that there is no between-group variance. In contrast, adding cohort and period random
effects (i.e. variance components) means assuming that members of a particular cohort or period
will be correlated among members of the same cohort or period), but that there is random
variation between groups. A mixed effects model, therefore, is a special case of a hierarchical
model that simultaneously estimates fixed effects and random effects. This technique estimates
the direct effects of periods and cohorts (as well as age) on attitudes toward euthanasia and
suicide for terminally ill people through the fixed effects cohort and period parameters, but also
accounts for any unmeasured period and cohort level heterogeneity through the random effects
parameters (Rabe-Hesketh and Skrondal 2012; Raudenbush et al. 2011; Yang and Land 2008).
In my analysis, I use the APC methods outlined by Yang (2008) and Yang and Land
(2006). Yang and Land circumvent the identification problem by estimating age, period, and
cohort effects utilizing generalized linear mixed modeling (GLMM), specifically cross-classified
mixed effects modeling. Cross-classified mixed effects modeling is a type of hierarchical linear
modeling (HLM). Unlike traditional hierarchical models, cross-classified models take into
account that individuals can be nested within multiple higher order structures, but that those
higher order structures are not necessarily nested within one another. One of the classic examples
of this kind of nesting structure involves students nested within middle schools and high schools.
Some students will go from middle school A to high school Z, but some students from middle
school A will go to high school W. However, in addition to receiving students from middle
school A, some students who attend high school Z will have come from middle schools B and C,
etc. In the case of the Age-Period-Cohort model, the cross-classified design addresses the issue
that some members of cohort A will be alive during period/year Z, and some members of cohort
A will be alive during period/year W. However, members of other cohorts (e.g. cohorts B and C)
3.2 Measures
3.2.1 Dependent Variables
There are two dependent variables in this analysis. The first is a measure of public
opinion on euthanasia. During data collection, respondents were asked the following question:
“when a person has a disease that cannot be cured, do you think doctors should be allowed by
law to end the patient’s life by some painless means if the patient and his family request it?” The
second dependent variable asks participants: “do you think a person has the right to end his or
her own life if this person has an incurable disease?” It is important to note that both of these
questions aim to measure attitudes regarding the ending of life for medical reasons, specifically
terminal illness. The former is a measure of voluntary active euthanasia while the latter is a
measure of active suicide (Huxtable 2013). Both variables are coded as dichotomous indicators,
where 0 represents a response of “no” and 1 represents a response of “yes”.
3.2.2 APC Variables
Age-period-cohort analysis relies on variables that measure individuals’ age at the time of
survey, indicators for the period in which the survey was administered, and a cohort measure that
partitions individuals into conceptually related groups. I use three variables, respectively, to
properly specify the APC analysis. Age is a ratio level variable measured by the age in years of
the respondent at the time of the interview. Year is the period indicator, in this case the year in
which each cross-sectional survey was administered. Finally, cohort refers to the sorting of
individuals into intervals of 10-year birth cohorts, which is determined by subtracting age from
3.2.3 Moderation of Cohort Effects Variables
In order to account for how the stratification of experience affects attitudes toward
euthanasia and suicide for terminally ill persons, I identify several thematically interesting
groups. Female is an indicator of the variable gender that represents all women present in each
of the cross-sectional surveys, while male represents all men present. Male is the reference
category for these two indicators. I also trichotomize the GSS race variable to create three
dummy coded indicators for white race, black race, and other race. White race is the reference
category for the race indicators. I also include a measure of educational attainment, where
education represents each year of formal schooling the respondent has completed. Four
indicators represent political affiliation: Democrat, Republican, Independent, and other party
with Republican as the reference category. Finally, I model religious affiliation with dummy
coded indicators for Protestant, Catholic, Jewish, other religion, and no religious affiliation. For
the religion indicators, no religious affiliation is the reference category. I selected all reference
categories based on the previous research showing that these groups are most likely to support
euthanasia and suicide for terminally ill persons.
3.2.4 Control Variables
I include 2 control measures as level-1 covariates in order to account for any potential
spurious relationships. The first control measure, children, accounts for the number of children
had by each respondent at the time of the survey. The second control measure accounts for
marital status with the indicators married, widowed, divorced, separated, and never married.
Never married is the reference category for the marital status control measure. Previous
researchers failed to include these 2 control measures in their analyses. However, it is plausible
the number of children they have. Marital partners or children may provide social support or a
sense of connectivity that make an individual less likely to support the ending of a life. For these
reasons, I control for the effect of marital status and children in my analysis.
3.3 Plan of Analysis
I begin my analysis with bivariate statistics for the relationships between age, period, and
cohort membership and support for euthanasia and suicide for terminally ill persons. Bivariate
statistics test for a significant relationship between two variables of interest (for example, age
and support for euthanasia), and are therefore an important starting point for subsequent
multivariate analyses that account for the relationship between more than two variables. I
specifically test the bivariate relationships between age, period, and cohort membership and
support for euthanasia and suicide for terminally ill persons using the square test. The
chi-square test utilizes cell counts of tabular data between the two categorical variables of interest.
For the purposes of this chi-square analysis, I categorize age into 5-year age groups, period into
5-year period groups, and birth cohort into 10-year cohort groups. Because support for
euthanasia and suicide for terminally ill persons are dichotomous indicators, they do not need to
be recoded for this analysis. The chi-square test is specified as:
𝜒2 = ∑(𝑓𝑜− 𝑓𝑒) 2
𝑓𝑒 𝑘
𝑖=1
(1)
where 𝑓𝑜 represents the observed cell frequencies in the bivariate table and 𝑓𝑒 represents
expected cell frequencies in the bivariate table.
In addition to the chi-square test, I further examine the bivariate relationship between age
and support for euthanasia and suicide for terminally ill persons with an independent samples
mean scores of a variable of interest. In this case, I test whether the mean age of those who
support euthanasia or suicide differs from those who do not support. While the chi-square test
requires a categorical grouping of age, the independent samples t-test utilizes the original linear
form of age. The independent samples t-test is specified as:
𝑡 = 𝑌̅1− 𝑌̅2
√𝑆𝑌1 2
𝑁1 +
𝑆𝑌22 𝑁2
(2)
where 𝑌̅1 represents the average age of those who support, 𝑌̅2 represents the average age of those
who do not support, 𝑆𝑌21 represents the variance in age of those who support, 𝑆𝑌22 represents the
variance in age of those who do not support, 𝑁1 represents the number of individuals who
support, and 𝑁2 represents the number of people who do not support.
Following the procedures outlined by Yang (2008) and Yang and Land (2006), I estimate
longitudinal changes in attitudes toward euthanasia and suicide for terminally ill persons using
the following equations. Equation 3, which accounts for the level-1 individual age effects, is:
log 𝑃𝑖𝑗𝑘
(1 − 𝑃𝑖𝑗𝑘) = 𝛼𝑗𝑘+ 𝛽1𝑖𝑗𝑘𝐴 + 𝛽2𝑖𝑗𝑘𝐴
2+ 𝛽
3𝑖𝑗𝑘𝐹 + 𝛽4𝑖𝑗𝑘𝐵 + 𝛽5𝑖𝑗𝑘𝑂 + 𝛽6𝑖𝑗𝑘𝐸 + 𝛽7𝑖𝑗𝑘𝐷
+ 𝛽8𝑖𝑗𝑘𝐼 + 𝛽9𝑖𝑗𝑘𝑂𝑃 + 𝛽10𝑖𝑗𝑘𝑃 + 𝛽11𝑖𝑗𝑘𝐶 + 𝛽12𝑖𝑗𝑘𝐽 + 𝛽13𝑖𝑗𝑘𝑂𝑅 + ∑ 𝛽𝑝𝑋𝑝
𝑃
𝑝=5
+ 𝑒𝑖𝑗𝑘, 𝑒𝑖𝑗𝑘~𝑁(0, 𝜎2)
(
(3)
for
𝑖=1, 2, …, 28,493 individuals nested within cohort 𝑗 and period 𝑘;
𝑗=1, …, 11 birth cohorts;
𝑘=1, …, 22 survey years;
where 𝑃𝑖𝑗𝑘 represents the probability of supporting euthanasia or suicide for terminally ill
the indicator for being female, 𝐵 is the indicator for being black, 𝑂 is the indicator for being
“other race”, 𝐸 represents years of education, D is the indicator for being a Democrat, I is the
indicator for being Independent, OP is the indicator for being “other party”, 𝑃 is the indicator for
being Protestant, C is the indicator for being Catholic, and J is the indicator for being Jewish, and
OR is the indicator for belonging to an “other religion.” 𝛽𝑝 represents the vector of regression
coefficients for the control measures outlined above. The equation also accounts for the random
individual effect, 𝑒𝑖𝑗𝑘, which is assumed normally distributed with a mean of 0 and variance 𝜎2
(Yang and Land 2006).
Equations 4.1 through 4.12 represent the level-2 effects:
𝛼𝑗𝑘 = 𝜋0+ 𝑡0𝑗 + 𝑐0𝑘 (4.1)
𝛽3𝑖𝑗𝑘= 𝜋3+ 𝑐3𝑘+ 𝜎𝑘3 (4.2)
𝛽4𝑖𝑗𝑘 = 𝜋4+ 𝑐4𝑘+ 𝜎𝑘4 (4.3)
𝛽5𝑖𝑗𝑘= 𝜋5+ 𝑐5𝑘+ 𝜎𝑘5 (4.4)
𝛽6𝑖𝑗𝑘= 𝜋6+ 𝑐6𝑘+ 𝜎𝑘6 (4.5)
𝛽7𝑖𝑗𝑘= 𝜋7+ 𝑐7𝑘+ 𝜎𝑘7 (4.6)
𝛽8𝑖𝑗𝑘= 𝜋8+ 𝑐8𝑘+ 𝜎𝑘8 (4.7)
𝛽9𝑖𝑗𝑘 = 𝜋9+ 𝑐9𝑘+ 𝜎𝑘9 (4.8)
𝛽10𝑖𝑗𝑘 = 𝜋10+ 𝑐10𝑘 + 𝜎𝑘10 (4.9)
𝛽11𝑖𝑗𝑘 = 𝜋11+ 𝑐11𝑘 + 𝜎𝑘11 (4.10)
𝛽12𝑗𝑘 = 𝜋12+ 𝑐12𝑘 + 𝜎𝑘12 (4.11)
𝛽13𝑖𝑗𝑘 = 𝜋13+ 𝑐13𝑘 + 𝜎𝑘13 (4.12)
Equation 4.1 specifies the period and cohort effects, where 𝛼𝑗𝑘 is the random intercept
accounting for the mean variation from period to period and cohort to cohort, 𝜋0 is the grand
mean when all level 1 variables equal zero, 𝑡0𝑗 is the random period effect, and 𝑐0𝑘 is the random
cohort effect. Equations 4.2 thru 4.12 specify the cohort moderation effects of the level 1
variables, 𝑐3𝑘… 𝑐13𝑘 represent the cohort variation for each of the level 1 demographic variables,
and 𝜎𝑘3… 𝜎𝑘13 represent the random variance components (error variances) of the cohort effects.
Combining equations 3 thru 4.12 yields the fully specified cross-classified mixed effects
APC model:
log 𝑃𝑖𝑗𝑘
(1 − 𝑃𝑖𝑗𝑘)
= 𝜋0+ 𝛽1𝑖𝑗𝑘𝐴 + 𝛽2𝑖𝑗𝑘𝐴2+ ∑ [𝜋𝑝𝑋𝑝+ 𝑐𝑝𝑘𝑋𝑝+ 𝜎𝑘𝑝𝑋𝑝] 𝑃
𝑝=11
+ ∑ 𝐵𝑝𝑋𝑝 𝑃
𝑝=5
+ 𝑡0𝑗+ 𝑐0𝑘+ 𝑒𝑖𝑗𝑘, 𝑒𝑖𝑗𝑘~𝑁(0, 𝜎2)
(
(5)
for
𝑖=1, 2, …, 28,493 individuals nested within cohort 𝑗 and period 𝑘;
𝑗=1, …, 11 birth cohorts;
4 RESULTS
Summary statistics for all variables in the analysis are presented in Table 1. A majority
of individuals support both euthanasia (67%) and suicide for terminally ill persons (56%) across
all survey years. The average age of respondents was 45.55 years (S.D.=17.37 years), with the
youngest person in the sample being 18 years of age and the oldest person in the sample being 89
years of age. There were more women (56%) than men (44%) in the sample. White individuals
(81%) compromised the majority of the sample, followed by Black individuals (14%) and
relatively few individuals reporting “other race” (5%). On average, individuals in this sample
completed a high school education (M=12.93 years, S.D.=3.12 years). Most individuals had at
least 1 child (M=1.91, S.D.=1.76). Regarding marital status, 48% of individuals were married at
the time of the survey, 22% were never married, 13% were divorced, 9% were widowed, and 4%
were separated. Almost half (49%) of the individuals were Democrats, while 36% were
Republicans, 14% were Independent, and 1% belonged to another political party. Over half of
the individuals were Protestant (57%), while 25% were Catholic, 12% reported no religious
preference, 2% were Jewish, and 4% reported belonging to another religion.
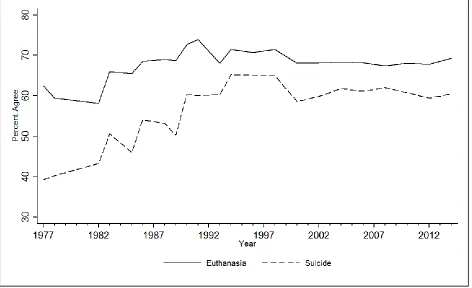
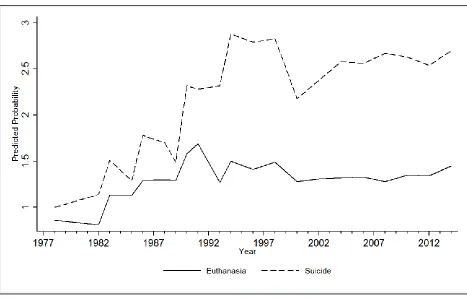
The 1977-2014 time-period trends for attitudes toward euthanasia and suicide for
terminally ill persons are displayed graphically in figure 1. The displayed trends represent the
percentage of individuals in each survey year who support euthanasia or suicide. From 1977 to
1982, support for euthanasia declines from 62 percent to 58 percent. From 1983 (66 percent
support) to 1998 (71 percent support) there is a stable increase in support for euthanasia, despite
several small decreases in support in the years 1985 (65 percent support) and 1993 (68 percent
support). Beginning in the year 2000, support for euthanasia drops slightly to 68 percent, where
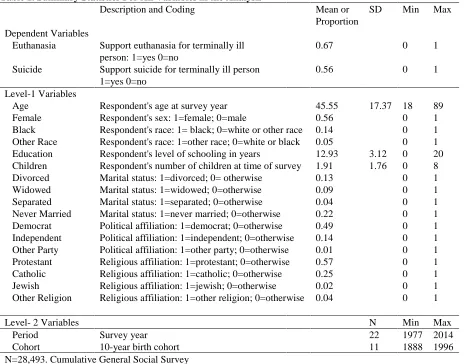
Table 1. Summary Statistics For All Variables in the Analysis
Description and Coding Mean or SD Min Max Proportion
Dependent Variables
Euthanasia Support euthanasia for terminally ill 0.67 0 1 person: 1=yes 0=no
Suicide Support suicide for terminally ill person 0.56 0 1 1=yes 0=no
Level-1 Variables
Age Respondent's age at survey year 45.55 17.37 18 89 Female Respondent's sex: 1=female; 0=male 0.56 0 1 Black Respondent's race: 1= black; 0=white or other race 0.14 0 1 Other Race Respondent's race: 1=other race; 0=white or black 0.05 0 1 Education Respondent's level of schooling in years 12.93 3.12 0 20 Children Respondent's number of children at time of survey 1.91 1.76 0 8 Divorced Marital status: 1=divorced; 0= otherwise 0.13 0 1 Widowed Marital status: 1=widowed; 0=otherwise 0.09 0 1 Separated Marital status: 1=separated; 0=otherwise 0.04 0 1 Never Married Marital status: 1=never married; 0=otherwise 0.22 0 1 Democrat Political affiliation: 1=democrat; 0=otherwise 0.49 0 1 Independent Political affiliation: 1=independent; 0=otherwise 0.14 0 1 Other Party Political affiliation: 1=other party; 0=otherwise 0.01 0 1 Protestant Religious affiliation: 1=protestant; 0=otherwise 0.57 0 1 Catholic Religious affiliation: 1=catholic; 0=otherwise 0.25 0 1 Jewish Religious affiliation: 1=jewish; 0=otherwise 0.02 0 1 Other Religion Religious affiliation: 1=other religion; 0=otherwise 0.04 0 1
Level- 2 Variables N Min Max
Period Survey year 22 1977 2014
Cohort 10-year birth cohort 11 1888 1996 N=28,493. Cumulative General Social Survey
year 2014. Overall, for the past 37 years, support for euthanasia for terminally ill persons has
increased by 7 percentage points, from 62 percent in 1977 to 69 percent in 2014.
From 1977 to 1982, support for suicide increases from 39 percent to 43 percent. From
1983 (50 percent support) to 1998, (65 percent support) there is a stable increase in support for
suicide, despite several small decreases in support in the years 1985 (46 percent support), 1989
(50 percent support), and 1993 (60 percent support). Support for suicide for terminally ill
persons drops between the years 1998 (65 percent support) and 2000 (58 percent support).
Figure 1. Support for Euthanasia and Suicide Over Time
relatively stable, fluctuating between 59 to 62 percent. Overall, for the past 37 years support for
suicide for terminally ill persons has increased by 21 percentage points, from 39 percent in 1977
to 60 percent in 2014.
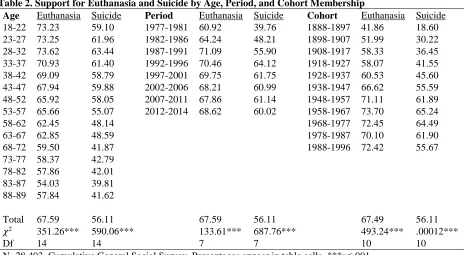
Bivariate statistics for the relationship between age, period, and cohort membership and
support for euthanasia and suicide for terminally ill persons are displayed in Table 2. As age
increases the percentage of individuals supporting euthanasia (𝜒2(14)=351.26, p≤.001) and
suicide (𝜒2(14)=590.06, p≤.001) generally decreases. One exception to this trend is the peak in
support for suicide among the 28-32 year old age group, after which support for suicide
continues to decrease. The results of the independent samples t-test indicate that those who
Table 2. Support for Euthanasia and Suicide by Age, Period, and Cohort Membership
Age Euthanasia Suicide Period Euthanasia Suicide Cohort Euthanasia Suicide 18-22 73.23 59.10 1977-1981 60.92 39.76 1888-1897 41.86 18.60 23-27 73.25 61.96 1982-1986 64.24 48.21 1898-1907 51.99 30.22 28-32 73.62 63.44 1987-1991 71.09 55.90 1908-1917 58.33 36.45 33-37 70.93 61.40 1992-1996 70.46 64.12 1918-1927 58.07 41.55 38-42 69.09 58.79 1997-2001 69.75 61.75 1928-1937 60.53 45.60 43-47 67.94 59.88 2002-2006 68.21 60.99 1938-1947 66.62 55.59 48-52 65.92 58.05 2007-2011 67.86 61.14 1948-1957 71.11 61.89 53-57 65.66 55.07 2012-2014 68.62 60.02 1958-1967 73.70 65.24
58-62 62.45 48.14 1968-1977 72.45 64.49
63-67 62.85 48.59 1978-1987 70.10 61.90
68-72 59.50 41.87 1988-1996 72.42 55.67
73-77 58.37 42.79 78-82 57.86 42.01 83-87 54.03 39.81 88-89 57.84 41.62
Total 67.59 56.11 67.59 56.11 67.49 56.11
𝜒2 351.26*** 590.06*** 133.61*** 687.76*** 493.24*** .00012***
Df 14 14 7 7 10 10
N=28,493. Cumulative General Social Survey. Percentages appear in table cells. ***p≤.001
average 4 years younger than those who do not support (mean age=48.31 years, SD=17.88
years), t (28,491)=18.68, p≤.001. Similarly, those who support suicide for terminally ill persons
(mean age=43.52 years, SD=16.45 years) are on average 5 years younger than those who do not
support (mean age=48.15, SD=18.15 years), t (28,491)= 22.53, p≤.001.
Regarding the period effects, support for euthanasia (𝜒2(7)=133.61, p≤.001) and suicide
(𝜒2(7)=687.76, p≤.001) increases from 1977 to 1996, decreases slightly beginning in 1997, and
remains relatively stable throughout the remainder of the survey years. Despite these small
fluctuations, there is an overall liberalization of support for both measures. From 1977 to 2014,
support for euthanasia increases by almost 8 percent while support for suicide for terminally ill
persons increases by 20 percent. Finally, there is an inverse relationship between
cohort membership and support for euthanasia (𝜒2(14)=351.26, p≤.001) and suicide
(𝜒2(14)=351.26, p≤.001), in which the oldest birth cohorts have the lowest percentages of
suicide, where there is a 37-percentage point difference in support between those in the oldest
and youngest birth cohort. For support for euthanasia, there is a 30-percentage point difference
between the oldest and youngest birth cohort. While these bivariate findings point towards
significant age, period, and cohort effects, it remains unclear whether each of these stand-alone
effects remains significant after accounting for the other temporal parameters.
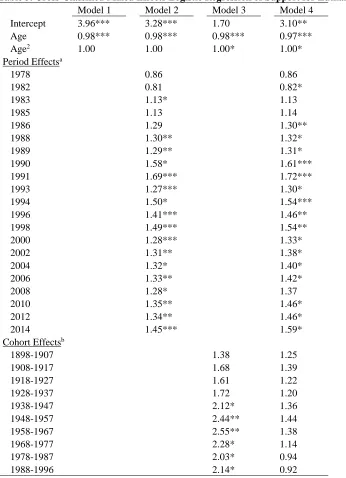
Accordingly, APC models were estimated to assess the conjoined influence of age,
period, and cohort in a multivariable framework. The odds ratio estimates for the
cross-classified mixed effects model of support for euthanasia for terminally ill persons are displayed
in Table 3. Model 1 estimates a bivariate linear and quadratic relationship between age and
support for euthanasia. While there is no significant quadratic relationship in this bivariate
model, there is a significant negative linear effect; for every one year increase in age the odds of
supporting euthanasia for terminally ill persons decreases by 2 percent (odds=0.98, p≤.001).
Model 2 estimates individual level age effects as well as period effects modeled on the individual
level intercept. The linear age effect in model 1 remains significant in model 2 (odds=0.98,
p≤.001). Beginning in 1983, the period effects in model 2 show a small but stable increase in
support for euthanasia over time. For example, those interviewed in 1983 are 13 percent more
likely to support euthanasia (odds=1.13, p≤.05) compared those interviewed in 1977. By the
year 1993, individuals are 27 percent more likely to support (odds=1.27, p≤.001), by the year
2004 individuals are 32 percent more likely to support (odds=1.32, p≤.05), and by the year 2014
individuals are 45 percent more likely to support (odds=1.45, p≤.001).
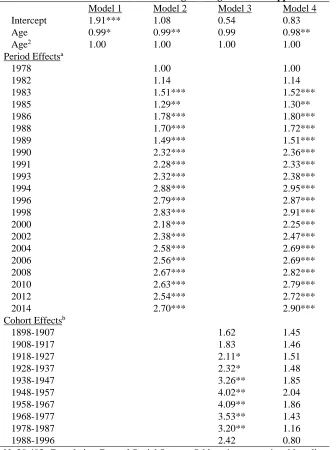
Model 3 estimates individual level age effects as well as cohort effects, also modeled on
Table 3. Cross-Classified Mixed Effects Logistic Regression of Support for Euthanasia Model 1 Model 2 Model 3 Model 4
Intercept 3.96*** 3.28*** 1.70 3.10** Age 0.98*** 0.98*** 0.98*** 0.97***
Age2 1.00 1.00 1.00* 1.00*
Period Effectsa
1978 0.86 0.86
1982 0.81 0.82*
1983 1.13* 1.13
1985 1.13 1.14
1986 1.29 1.30**
1988 1.30** 1.32*
1989 1.29** 1.31*
1990 1.58* 1.61***
1991 1.69*** 1.72***
1993 1.27*** 1.30*
1994 1.50* 1.54***
1996 1.41*** 1.46**
1998 1.49*** 1.54**
2000 1.28*** 1.33*
2002 1.31** 1.38*
2004 1.32* 1.40*
2006 1.33** 1.42*
2008 1.28* 1.37
2010 1.35** 1.46*
2012 1.34** 1.46*
2014 1.45*** 1.59*
Cohort Effectsb
1898-1907 1.38 1.25
1908-1917 1.68 1.39
1918-1927 1.61 1.22
1928-1937 1.72 1.20
1938-1947 2.12* 1.36
1948-1957 2.44** 1.44
1958-1967 2.55** 1.38
1968-1977 2.28* 1.14
1978-1987 2.03* 0.94
1988-1996 2.14* 0.92
N=28,493. Cumulative General Social Survey. Odds ratios appear in table cells. *p≤.05, **p≤.01, ***p≤.001; a: reference=1977; b: reference=1888-1897
p≤.001) and quadratic (odds=1.00, p≤.05) age effects. Beginning with the 1938 to 1947 birth
cohort, there are strong positive increases in support for euthanasia, with individuals born into
born between 1958 and 1967, who are 2.55 times more likely to support euthanasia compared to
those born between 1888 and 1897 (odds=2.55, p≤.001).
Model 4 estimates the full APC model of support for euthanasia for terminally ill
persons. While model 2 accounts for period-to-period variation and model 3 accounts for
cohort-to-cohort variation in support for euthanasia, model 4 simultaneously accounts for both of
these level-2 effects while also controlling for the level-1 age effects. In the full APC model,
there are significant linear (odds=0.97, p≤.001) and quadratic (odds=1.00, p≤.05) age effects.
The period effects in model 4 indicate that controlling for the age and cohort effects, there is a
small but significant curvilinear relationship in the odds of supporting euthanasia over time.
Beginning in 1983, the odds of support steadily increases, peaking in the year 1991 (odds=1.72,
p≤.001). From 1993 onward, the odds of support remain greater compared to the year 1977 but
exhibit several small fluctuations, namely in the years 1994 (odds=1.54, p≤.01) and 2000
(odds=1.33, p≤.05). By 2014, the odds of supporting euthanasia are 59 percent more likely than
in 1977 (odds=1.59, p≤.05).
The estimates of model 4 also indicate that controlling for the age and period effects,
there are no significant cohort effects that contribute to attitudes toward euthanasia for terminally
ill persons. Therefore, when simultaneously estimating the effect of age, period, and cohort
membership on attitudes toward euthanasia, the statistically significant cohort effects observed in
model 3 (in which period effects are not controlled for) no longer remain significant. Because
the cohort parameters in the full APC model are not significant, model 2 (which accounts for age
and period effects) is retained as the best model predicting attitudes toward euthanasia. The
predicted probabilities of support for euthanasia by age and period from model 2, discussed
Figure 2. Predicted Probability of Support for Euthanasia and Suicide by Age
[image:41.612.74.541.397.695.2]The odds ratio estimates for the cross-classified mixed effects model of support for
suicide for terminally ill persons are displayed in Table 4. Model 1 estimates a bivariate linear
and quadratic relationship between age and support for suicide. While there is no significant
quadratic relationship in this bivariate model, there is a significant negative linear effect; for
every one year increase in age the odds of supporting suicide for terminally ill persons decreases
by 1 percent (odds=0.99, p≤.001). Model 2 estimates individual level age effects as well as
period effects. The negative linear age effect in model 1 remains significant in model 2
(odds=0.99, p≤.001). Beginning in 1983, the period effects in model 2 show a general increase
in the odds of supporting suicide over time. Model 3 estimates individual level age effects as
well as cohort effects. Beginning with the 1918 to 1927 birth cohort, there are strong positive
increases in support for suicide, with individuals born into newer birth cohorts more likely to
support euthanasia. This cohort effect is greatest for those born between the years 1958 and
1967, who are 4.09 times more likely to support suicide for terminally ill persons compared to
those born between 1888 and 1897 (odds=4.09, p≤.01).
Model 4 estimates the full APC model of support for suicide for terminally ill persons. In
the full APC model, there is a significant negative linear age effect (odds=0.97, p≤.001). Net of
the effect of period and cohort, for every one year increase in age, the odds of supporting suicide
decrease by 3 percent. The period effects in model 4 indicate that controlling for the effects of
age and cohort, there is a steady increase in the odds of supporting suicide over time. Beginning
in 1983, the odds of support increases, peaking in the year 1994 (odds=1.72, p≤.001). From
1994 onward, the odds of support remain greater compared to the year 1977 but exhibit several
small fluctuations, namely in the year 2000 (odds=2.25, p≤.001). By 2014, the odds of
Table 4. Cross-Classified Mixed Effects Logistic Regression of Support for Suicide Model 1 Model 2 Model 3 Model 4 Intercept 1.91*** 1.08 0.54 0.83
Age 0.99* 0.99** 0.99 0.98**
Age2 1.00 1.00 1.00 1.00
Period Effectsa
1978 1.00 1.00
1982 1.14 1.14
1983 1.51*** 1.52***
1985 1.29** 1.30**
1986 1.78*** 1.80***
1988 1.70*** 1.72***
1989 1.49*** 1.51***
1990 2.32*** 2.36***
1991 2.28*** 2.33***
1993 2.32*** 2.38***
1994 2.88*** 2.95***
1996 2.79*** 2.87***
1998 2.83*** 2.91***
2000 2.18*** 2.25***
2002 2.38*** 2.47***
2004 2.58*** 2.69***
2006 2.56*** 2.69***
2008 2.67*** 2.82***
2010 2.63*** 2.79***
2012 2.54*** 2.72***
2014 2.70*** 2.90***
Cohort Effectsb
1898-1907 1.62 1.45
1908-1917 1.83 1.46
1918-1927 2.11* 1.51
1928-1937 2.32* 1.48
1938-1947 3.26** 1.85
1948-1957 4.02** 2.04
1958-1967 4.09** 1.86
1968-1977 3.53** 1.43
1978-1987 3.20** 1.16
1988-1996 2.42 0.80
N=28,493. Cumulative General Social Survey. Odds ratios appear in table cells. *p≤.05, **p≤.01, ***p≤.001; a: reference=1977; b: reference=1888-1897
The estimates of model 4 also indicate that controlling for the effects of age and period,
there are no significant cohort effects that contribute to attitudes toward suicide for terminally ill
persons. Just as with the full APC model for support for euthanasia, when simultaneously
estimating the effect of age, period, and cohort membership on attitudes toward suicide, the
controlled for) no longer remain significant. Because the cohort parameters in the full APC
model are not significant, model 2 (which accounts for age and period effects) is retained as the
best model predicting attitudes toward suicide for terminally ill persons. The predicted
probabilities of support for suicide by age and period from model 2, discussed above, are
graphically displayed in figures 2 and 3.
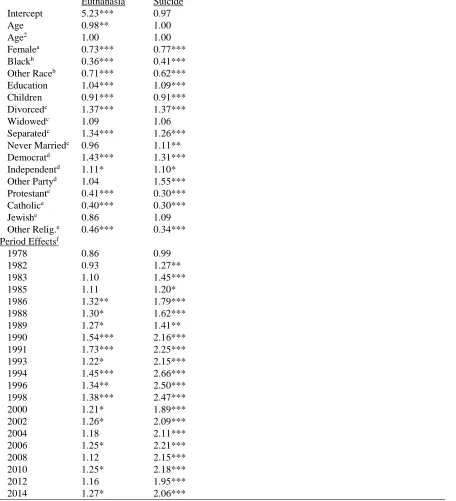
The odds ratio estimates for the period effects with level-1 covariates are displayed in
table 5. While both of the 2nd models in tables 3 and 4 are retained as the best predicting APC
models of attitudes toward euthanasia and suicide for terminally ill persons, it is important to
include level-1 covariates to control for any potentially spurious relationships at the individual
level. Therefore, in addition to level-1 age effects and level-2 period effects, these models
account for gender, race, educational attainment, number of children, marital status, political
party affiliation, and religious ideology at the individual level. The results indicate that
compared to men, women are 27 percent less likely (odds=0.73, p≤.001) to support euthanasia
and 23 percent less likely (odds=0.77, p≤.001) to support suicide. Compared to white
individuals, black individuals are 64 percent less likely (odds=0.36, p≤.001) to support
euthanasia and 59 percent less likely (odds=0.41, p≤.001) to support suicide. Compared to white
individuals, those individuals who report being “other race” are 29 percent less likely
(odds=0.71, p≤.001) to support euthanasia and 38 percent less likely (odds=0.62, p≤.001) to
support euthanasia.
Regarding education, for every one year increase in years of school completed, the odds
of supporting euthanasia increase by 4 percent (odds=1.04, p≤.001) and the odds of supporting
suicide increase by 9 percent (odds=1.09, p≤.001). There is a negative relationship between