Hydrological impacts of floodplain restoration: a case study of the
River Cherwell, UK
M.C. Acreman
1, R. Riddington
2and D.J. Booker
11Centre for Ecology and Hydrology, Wallingford, OX10 8BB, UK 2Peter Brett Associates,Westcote Road, Reading, RG30 2DE, UK
Email for corresponding author: [email protected]
Abstract
This paper investigates the impacts on floods of hypothetical changes to river channel geometry by construction or removal of embankments to prevent water spreading onto the floodplain at high flows. A numerical model is applied to the River Cherwell between Oxford and Banbury to simulate changes to flood hydrographs. Embanking the river increases the peak flows downstream by 50-150%. Restoring the river channel through the floodplain to pre-engineered dimensions reduces peak flow by around 10-15% and increases peak water levels within the floodplain by 0.5-1.6m. These results suggest that floodplain rehabilitation, in terms of embankment removal or returning the channel to pre-engineered dimensions, can be a valuable part of the flood management strategy of a catchment. Both measures lead to increased inundation of the floodplain, which can be positive for ecological restoration.
Keywords: floodplains, hydrological impacts, rehabilitation, flood frequency
Introduction
Floodplains are the flat land adjacent to rivers created by the deposition of sediment as the channel migrates laterally (Marriot, 1998) and are inundated during floods (Nanson and Croke, 1992). Fine river sediments deposited on floodplains provide rich farmland and flat land for building next to a transport axis. The characteristics of floodplains nurtured some of the great civilisations of the world along the Nile, Indus and Tigris/Euphrates (Mitsch and Gosselink, 1993). Lateral connectivity between rivers and their floodplains during inundation is a key driving force for the river ecosystem (Junk et al., 1989). Rivers provide the floodplain with nutrients and sediment, whilst the floodplain provides a breeding ground for river species and improves water quality through settlement of sediment, and absorption and re-cycling of nutrients and pollutants (Brookes and Shields, 1996).
It is widely recognised that the storage of floodwater on floodplains can reduce flood magnitude downstream. The UK Flood Studies Report (Natural Environment Research Council, 1975) documented the attenuation of flood peaks on the River Wye. Sutcliffe and Parks (1989) reported that
large floodplain wetlands in West Africa including the Okavango and Sudd reduce flood peaks. Similar results for floodplains in India were found by Nielsen et al. (1991) and in West Africa by John et al. (1993). Hooijer (1996) calculated that flooding of 3500 ha of floodplain in the Shannon valley, Ireland, to an average depth of 1 m represented a storage equivalent to one day of peak discharge (around 400 m3s–1). The US Corps of Engineers (1972)
calculated that the flood reduction function of 3800 hectares of floodplain storage on the Charles River, Massachusetts saved US$ 17 million worth of downstream flood damage each year. These studies have demonstrated the flood attenuation properties of floodplains by considering flow hydrographs upstream and downstream. The impacts of isolating the floodplain by embankments and of changes to channel geometry have not been studied.
floodplains, degraded their ecological functioning and eliminated their flood attenuation properties. The magnitude of the 1994 floods on the Rhine was blamed partly on loss of floodplain storage upstream. As part of the flood alleviation strategy of the lower Rhine, embankments are being removed to restore this function (Schropp and Jans, 2000).
This paper describes the modelling and results of the hydrological impacts of hypothetical floodplain restoration on the River Cherwell in Oxfordshire, England. The findings are of generic value.
The River Cherwell
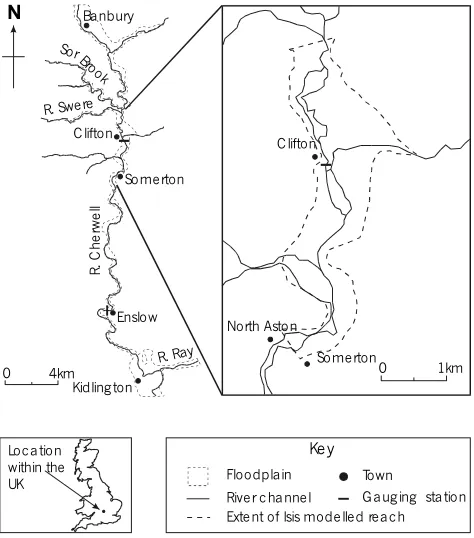
The River Cherwell is a tributary of the Thames, running north–south in central England. At Oxford, where it joins the Thames, the Cherwell catchment has a drainage area of 910 km2 and a mean annual rainfall of 682 mm. The
catchment is predominantly rural with a population of 137 000 concentrated in towns, including Banbury and Kidlington, which are sited next to the river (Fig. 1). The underlying soil is predominantly impervious Lias clay. Only a small part of the catchment overlays Oolite limestone; hence the flow regime is flashy and baseflow is a minor component. The Cherwell has one major tributary, the River Ray, though there are many minor tributaries along its length.
The Oxford canal runs along the Cherwell for much of its course and they share the same channel for 1.5 km in the middle reach, complicating the hydrology of the catchment. Apart from some flooding in Banbury in 1947, the town was not thought to be significantly at risk until Easter (April) 1998, when 60 domestic and several large commercial properties including the Thames Water supply treatment works were inundated (Bye and Horner, 1998). An additional 90 residential properties were flooded in Kidlington and a further 20 in smaller settlements along the Cherwell valley. One aim of this modelling study was to determine whether floodplain restoration could play a role in flood management in a catchment like the Cherwell.
Defining hydrological impacts and
floodplain restoration
The hydrological model application had two primary objectives. The first objective was to assess the impacts on flood frequency downstream of floodplain restoration. It was hypothesised that restoration of floodplains upstream of Kidlington and Banbury might reduce flood risk in these towns. The second objective was to assess the increased inundation of the floodplain itself as a means of rehabilitation of their wetlands. Three floodplains within the Cherwell catchment were selected for restoration studies: (1) above Banbury (2) in the middle Cherwell and (3) Otmoor on the River Ray. The study used purely hypothetical scenarios and no restoration work on any of these floodplains was undertaken or is currently planned. This paper focuses on results for the middle Cherwell.
In the strict sense, floodplain restoration is the re-establishment of the structure and function of an ecosystem (National Research Council, 1992) to a more or less natural condition. In the present study, restoration is used to mean returning the river and floodplain to a recent (1900) pre-engineered state. Specifically, two rehabilitation measures were envisaged. The first was removal of embankments separating the river from its floodplain. The second was reduction of the width and bankfull depth of a widened and deepened river to its pre-engineered dimensions so that floodplain inundation commences at lower flows.
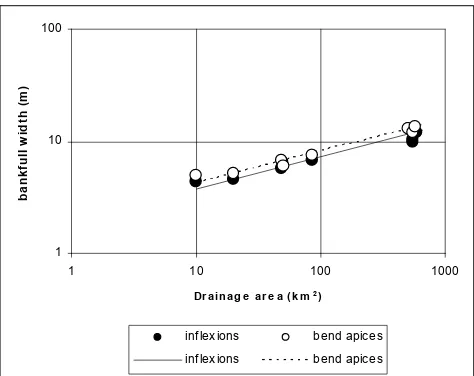
Historical maps, field surveys and air photos were used to determine the dimensions of pre-engineered channels in the catchment (Darby and Sear, 2001); these were used to develop linear relationships between catchment area and natural channel width (Fig. 2) and bankfull depth for both bend apices and inflection points. These relationships were then applied at rehabilitation sites to define the dimensions of the rehabilitated channels.
Banbury Kidlington Somerton Somerton North Aston Clifton R. Ch e rw el l Enslow 0 1km 0 4km N Clifton Town
Gauging station Extent of Isis modelled reach
Key Floodplain River channel
Sor Bro
ok R. Swere R. Ray Location within the UK
[image:2.595.46.283.432.701.2]Hydrological and hydraulic modelling
In this study, hydrological and hydraulic models were used so that the implications of changes in the river channel (e.g. narrowing) or river-floodplain connection (e.g. removal of embankments) could be predicted without actually implementing the changes. Furthermore, the models could assess the outcomes of specific hydrological circumstances, such as very heavy rainfall. A semi-distributed continuous simulation rainfall-runoff model called CLASSIC (Climate and Land-use Scenario Simulation In Catchments) developed by Crooks et al. (2000) was applied to transform rainfall over the catchment to river flow at key locations at the upstream boundary of floodplain areas. This model was applied on a 5 km grid square framework using climatic inputs of rainfall and potential evaporation (PE) and incorporated three component modules: a soil water balance module to determine effective rainfall, a drainage module which has three forms to model drainage response patterns for different soil types and a simple channel routing module. The model was developed initially to estimate the impacts of climate and land use change in large catchments and has been tested on the Thames, Severn and Trent drainage basins (Crooks et al., 1996). CLASSIC, was further developed during the EUROTAS (European River Flood Occurrence and Total Risk Assessment System) project so that it could be calibrated semi-automatically and be applied to a wider range of catchment areas.
A one-dimensional hydro-dynamic model called iSIS (Halcrow / HR Wallingford, 2001) was applied to predict water level, given inflows from CLASSIC, within the floodplain and to route the flow along the river channel and through the floodplain to critical points downstream. iSIS
is an industry-standard model (Crowder et al., 1997) used for modelling both steady and unsteady flow in networks of open channels and floodplains. iSIS comprises an integrated modular structure. The hydrodynamic module (iSIS Flow) provides a solution of the Saint Venant equations for unsteady flow, with options for simulation of simple backwaters, flow routing and full unsteady simulation. iSIS Flow is able to model complex looped and branched networks and has been designed to provide a comprehensive range of methods for simulating floodplain flows.
Model calibration
CLASSIC was applied using rainfall and PE data determined for each grid square. Rainfall was spatially interpolated from appropriate rain gauge data using an automated version (Gannon, 1995) of the CEH triangle method (Jones, 1983). Data for 1999 to April 2001 were used. PE values for grass were derived by interpolation from the 40 km resolution MORECS (Meteorological Office Rainfall and Evaporation Calculation System) data supplied by the Meteorological Office. Two spatial data sets, for land cover (Fuller, 1993) and soil type (Boorman et al., 1995), available for 50 m and 1 km grid squares respectively, were used to determine appropriate PE values for the 5 km CLASSIC grid. Flow data for two gauging stations on the Cherwell, at Banbury and Enslow, and on the Sor Brook, at Bodicote, were used for model calibration. Rainfall for five recording rain gauges in the Cherwell catchment for several events between 1990 and 2001 defined hourly rainfall profiles. However, the records from these gauges are patchy and most stopped working at some time during the flood event of April 1998; as a result, measurements from other gauges, including those in adjacent catchments were interpolated. CLASSIC was applied and calibrated using an hourly time step. Grid square parameter values obtained for Banbury, Enslow and Bodicote were used for sub-catchment modelling. The rainfall runoff model covered 82% of the catchment to Somerton, so inflows to the model were increased by multiplying each flow by 1.22.
Boundary conditions for the iSIS model were constructed for the Cherwell river channel and its floodplain between Nell Bridge and Somerton Bridge. Extended cross-sections were used to simulate the floodplain, which is approximately 5 km in length and up to 1 km wide. Three sources of data were used to define the cross-sections.
z Laser Induced Direction and Range (LIDAR), an airbourne remote sensing technique producing a 1 × 1 m grid of spot heights to a vertical resolution of 0.1 m (e.g. Marks and Bates, 2000).
1 10 100
1 10 100 1000
Dr ain ag e ar e a (k m2)
ba nk fu ll w id th (m )
inf lex ions bend apices
inf lex ions bend apices
[image:3.595.57.294.68.256.2]z Topographic maps at a scale of 1 : 10 000 with contours
at a height interval of 5 m. Although these data are not sufficiently accurate to produce detailed topography for the model, they do indicate general levels and the extent of the flat land on either side of the river that forms the floodplain.
z Historical surveys. Data from various topographic land
surveys exist for parts of the Cherwell catchment.
River flow and level measurements were made at a temporary gauging station at Somerton (downstream of the floodplain) for the period July 2000–June 2001. In addition, water levels were recorded at Clifton Bridge (in the middle of the floodplain). Throughout the winter of 2000–2001, the River Cherwell (in common with many other rivers in the UK) experienced several flood events. The period of 21st October 2000 to 21st December 2000 was selected for calibration of the model.
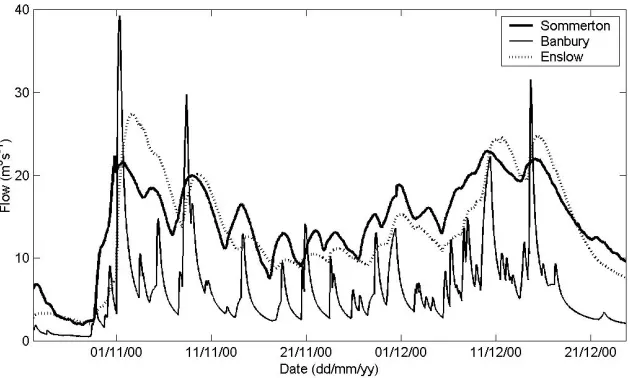
Figure 3 shows the flow hydrograph for the calibration period for the temporary gauging station at Somerton compared with data from the Environment Agency permanent gauging stations at Banbury and Enslow. Enslow station is a compound Crump weir; by-passing occurs during high flows, so it is not ideal for flood analysis. Although Somerton is approximately equidistant between Banbury and Enslow, the relative timing of the hydrographs varies through the period. In general, the Somerton hydrograph peaks mid-way between the Banbury and Enslow hydrographs. However, at times it peaks simultaneously or slightly before Banbury. This reflects the spatial variations in rainfall during the period and the effects of variations in inflows from the various tributaries.
A calibration exercise was conducted to find the values
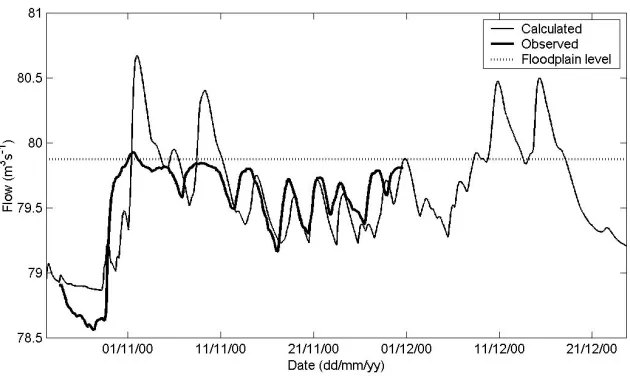
of Manning’s roughness, between 0 and 0.12, which gave the least differences between observations and calculations; a value of 0.05 for the river channel produced the best fit against the Somerton data. Due to the floodplain being modelled via extended cross-sections, a Manning’s roughness of 0.0 was used for the floodplain. This allows water storage within the floodplain component of the simulated cross-sections. As there are very low gradients on the floodplain, a higher roughness value is not required to retard calculated velocities. This technique does not allow for any conveyance within the floodplain. No allowance was made for evaporation or for infiltration of floodwater into the floodplain, both of which were considered to be very small quantities during the event. Three characteristics are evident from the observed and calculated flows at Somerton Bridge (Fig. 4):
1. the volume of flow calculated is 91% of the observed volume;
2. the calculated flow hydrograph is delayed with respect to the observed flows by 24 hours;
3. the calculated peak flows exceed those observed for higher flows, above 20 m3s–1, but underestimate for the
range 10–15 m3s–1.
Maps or satellite images (e.g. Horritt and Bates, 2001) of flooded area have been used to test predictions of floodplain inundation, but such data were not available for the Cherwell. Figure 5 shows observed and calculated river levels upstream of Clifton Bridge within the floodplain. The observations were not used in model calibration and thus provide an independent check on model performance. Delayed timing of the calculated levels and over-estimation
[image:4.595.135.450.519.708.2]Fig. 4. Observed and calculated flows at Somerton Bridge.
Fig. 5. Observed and modelled river levels upstream of Clifton Bridge
of peak levels is evident. Overestimation of the water levels occurs whenever water levels exceed bankfull level. This is a characteristic of modelling the floodplain as an extended section with 0.0 Manning’s roughness. The maximum gauged discharge at the Somerton temporary gauging station was 12.9 m3s–1, which is approximately bankfull. Above
this point, stage would be expected to increase less rapidly with an increase in flow. Thus, flows greater than 13 m3s–1
are probably underestimated by a straight extrapolation of the rating curve. The greater peak flows estimated by the model are consistent with this hypothesis. Overall, the comparisons between observed and predicted flows are similar to those presented elsewhere (e.g. Bates et al., 2000). Given that the objective of the study was to consider the
general impacts of floodplain restoration and not to design any specific river engineering infrastructure, the calibration shown in Fig. 5 is acceptable.
Model results
Models were constructed for three scenarios:
1. the current floodplain and channel — at a typical cross-section, the top of bank width is 18.5 m, the bed width 7.2 m and depth 2.2 m, giving a channel capacity of approximately 30 m3s–1;
[image:5.595.138.455.69.265.2] [image:5.595.139.454.319.507.2]giving a capacity of approximately 21.5 m3s–1;
3. the current channel embanked (i.e. no floodplain).
Note that although the approximate channel capacities are given, they are averages for the channel reach through the floodplain. In some sections, the current channel capacity is only around 10 m3s–1. Consequently, it should not be
inferred that all flows below 21 and 30 m3s–1, for the restored
and current channels respectively, are entirely within bank and that the floodplain is not inundated.
Four events were run through the iSIS model for the middle Cherwell:
1. December 1997-January 1998 (flood peak approximately 21 m3s-1 at Somerton);
2. Easter (April) 1998 (flood peak approximately 60 m3s–1 at Somerton);
3. November 2000 (flood peak approximately 25 m3s–1 at
Somerton).
Because there were no data available for a flood event between 25 and 60 m3s–1, a synthetic event was generated
by scaling the inflows of the November 2000 event.
4. November 2000 scaled (flood peak approximately 38 m3s–1 at Somerton)
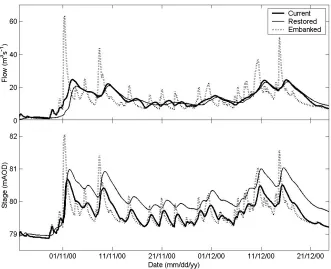
For the first flood peak on 2–3 November 2000 at Somerton, the model of the current channel and floodplain calculates a peak flow of 25 m3s–1 at Somerton (Fig. 6). When the
channel is restored to its pre-engineered dimensions, the peak flow is reduced to 21 m3s–1 (a reduction in flow of
16%) and delayed by 17 hours. If the floodplain storage were removed by embanking the river channel through the floodplain, the hydrograph would be much flashier, displaying more rapid rises and falls. The peak flow would be increased to 63.3 m3s–1 (153% greater) and would occur
40 hours earlier. The current floodplain clearly has a very significant role in attenuating the flood hydrograph. It is noteworthy that the impact of channel restoration on peak flow is consistent for the four events of broadly equal magnitude (20–25 m3s–1) during this period (October–
December 2000). However, there is greater variation in peak flows as a result of embanking the channel for flows in the range of 35–65 m3s–1.
Calculated changes in stage differ from those for flow (Fig. 6). Restoration of the river channel increases water level by around 0.5 m compared with the current channel dimensions. Embanking the channel increases water level at the peak flow by around 1.0 m.
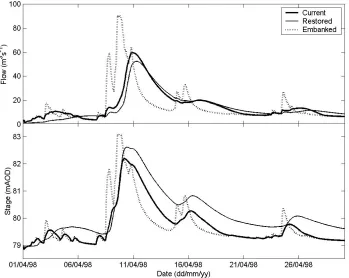
Results were also calculated for Easter 1998 (Fig. 7). The peak flow for the current channel dimensions is 60 m3s–1.
This flow is less than that experienced in Banbury (around 90 m3s–1) because the storm was concentrated over the
[image:6.595.137.468.440.709.2]catchment above Banbury and there is attenuation of the hydrograph between Banbury and Somerton. The model shows that restoring the channel would reduce this peak of 60 m3s–1 by 12% to 52 m3s–1 and the time of peak would be
delayed by three hours. Embanking the channel through the floodplain would increase the peak flow to 90.5 m3s–1 at
Somerton, an increase of 52%, and cause the peak to arrive 33 hours earlier. At the peak of the flood, restoring the channel to pre-engineered dimensions would increase river level by 0.5 m whilst embanking the channel would increase peak water level by almost 1.0 m.
Results summary
For each event modelled, the peak flow under the three scenarios: current channel configuration; restored channel
and embanked channel was calculated (Table 1). Rehabilitation of the channel, making the channel narrower and raising the bed, reduces peak flow at Somerton Bridge by around 10–15%. In contrast, embanking the river and thus preventing water spreading onto the floodplain at high flows, increases the peak flow by 50–150%. This demonstrates the important role of the floodplain in reducing flood risk downstream and indicates that this function can be further augmented by channel rehabilitation.
For the site at Somerton Bridge, the flood frequency curve was determined to present the results in terms of return period. The median annual flood (Qmed) was estimated as 39.7 m3s–1 using the no-data method from the Flood
[image:7.595.138.487.69.347.2]Estimation Handbook (Reed and Robson, 1999). The same method predicts Qmed for Banbury gauging station to be 27.7 m3s–1, whereas observations give a value of
Table 1. Peak flow (m3s-1) for each event modelled. Percentage change related to the current
situation is shown in brackets.
97/98 Easter 98 Oct 2000 Oct 2000 (60)
Current 20.7 59.5 25.0 38.0
Restored 18.6 (-10%) 52.3 (-12%) 20.9 (-16%) 33.0 (-13%)
Embanked 32.0 (+54%) 90.5 (+52%) 63.3 (+153%) 92.5 (+143%)
[image:7.595.115.490.659.729.2]16.7 m3s–1. The ratio of these two values (0.603) was used
to adjust the predicted Qmed at Somerton, to 23.9 m3s–1. This
average annual flood needs to be scaled to define the entire growth curve.
The Environment Agency provisionally estimated the return period of the Easter 1998 flood at Banbury (90.8 m3s–1) as in excess of 100 years (Bye and Horner,
1998). Direct use of the pooling-group procedures of the Flood Estimation Handbook (FEH) suggests a return period in excess of 500 years. The floods of 1932 and 1947 are thought to be of equivalent magnitude to Easter 1998, raising serious doubts over the pooling group estimates. More detailed analysis of the Banbury gauged flow record by MacDonald (2002) suggested a return period of approximately 120 years, which seems more realistic. The apparently poor performance of the FEH pooling group method at Banbury creates uncertainty about its use downstream at Somerton. Consequently, growth factors (points on the flood frequency curve divided by the Qmed) from observations at Banbury were used for Somerton, rather than the FEH estimates (Table 2).
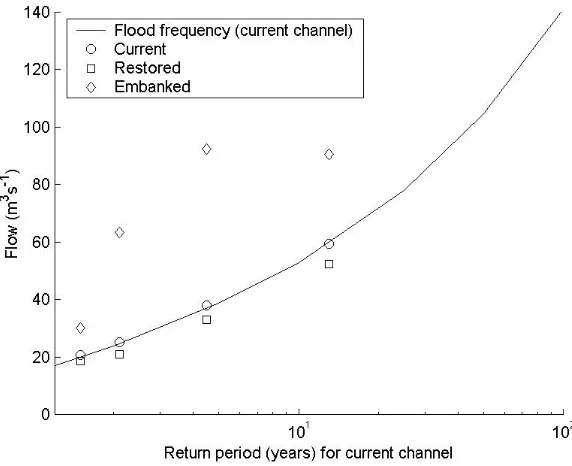
The flood frequency curve was used to estimate the return period of flood events in the modelling study. Flood magnitudes for the current, embanked and restored channel were each plotted against the return period of the event for the current channel (Fig. 8). Since embanking the channel does not lead to consistent increases in flow, the resulting points on Fig. 8 for the embanked channel do not form a smooth curve. Producing a definitive revised flood frequency for the embanked channel would require running long time series of rainfall through the models and selecting new annual maxima for frequency analysis.
[image:8.595.155.441.372.605.2]By drawing lines by eye through the data for the embanked and restored channels, flood frequency curves for those scenarios were defined. These curves were then used to estimate new return periods for the four flood events, under the three scenarios (Table 3). Restoration of the channel reduces the frequency of the floods slightly to 16 years. Embankment of the channel means that a flood of a given magnitude would occur much more often, e.g. the Easter 1998 flood would occur once, on average, every 3.8 years rather than once every 13 years as at present.
Table 2. Growth factors and flood magnitude for specific return periods at Somerton Bridge
Return period (years) 2 5 10 25 50 100 200 500
Growth factor 1.00 1.62 2.20 3.26 4.38 5.89 9.94 11.81
Flood magnitude (m3s-1) 24 39 53 78 105 141 190 283
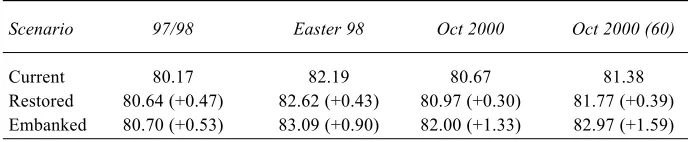
[image:8.595.105.481.685.731.2]The peak water level under the three scenarios for each event at Clifton Bridge, which is within the floodplain, was also calculated (Table 4). Restoration of the channel, by making the channel narrower and shallower, increases water level at Clifton Bridge by around 0.3–0.5 m. Embanking the river increases the peak water level within the river by 0.5–1.6 m and prevents any water spreading onto the floodplain at high flows.
Discussion
The above sections have described how available data and standard hydrological and hydraulic models were employed to predict the hypothetical hydrological changes resulting from restoration of the River Cherwell. Models are, by definition, simplifications of reality that retain only certain characteristics of the system under study (Kirkby et al., 1993). The reliability of results depends on whether these characteristics represent the river system adequately and whether modelled parameters are given the correct numerical values. Four elements require particular discussion.
Firstly, the scenarios considered in this project provide extreme circumstances of either river fully embanked or channel restored to a semi-natural condition. Clearly a range of current conditions and possible future options exists. Embankments are rarely of constant height, so one location can be over-topped, whilst another part is not. Furthermore, parts of the channel may be soft-engineered, such as by using gabions or wicker fencing to narrow the channel, whilst other sections remain in their current condition (Brookes and Sear, 1996). Extreme scenarios were investigated to show the maximum range of likely impacts and to demonstrate the utility of modelling as a predictive tool. Actual restoration schemes may have impacts within these limits.
Secondly, losses from the floodplain, including evaporation and infiltration into the soil, are not represented explicitly in the model. Water losses can be included in the model as ‘outflow’ from the floodplain. Although this may account satisfactorily for evaporation losses, it does not represent the process whereby water infiltrating into the floodplain eventually reaches the river and augments low flows. However, the Cherwell catchment is underlain by clay soils of very low hydraulic conductivity, so infiltration constitutes a negligible quantity of stream flow. Application of the method to river systems where the floodplain is highly permeable, such as on sandy soils (Nielsen et al, 1991), and where the objectives include assessment of low flows, requires explicit representation of soil water movement.
Thirdly, iSIS does not model the processes of erosion or deposition within the channel. In this study, it was assumed that the restored river channel would be stable over time. Restoring the channel to near natural morphology cannot guarantee stability, since natural channels are in constant adjustment (Hack, 1960; Sear 1996). A more extensive study might include analysis of the affects of changes in hydraulic conditions on sediment transport and geomorphology (e.g. Ferguson and Ashworth, 1992; Booker et al., 2001). For example, increased flow would increase sediment transport capacity and may result in net erosion and channel instability.
[image:9.595.55.294.91.163.2]Fourthly, a key element in hydraulic modelling is the selection of roughness of the river bed and floodplain. Roughness can vary significantly in different parts of the system even within the channel (Robert et al., 1992). For example, fine river sediments, often found in pools, have a typical Manning’s roughness value of 0.02, whereas for riffles composed of gravel, the value may be 0.03 (Cowan, 1956). On the floodplain, roughness can vary from 0.03 for short grass to 0.1 for dense trees (Chow, 1959). In this application of the iSIS model, roughness was a calibration parameter, chosen to optimise the match between observed and modelled river flows rather than being derived from measurements of the sediment characteristics or vegetation type. A single value of 0.0 was found to be the optimum for the floodplain and 0.05 for the river channel. These values can be thought of as averages that represent the range of
Table 4. Peak water level (m AOD) for each event modelled. Change in level related to the current situation is shown in brackets.
Scenario 97/98 Easter 98 Oct 2000 Oct 2000 (60)
Current 80.17 82.19 80.67 81.38
Restored 80.64 (+0.47) 82.62 (+0.43) 80.97 (+0.30) 81.77 (+0.39)
[image:9.595.127.471.661.732.2]Embanked 80.70 (+0.53) 83.09 (+0.90) 82.00 (+1.33) 82.97 (+1.59)
Table 3. Return periods (years) for the events modelled
Scenario 97/98 Easter 98 Oct 2000 Oct 2000 (60)
Current 1.5 13 2 4.5
Restored 2 16 3 6
values found within the system. In theory, use of a more deterministic model such as a three-dimensional computational fluid dynamics model would allow explicit representation of roughness elements, which would require field mapping of vegetation and bed sediment types (e.g. Olsen and Stokseth, 1995; Booker et al., 2001). However, the methods for determining roughness values from local field observations of sediment (Clifford et al., 1992) or vegetation (e.g. Limerinos, 1970), are imprecise. Collection of such field data throughout the Cherwell modelled domain would have been costly, even using methods such as digital photogrammetry (Lane, 2000). This issue is further complicated as roughness can change with discharge (e.g. Sargent, 1979; Myers et al., 2001).
Conclusions
This paper has shown the impacts on floods of changes to river channel geometry and of the hypothetical construction, or removal, of embankments to prevent water spreading onto the floodplain at high flows. Hydrological and hydraulic numerical modelling assessed the effects of such changes to the River Cherwell between Oxford and Banbury. Restoring the river channel through the floodplain to pre-engineered dimensions reduces peak flow by around 10– 15% and increased peak water levels within the floodplain by 0.5–1.6 m. Embanking the river increases the peak flows downstream by up to 150%. These results suggest that floodplain restoration, in terms of embankment removal or reducing channel dimensions to pre-engineered dimensions, can be a valuable part of a catchment’s flood management strategy. Both measures lead to increased inundation of the floodplain, which can be positive for ecological restoration.
Acknowledgements
The Wise Use of Floodplains project was developed by a consortium of interested parties including the Royal Society for the Protection of Birds, the Environment Agency of England and Wales, Thames Water and the Centre for Ecology and Hydrology. It was funded by the European Commission’s LIFE programme. The project would not have been possible without contributions from the Environment Agency: rainfall, river flow and topographic data; from Steve Darby and David Sear (Southampton University): the method to determine pre-engineered channel dimensions; from Sue Crooks (CEH): rainfall-runoff modelling and from Adrian Bayliss (CEH): flood frequency analysis.
References
Bates, P.D., Stewart, M.D., Desitter, D., Anderson, M.G., Renaud, J.P. and Smith, J.A., 2000. Numerical simulation of floodplain
hydrology. Water Resour. Res., 36, 2517–2529.
Boon, P.J., Davies, B.R. and Petts, G.E., 2000. Global perspectives
on river conservation: science, policy and practice. Wiley, Chichester, UK.
Booker, D.J., Sear, D.A. and Payne, A.J.,2001. Modelling
three-dimensional flow structures and patterns of boundary shear
stress in a natural pool-riffle sequence. Earth Sur. Process. Land.,
26, 553–576.
Boorman, D.B., Hollis, J.M. and Lilly, A., 1995. A hydrology of
soil types: a hydrologically based classification of soils in the United Kingdom. Institute of Hydrology, Wallingford, UK. Report 126. 137pp.
Brookes, A. and Sear, D.A., 1996. Geomorphological principles
for restoring channels, In: River channel restoration. A. Brookes,
and F.D. Sheilds, (Eds.), Wiley, Chichester, UK. 75–101.
Brookes, A. and Shields, F.D., 1996, River channel restoration:
Guiding principles for sustainable restoration projects. Wiley, Chichester, UK.
Bye, P. and Horner, M.J., 1998. Easter 1998 floods. Report to
Environment Agency, Bristol. 85pp.
Chow, V.T., 1959 Open channel hydraulics. McGraw Hill, USA.
Clifford, N.J., Robert, A. and Richards, K.S., 1992. Estimation of flow resistance in gravel-bed rivers: A physical explanation of
the multiplier of roughness length, Earth Sur. Process. Land.,
17, 111–126.
Cowan, W.L., 1956. Estimating hydraulic roughness coefficients.
Agr. Eng.,37, 473–475.
Crooks, S.M., Naden, P.S., Broadhurst, P. and Gannon, B., 1996.
Modelling the flood response of large catchments: initial assessments of the impacts of climate and land use change. CEH Report to Ministry of Agriculture, Fisheries and Food, FD0412. 66pp.
Crooks, S.M., Cheetham, R., Davies, H. and Goodsell, G., 2000.
EUROTAS (European River Flood Occurrence and Total Risk Assessment System) Final Report, Task T3: Thames catchment study. EU Contract ENV4-CT97-0535. 84pp.
Crowder, R.A., Chen, Y. and Falconer, R.A., 1997. Benchmarking
and study of hydraulic river models. R&D Technical Report W88 Environment Agency, Bristol, UK.
Darby, S. and Sear, D., 2001. Report to the Wise Use of Floodplain
project. University of Southampton, UK.
Fuller, R.M., 1993. The land cover map of Great Britain. Earth
Space Rev., 2, 13–18.
Gannon, B., 1995. Automating areal rainfall calculations for
catchments. Institute of Hydrology, Wallingford, UK. Internal Report. 44pp.
Hack, J.T., 1960. Interpretation of erosional topography in
humid-temperate regions. Amer. J. Sci.,258A, 80–97.
Halcrow / HR Wallingford, 2001. iSIS flow user manual. Vol.1
user guide, HR Wallingford.
Hooijer, A., 1996. Floodplain hydrology: an ecologically oriented
study of the Shannon Callows, Ireland. PhD Thesis University of Amsterdam. Febodruk BV, Enschede, The Netherlands. Horritt, M.S. and Bates, P.D., 2001. Predicting floodplain
inundation: raster-based modelling verus the finite element
approach. Hydro. Process., 15, 825–842.
John, D.M., Leveque, C. and Newton, L.E., 1993. West Africa. In: Wetlands of the World I: Inventory, ecology and management.
Jones, S.B., 1983. The estimation of catchment average point rainfall profiles. Institute of Hydrology, Wallingford, UK. Report 87.
Junk, W.J., Bayley, P.B. and Sparks R.E., 1989. The flood pulse
concept in river-floodplain systems. Can. J. Fisheries Aqua.
Sci., 106, 110–127.
Kirkby, M.J., Naden, P.S., Burt, T.P. and Butcher, D.P., (Eds.)
1993. Computer Simulation in Physical Geography, Second
edition, Wiley, Chichester, UK. 190pp.
Lane, S.N., 2000. The measurement of river channel morphology
using digital photogrammetry, Photogram. Rec.,16, 937–957.
Limerinos, J.T., 1970. Determination of Manning coefficient from
measured bed roughness in natural channels. US Geological Survey Water Supply Paper 1898-B. 47pp.
MacDonald, D., 2002. The Flood Estimation Handbook – initial
experiences. Proc. Brit. Hydro. Soc. meeting, March 2002.
Marks, K. and Bates, P., 2000. Integration of high-resolution
topographic data with floodplain flow models. Hydro. Proc.,
14, 2109–2122.
Marriot, S.B., 1998. Channel-floodplain interactions and sediment
deposition on floodplains. In: United Kingdom floodplains. R.G.
Bailey, P.V. José and B.R. Sherwood, (Eds.). Westbury Academic and Scientific Publishing, Otley, UK. 43–62.
Mitsch, W.J. and Gosselink, J.G., 1993. Wetlands, 2nd Edition.
Van Nostrand Reinhold, New York, USA.
Myers, W.R.C., Lyness, J.F. and Cassells, J., 2001. Influence of boundary roughness on velocity and discharge in compound
river channels. J. Hydraul. Res., 39, 311–319.
Nanson, G.C. and Croke, J.C., 1992. A generic classification of
floodplains. Geomorphology, 4, 459–486.
National Research Council, 1992. Restoration of aquatic
ecosystems - science technology and public policy. National Academic Press, Washington DC, USA.
Natural Environment Research Council, 1975. Flood Studies
Report. Institute of Hydrology, Wallingford, UK. Five volumes. Nielsen S.A., Refsgaard J.C. and Mathur V.K., 1991. Conceptual modelling of water loss on floodplains and its application to
River Yamuna upstream of Delhi. Nord. Hydro., 22, 265–274.
Olsen, N.R.B. and Stokseth, S., 1995. Three-dimensional numerical modelling of water flow in a river with large bed
roughness. J. Hydraul. Res., 33, 571–581.
Reed, D. and Robson, A., 1999, Flood estimation handbook,
Institute of Hydrology, Wallingford, UK.
Robert, A., Roy, A.G. and De Serres, B., 1992. Changes in velocity profiles at roughness transitions in coarse grained channels,
Sedimentology, 39, 725–735.
Sargent, R.J., 1979. Variations of Manning’s ‘n’ roughness
coefficient with flow in open river channels. J. Inst. Water
Enigeers. Sci.,33, 290–294.
Schropp, M.H.I. and Jans, L.H., 2000. Morphological development of man-made side channels in the floodplain of the River Rhine.
Proc. Int. Workshop on Development and Management of Floodplains and Wetlands, Beijing, China. September 2000. Sear, D.A., 1996. Sediment transport processes in pool-riffle
sequences, Earth Sur. Process. Land., 21, 241–262.
Sutcliffe, J.V. and Parks, Y.P., 1989. Comparative water balances
of selected African wetlands. Hydrol. Sci. J., 34, 49–62.
US Corps of Engineers, 1972. Cited by Sather, J.M. and Smith,
R.D. 1984. An overview of major wetland functions and values.