Hydrol. Earth Syst. Sci., 16, 3461–3473, 2012 www.hydrol-earth-syst-sci.net/16/3461/2012/ doi:10.5194/hess-16-3461-2012
© Author(s) 2012. CC Attribution 3.0 License.
Hydrology and
Earth System
Sciences
Land cover and water yield: inference problems
when comparing catchments with mixed land cover
A. I. J. M. van Dijk1,2, J. L. Pe ˜na-Arancibia2, and L. A. (Sampurno) Bruijnzeel3
1Fenner School for Environment & Society, Australian National University, Canberra, Australia 2CSIRO Land and Water, Canberra, Australia
3VU University, Amsterdam, The Netherlands
Correspondence to: A. I. J. M. van Dijk ([email protected])
Received: 8 April 2011 – Published in Hydrol. Earth Syst. Sci. Discuss.: 26 April 2011 Revised: 10 July 2012 – Accepted: 2 September 2012 – Published: 26 September 2012
Abstract. Controlled experiments provide strong evidence that changing land cover (e.g. deforestation or afforestation) can affect mean catchment streamflow (Q). By contrast, a similarly strong influence has not been found in studies that interpretQfrom multiple catchments with mixed land cover. One possible reason is that there are methodological issues with the way in which the Budyko framework was used in the latter type studies. We examined this usingQdata observed in 278 Australian catchments and by making inferences from syntheticQdata simulated by a hydrological process model (the Australian Water Resources Assessment system Land-scape model). The previous contrasting findings could be re-produced. In the synthetic experiment, the land cover influ-ence was still present but not accurately detected with the Budyko- framework. Likely sources of interpretation bias demonstrated include: (i) noise in land cover, precipitation and Q data; (ii) additional catchment climate characteris-tics more important than land cover; and (iii) covariance be-tweenQand catchment attributes. These methodological is-sues caution against the use of a Budyko framework to quan-tify a land cover influence inQdata from mixed land-cover catchments. Importantly, however, our findings do not rule out that there may also be physical processes that modify the influence of land cover in mixed land-cover catchments. Process model simulations suggested that lateral water re-distribution between vegetation types and recirculation of intercepted rainfall may be important.
1 Introduction
1.1 Background
There is strong experimental evidence that changing land cover (e.g. deforestation or afforestation) can affect the lo-cal water balance. Such an influence has been detected at various scales, from site water balance and atmospheric wa-ter flux studies to small catchments undergoing change (see review by e.g. van Dijk and Keenan, 2007 and references therein). Controlled catchment experiments have demon-strated a change in mean catchment streamflow or (synony-mously) water yield (Q)after land cover change (typically forest planting or logging; Bosch and Hewlett, 1982; Brui-jnzeel, 1990, 2004; Andr´eassian, 2004; Brown et al., 2005; Farley et al., 2005). They appear to provide clear evidence that land cover characteristics affectQ, although this influ-ence is moderated by a range of climate and catchment char-acteristics as well as vegetation attributes beyond broad land cover class alone (Andr´eassian, 2004; Bruijnzeel, 2004; van Dijk and Keenan, 2007). These conclusions could be corrob-orated by analysis of collated longer termQestimates from multiple catchments, provided only catchments with (near complete) forest cover and herbaceous cover were selected (Holmes and Sinclair, 1986; Turner, 1991; Zhang et al., 1999, 2001). The collated data were still dominated by small exper-imental catchments, however, and such experiments are not without their challenges (discussed further on).
3462 A. I. J. M. van Dijk et al.: Land cover and water yield
needs to be controlled for several studies do this by fitting an additive formulation of a Budyko model1(Budyko, 1974) that explicitly represents two (e.g. forest and herbaceous) or a small number of land cover types (Zhang et al., 2004; van Dijk et al., 2007; Oudin et al., 2008; Donohue et al., 2010; Peel et al., 2010). Such an approach has been described as a top-down analysis (sensu Klemeˇs, 1983; Sivapalan et al., 2003). In the following formula:
Qj =
X
i
FCi,jf (Pj, Pj, wi), (1)
whereQj,Pj, and PEj are the long-term (e.g.>10 yr) av-erage Q, precipitation and potential evaporation2 (in mm per time unit) for catchmentj, FCi,j is the fractional cover of land cover typei in catchmentj, and wi a dimension-less model parameter that characterises the hydrological be-haviour of land cover class i and may be interpreted as a measure of the efficiency with which vegetation accesses and uses stored water. The influence of land cover is sub-sequently determined by finding thewi values that minimise the root mean square error (RMSE) between observed and estimated Q, and interpreting the found parameter values. The cited studies performed such an analysis using collated data for 221 (Donohue et al., 2010) to 1508 (Oudin et al., 2008) catchments. They report either a much smaller land cover influence than found in controlled experiments (Zhang et al., 2004; van Dijk et al., 2007; Oudin et al., 2008; Dono-hue et al., 2010; Peel et al., 2010); no statistically significant influence (Zhang et al., 2004; van Dijk et al., 2007; Oudin et al., 2008; Peel et al., 2010); or even an influence opposite to that which might be anticipated – at least for some land cover classes (Oudin et al., 2008; Peel et al., 2010) or climate types (van Dijk et al., 2007; Peel et al., 2010).
It might seem surprising that land cover change would have a marked effect on the water balance of a catch-ment when it has homogeneous land cover, but not when it has mixed land cover. Some possible physical and methodological causes have been suggested. Physical explanations include:
1. Catchment size. The nature of controlled experiments puts a limit to the size of catchments that can be manipu-lated and the majority of experiments have been carried out on catchments smaller than 1 km2(see e.g. tabulated data in Andr´eassian, 2004; Brown et al., 2005). Con-versely, data sets of real-world catchments with mixed land cover tend to have average catchment sizes in the order of hundreds to thousands km2 (see respective studies listed earlier). A known issue with small catch-ments is the risk of ungauged subterranean transfers 1Defined here as any rational function that embodies the same
conceptual model as the original (see various examples in e.g. Oudin et al., 2008).
2In evaporation we include all evaporation and transpiration
fluxes.
(e.g. Bruijnzeel, 1990), which could lead to overestima-tion of the influence of land cover change onQ. Con-versely, while land surface-atmosphere feedbacks per-haps can safely be ignored for small catchments, that may not be the case for large catchments, where land cover certainly influences overall evaporative energy and may even modulate precipitation (for discussion see Donohue et al., 2007; van Dijk and Keenan, 2007). 2. Catchment hydrological processes. As catchment
ex-periments require small and well defined watersheds, they may be expected to have greater relief in compari-son to larger catchments. Greater relief may mean shal-lower soils, less infiltration and therefore more storm flow, a more efficient surface drainage network, and lesser evaporation losses from streams, wetlands and groundwater-using vegetation (van Dijk et al., 2007). 3. Land cover characteristics. Experimental catchments
may be expected to have a more idealised and homoge-nous vegetation cover and fewer activities and structures designed to reduce storm runoff. In afforestation stud-ies, the selection of suitable catchments may have cre-ated a bias towards low-complexity land cover, whereas land cover after clearing is unlikely to be representa-tive of established agricultural landscapes. Large mixed land-cover catchments may include surface runoff inter-cepting features (e.g. hillside farm dams, tree belts) and unaccounted surface water or groundwater use (Calder, 2007; van Dijk et al., 2007). In addition, forest clear-ing in experimental studies may be associated with soil disturbance, which may enhanceQgeneration for rea-sons that are not directly attributable to land cover per se (Bruijnzeel, 2004). The consequence may be that the contrast in hydrological response between forest and herbaceous vegetation may be greater in experimen-tal catchments than in non-experimenexperimen-tal catchments. Finally, depending on the configuration of vegetation types within a catchment, forests may intercept and use lateral flows of water from herbaceous vegetation (fur-ther discussed in Sect. 4.2)
There are also some potential methodological issues: 4. Other overriding climate and terrain factors. Several
A. I. J. M. van Dijk et al.: Land cover and water yield 3463
cover is the next most important variable. Additional factors potentially equally or more important than land cover include the phase difference between seasonalP and PE patterns (Budyko, 1974; Milly, 1994) and other aspects of their temporal behaviour (e.g. rainfall inten-sity). Depending on their covariance with land cover, these attributes may attenuate or enhance any land cover influence onQ.
5. Covariance between land cover and climate. Covari-ance between land cover and climate is commonly present in collated catchment data sets due to the cor-relation between natural biomes and climate, and be-cause of the role of landscape and climate in land use and land cover change decisions. For example, catch-ments with considerable remnant and plantation forests will usually be found more commonly in regions with greater relief, usually associated with greater P and lower PE than their lowland counterparts. Applying an additive response model to a data set with covariance between candidate predictors makes erroneous results more likely. Van Dijk et al. (2007) attempted to con-trol for this effect and demonstrated that it influenced the results, but was probably not the only cause for the counterintuitive results they obtained.
6. Measurement error. Studies analysing data from small catchments have not been able to detect a significant change in stream flow when land cover is changed in less than 15–20 % of a catchment (Bosch and Hewlett, 1982; but see Trimble et al., 1987; Stednick, 1996). Ar-guably, this can be attributed to the influence of mea-surement noise on the analysis. Statistically, therefore it might be expected that it is harder to detect a land cover influence in large catchments with land cover mixtures than it is for catchments with homogeneous land cover. Using additive Budyko models requires estimates not only ofQ, but also of catchment average P, PE and fractional cover (FC) of the land cover classes of inter-est. Errors will occur in each of these and may affect the analysis results, even more so if errors are not random. For example, Oudin et al. (2008) speculated that sys-tematic precipitation measurement errors affected their analysis.
1.2 Objective
In this study, we aim to test the hypothesis that method-ological issues with the use of a Budyko framework to in-terpret collated data from multiple mixed land-cover catch-ments may explain why a land cover influence has not been detected. To test this, we usedQobservations from 278 non-experimental Australian catchments, the Zhang formulation of the Budyko model (Zhang et al., 2001), and a bottom-up dynamic hydrological process model with explicit repre-sentation of vegetation characteristics (AWRA-L). Synthetic
experiments were performed in which the Budyko model was used to analyse process model simulations for the 278 catchments. To paraphrase, we use the more complex model (AWRA-L) to create a virtual laboratory. We then perform a virtual experiment and use the Budyko model as an analytical tool to interpret the results. If our experiment can reproduce both a land cover influence for individual catchments as well as the lack of influence found in the type of multi-catchment studies described in the introduction, then this would support our hypothesis.
It is emphasised that we do not aim to prove that the methodological issues described are the single most impor-tant cause for the discrepancies arising from the discussed application of the Budyko model. Their presence certainly does not rule out the plausibility and presence of additional methodological or physical explanations. Several such expla-nations were mentioned and are further explored in the dis-cussion (Sect. 4.2).
Strictly speaking, we are only able to test our hypothe-sis for the specified combination of catchment data, Budyko model formulation and process model. Moreover, we use models in our synthetic experiment as a plausible but not nec-essarily highly accurate representation of reality. This type of synthetic study is not unique but somewhat uncommon in the hydrological literature, and therefore we briefly discuss some caveats as to what are not our objectives.
Firstly, we do not aim to validate or falsify the dynamic process model (AWRA-L) we used in this experiment. We also do not aim to prove that the model structure and param-eter values used here are the best possible description of re-ality, or better than any other model(s). Any model can only ever be a flawed and simplified abstraction of reality (e.g., Oreskes et al., 1994). Here we use the AWRA-L model be-cause it is comparatively simple, bebe-cause we understand it sufficiently well to interpret its behaviour and, most impor-tantly, because it is able to reproduce two key features also observed in real data sets, as discussed in further detail be-low. Any other model able to meet this criterion should have been suitable for the experiment.
Secondly, we do not propose that we can use the more complex process model to prove a land cover influence; rather we show that it can reproduce such an influence in conditions were it has been observed as well as reproduce its absence in conditions were it has not. Proving the existence of a land cover influence is neither necessary (we refer to the empirical evidence discussed) nor possible (a model funda-mentally cannot provide proof of a real-world phenomenon, at best only a plausible explanation). We will discuss this point in more detail further on.
3464 A. I. J. M. van Dijk et al.: Land cover and water yield
[image:4.595.51.286.64.257.2]766
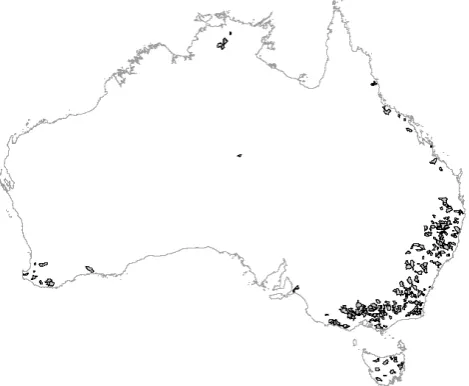
Fig. 1. Location of the 278 Australian catchments for which streamflow data were used in the
767
analysis.
768
769
Fig. 1. Location of the 278 Australian catchments for which stream-flow data were used in the analysis.
form of the Budyko model is able to accurately detect land cover influence.
2 Methods
2.1 Data
The Q data used here were identical to the data used by van Dijk and Warren (2010), which is a subset of 278 out of around 326 records used in previous studies (Guerschman et al., 2008, 2009; van Dijk, 2010a, c) and very similar in composition to Australian catchment data used in other stud-ies (e.g. Zhang et al., 2004; Peel et al., 2010). Catchment boundaries were derived from a 900 resolution digital eleva-tion model (Fig. 1) and catchments with major water regu-lation infrastructure were excluded. The 278 catchments that were selected had data for at least five (not necessarily con-secutive) years between 1990 and 2006 (median 16 yr). The woody vegetation cover fraction was mapped on the basis of Landsat Thematic Mapper imagery for 2004 and daily pre-cipitation and Priestley-Taylor PE was interpolated at 0.05◦ resolution from station data (Jeffrey et al., 2001). Catchment areas varied from 23–1937 (median 278) km2, tree cover from 0–90 % (median 25 %),Pfrom 404–3138 (median 836) mm yr−1, PE from 766–2096 (median 1265) mm yr−1, and
Qobsfrom 4–1937 (median 114) mm yr−1.
2.2 Budyko model
Oudin et al. (2008) tested five different Budyko model for-mulations and found little difference in their explanatory power, and all formulations have a very similar functional form. We chose the model of Zhang et al. (2001) because it was used successfully in previous studies to detect land cover
influence in a globalQdata set of (mostly small) catchments with homogeneous land cover. For a single land cover class, the model can be written as
Q= P
1+ P PE+w
PE P
2.
(2)
For a catchment with a two land cover classes, forest and herbaceous vegetation, Eq. (2) can be rewritten as (cf. Eq. 1)
Q=FC (forest) P
1+ P
PE+w(forest) PE
P
2
+FC (herbaceous) P
1+ P
PE+w(herbaceous) PE
P
2 .
. (3)
2.3 Dynamic model
A. I. J. M. van Dijk et al.: Land cover and water yield 3465
Van Dijk and Warren (2010) evaluated AWRA-L with the configuration and parameterisation used here against a range of in situ and satellite observations of water balance com-ponents and vegetation dynamics. This included evaluation against Qobs from the catchments used in this analysis, as well as flux tower latent heat flux observations at four sites across Australia, including both forest and herbaceous sites (van Dijk and Warren, 2010). Latent heat flux patterns for dry canopy conditions were reproduced well. Comparison of total latent heat flux was difficult due to the large uncertainty in rainfall interception evaporation estimated from the flux tower measurements. Streamflow records were reproduced well, that is, with an accuracy that was commensurate to that achieved by other rainfall-runoff models with a similar cali-bration approach.
2.4 Experiments
2.4.1 Can previous contrasting findings be reproduced and reconciled with the process model?
We did two tests to see whether we could reproduce the contrasting findings of published analyses of Q from ho-mogenous experimental and from multiple non-experimental mixed land-cover catchments, respectively. First, we fitted the two parameter Zhang model (Eq. 3) by minimising the standard error of estimate (SEE) againstQobsfrom the 278 catchments (using Solver in Microsoft ExcelTM). We inter-preted the derived w(forest) and w(herbaceous) parameter values and implied land cover to assess whether we obtained the same contrasting findings as previous studies.
Next, we investigated whether the AWRA-L could rec-oncile these contrasting findings, which means meeting two conditions. First, the model needed to reproduce the observed Qfrom the 278 catchments as well as, or better than, the calibrated two-parameter Zhang model, as judged by sev-eral measures of agreement (Table 1). Second, the model needed to be in agreement with the results of experimen-tal catchment studies of land cover change impacts on Q. One test of this would be to reproduceQchanges observed in an actual paired catchment experiment, but unfortunately we did not have access to daily streamflow and meteorolog-ical data for a number of such experiments, and one exam-ple would have a very limited statistical significance. Instead, we used AWRA-L to simulateQfrom the 278 catchments under conditions of full forest and full herbaceous cover, respectively. We compared the resulting water balance es-timates with the empirical relationships for the respective land cover type reported by Zhang et al. (2001), who pro-pose two alternative models to estimateQ. The first method (Zhang-A) is to use Eq. (3) with values ofw(forest) = 2.0 and w(herbaceous) = 0.5, with PE estimated using the Priestley– Taylor formula and a standard land cover with assumed albedo and aerodynamic conductance. The second method (Zhang-B) is to use the same approach, but substitute PE by
values of 1410 and 1100 mm yr−1for forest and herbaceous cover, respectively. The latter reduces the physical realism of the model, but provides a convenient alternative to where PE estimates are not readily available, and has been shown to agree well with other empirical relationships (Holmes and Sinclair, 1986; Turner, 1991) and data from catchments with homogeneous land cover (Zhang et al., 2001; Brown et al., 2005). These so-called Zhang curves have been widely used to estimate the impact of conversion between forest and non-forest cover on Q in scenario studies and policy reports (e.g. Austin et al., 2010; Brown et al., 2007; Dawes et al., 2004; Sun et al., 2006; van Dijk et al., 2006), and as such were considered a relevant point of reference. The vast ma-jority of such reports assume that land cover impact is lin-early proportional to the area of land cover change.
The prominent use of the Zhang curves in policy devel-opment puts further onus on understanding the apparent dis-crepancies between the results from the two experimental de-signs discussed. We emphasise that our objective does not require that the process model explains more variation than the Zhang models in one or both cases; equal or similar per-formance would be sufficient. The critical difference is that fitting the Zhang models typically leads to two substantially different parameter sets, essentially producing two mutually contradictory models in the respective applications. By con-trast, the process model uses one parameter set only for both cases and therefore by definition produces internally consis-tent results. The process model parameters were estimated a priori rather than optimised, which is not essential but ar-guably preferable.
In summary, if the tests described above would be success-ful, we would be able to conclude that previous contrastive findings can be reproduced, and appear to be at least partly due to methodological problems. To put it differently: if the same process model with identical parameters can repro-duce both (1) the land cover influence expected for individual catchments, and (2) the observedQfrom mixed catchments, then the fact that two different parameter sets are required in the case of the Zhang model suggests a methodological problem with that particular inference approach.
The subsequent analyses were designed to try and analyse three potential methodological problems, viz. measurement errors, an overriding influence of other environmental fac-tors, and covariance between land cover and climate.
2.4.2 Are measurement errors responsible?
3466 A. I. J. M. van Dijk et al.: Land cover and water yield
with actual, mixed land cover (we did not use the actually observedQas this already contains measurement noise, with unknown characteristics). First, a simulated measurement er-ror with an absolute average of 10 % was added to all 278 original values of FC and meanP, PE andQsim. The er-rors were drawn independently for each variable and each catchment. For FC an error was added that was drawn from a normal (Gaussian) distribution with mean of zero and stan-dard deviation of 0.1; the result was limited within the range 0 to 1. The values ofP, PE andQsimwere multiplied with a factor drawn from a normal distribution with mean of one and standard deviation of 0.1. Next, the two Zhang model parameters were optimised to the resulting noisy FC,P ,PE andQsimvalues for all 278 catchments combined. This ex-periment was repeated 3000 times, each time with a sample of 278 catchments. The resulting 3000 pairs ofwvalues were compared to those fitted to the original FC,P, PE andQsim values (i.e. without noise added), to assess whether the sim-ulated measurement noise led to parameter values suggestive of a smaller than predicted land cover influence.
2.4.3 Are additional environmental factors responsible?
The premise of the Budyko framework is that meanPand PE are the main determinants ofQ. Beyond this, however, other climate factors or terrain factors may be more important than land cover category. To investigate this possibility, we used the Zhang model to analyse the AWRA-L simulations for the forest and herbaceous scenarios. For each catchment, we cal-culated the model parameter (w)value corresponding to the Qsimulated for each land cover scenario (i.e. full forest or full herbaceous cover) using the following inverted model form (cf. Eq. 2):
P Qsim(scenario)−
P PE−1 PE
P
2 . (4)
For each land cover category, we attempted to find catch-ment attributes that could explain the variance in inferred wvalues. We used the same step-wise regression approach used in earlier analyses of the sameQdata (van Dijk, 2010a, c). In summary, candidate predictors were selected from a range of catchment attributes based on the parametric and non-parametric (ranked) correlation coefficients (r and r∗, respectively). Linear, logarithmic, exponential and power re-gression equations were calculated for all potential predic-tors, and the most powerful one was selected. The resid-ual variance was calculated and the same procedure was re-peated. The catchment attribute data available included mea-sures of catchment morphology (catchment size, mean slope, flatness); soil characteristics (saturated hydraulic conductiv-ity, dominant texture class value, plant available water con-tent, clay concon-tent, solum thickness); climate indices (mean P, mean PE, humidity index P/PE, remotely sensed ac-tual evapotranspiration, average monthly excess
precipita-tion); and land cover characteristics (fraction woody vegeta-tion, fractions non-agricultural land, grazing land, horticul-ture, and broad acre cropping, remotely sensed vegetation greenness). Full details on data sources and catchment cli-mate, terrain and land cover attributes can be found in van Dijk (2010a, c).
2.5 Is covariance between land cover and climate responsible?
Our catchment data set shows modest covariance between forest cover (FC) and P/PE (r= 0.44). Earlier analyses showed that this type of covariance can affect the ability to accurately determine land cover influence (see van Dijk et al., 2007, for a detailed example). We performed a further synthetic experiment using the AWRA-L model to test the magnitude of this problem:
1. Each of the 278 catchments was assigned a new vir-tual land cover by randomly drawing a new value for FC from a normal distribution with the same mean and standard deviation as the observed FC values (0.284 and ±0.224, respectively). Values were truncated to remain within the range 0 and 1.
2. For each catchment, the AWRA-L model was run with the new FC values and the original meteorological in-puts.
3. The two Zhang model parameters were fitted to the re-sulting 278Qsimvalues.
The experiment was repeated 3000 times (each time with all 278 catchments), and the results were analysed to determine whether there was a relationship between any (randomly in-troduced) covariance between the FC andP/PE values on the one hand, and the inferred land cover influence on the other.
3 Results
3.1 Previous contrasting findings can be reproduced and reconciled by the process model
Indicators of the agreement between Q observed in the 278 catchments and values estimated by the optimised two-parameter Zhang model (Eq. 3) and the AWRA-L model are listed in Table 1. For comparison, the performance of the originally proposed Zhang-A and Zhang-B models and an optimised Zhang model (Eq. 2) are also shown. This comparison is important, as these two models incor-porate the response of Qto land cover change as inferred from experimental catchment studies and widely used in scenario analysis.
A. I. J. M. van Dijk et al.: Land cover and water yield 3467
Table 1. Performance indicators of the original Zhang et al. (2001) models (Zhang-A and Zhang-B; see text for explanation), the Zhang model with one and two calibrated parameters, respectively, and the AWRA-L with prior parameter estimates. Al metrics relate to the agreement between modelled and observed mean annual streamflow (Q, mm per year) for all catchments (N= 278). SEE = standard error of estimate, MAE = mean absolute error, and Bias = mean bias (all in mm yr−1); Rel. Bias = mean of absolute values of percentage bias and FOM=fraction of values overestimated by model (in %).
SEE MAE Bias Rel. Bias FOM
Zhang-A 119 97 79 44 % 91 %
Zhang-B 136 114 86 47 % 86 %
Zhang – 2 parameter 84 54 4 2 % 62 %
Zhang – 1 parameter 84 54 4 2 % 62 %
AWRA-L 78 50 1 1 % 54 %
compared to the original models. However, reducing the Zhang model to a one-parameter model (that is, making the model insensitive to land cover), did not degrade model performance (optimised values were w(forest) = 1.91 and w(herbaceous) = 1.98 versus w= 1.95, respectively). These results support previously published result that fitting a Budyko model to observations from non-experimental catch-ments does not show the predicted land cover influence, in contrast with results based on experimental catchments. In other words, we were able to reproduce previous contrasting findings and reconcile them.
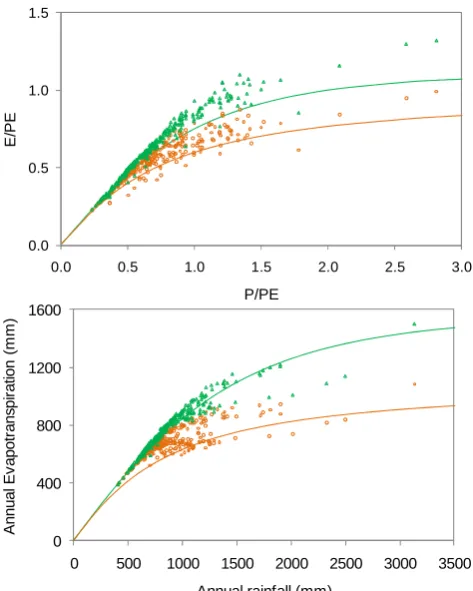
Table 1 also shows that, despite the lack of parameter op-timisation, AWRA-L performs slightly better than the cali-brated Zhang models. The AWRA-L predictions ofQfor the same 278 catchments, but this time for a hypothetical sce-nario of full forest and herbaceous cover, are compared to the original Zhang-A and Zhang-B model in Fig. 2. AWRA-L is able to reproduce the approximate differences between forest and herbaceous catchments predicted by the original Zhang models, although the forest scenario predictions agree better with the Zhang-B model than with the Zhang-A model (Fig. 2). It follows that the process model (1) can predictQ from the 278 catchments with mixed land cover as well as (in fact, slightly better than) a fitted Zhang model, and (2) sug-gests a land cover influence of similar magnitude as that pre-dicted by the original Zhang curves. Therefore, the process model can reconcile the contrasting conclusions drawn from experimental and mixed catchmentQ data that the Zhang model cannot reconcile.
Further supporting this conclusion, the same results could also be reproduced when process modelQestimates were in-terpreted using the Zhang model. If a one-parameter Zhang model was fitted to the modelled Qsim with hypothetical full forest or herbaceous cover,wvalues 3.6 and 1.0 where found, respectively – producing curves quite similar to the original Zhang-A and Zhang-B models. However, when the two-parameter Zhang model was fitted to theQsim obtained
a)
0.0 0.5 1.0 1.5
0.0 0.5 1.0 1.5 2.0 2.5 3.0
E /P E P/PE 770 b) 0 400 800 1200 1600
0 500 1000 1500 2000 2500 3000 3500
A n n u a l E v a p o tr a n sp ir a tio n ( m m )
Annual rainfall (mm)
771
772
Fig. 2. Comparison of AWRA-L simulated mean streamflow for the 278 catchments for 773
scenarios of forest cover (green triangles) and herbaceous cover (orange circles) shown in 774
two different ways. Also shown are the two models proposed by Zhang et al. (2001): (a) 775
Zhang-A and (b) Zhang-B. 776 777 778 a) 0.0 0.5 1.0 1.5
0.0 0.5 1.0 1.5 2.0 2.5 3.0
E /P E P/PE 770 b) 0 400 800 1200 1600
0 500 1000 1500 2000 2500 3000 3500
A n n u a l E v a p o tr a n sp ir a tio n ( m m )
Annual rainfall (mm)
771
772
Fig. 2. Comparison of AWRA-L simulated mean streamflow for the 278 catchments for
773
scenarios of forest cover (green triangles) and herbaceous cover (orange circles) shown in
774
two different ways. Also shown are the two models proposed by Zhang et al. (2001): (a)
775
Zhang-A and (b) Zhang-B.
776
777
778
Fig. 2. Comparison of AWRA-L simulated mean streamflow for the 278 catchments for scenarios of forest cover (green triangles) and herbaceous cover (orange circles) shown in two different ways. Also shown are the two models proposed by Zhang et al. (2001): (top panel) Zhang-A and (bottom panel) Zhang-B.
with actual FC values, the resulting values were much closer, at 2.22 and 1.79, respectively, predicting only a very small land cover influence (average forest water use is only 2 % greater than herbaceous water use). This shows that pre-vious contrasting findings can also be reproduced with the syntheticQdata.
3.2 Measurement errors are at least partly responsible
The introduction of noise in the data led to higher average optimised w values than for the experiment without noise added: 2.7 (range 0.6–9.4) for forest and 2.3 (1.3–9.2) for herbaceous cover. Importantly, for 39 % of the 3000 repli-cates, the optimised w value for forest was actually lower than for herbaceous cover. It follows that random errors in the observations reduce the likelihood that land cover influ-ence is detected, let alone accurately quantified.
3.3 Underlying climate factors may be responsible
[image:7.595.51.287.171.243.2]3468 A. I. J. M. van Dijk et al.: Land cover and water yield
before step-wise regression analysis. The ratioP/PE itself did not explain significant variance in either land cover sce-nario (r2<0.04).
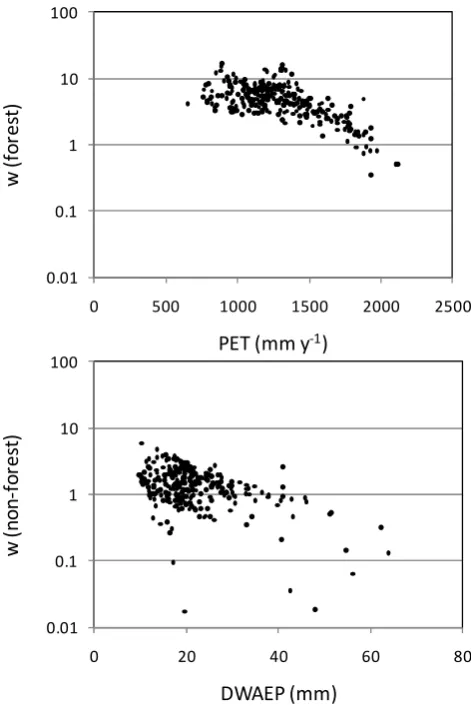
Somewhat unexpectedly, the most powerful predictor of variation inw values varied between the forest and herba-ceous cover scenarios. In the full forest cover scenario, PE itself explained 45 % (r2)of the variance in log-transformed wvalues (see Fig. 3a). Other predictors did not explain any of the residual variance. In the full herbaceous cover scenario, depth-weighted average event precipitation (DWAEP, calcu-lated as the sum of squared daily rainfall totals divided by total rainfall) explained 33 % of the variation (Fig. 3b). Al-ternatively, mean event precipitation (total rainfall divided by the number of rain days) explained 27 % of variation (instead of, not in addition to the variation explained by DWAEP). Both are indicators of the irregularity of rainfall distribution (see van Dijk, 2010c for definitions). Other predictors did not explain any of the residual variance.
It is concluded that other climate factors than only the ra-tioP/PE may have considerable influence onQand hence affect fittedwvalues. We speculate that the explicit consider-ation of temporal climate patterns may also be the main rea-son why the (uncalibrated) process model was slightly more skillful at reproducing observedQfrom the 278 catchments than the (calibrated) Zhang model.
3.4 There is structure in the data set that is at least partly responsible
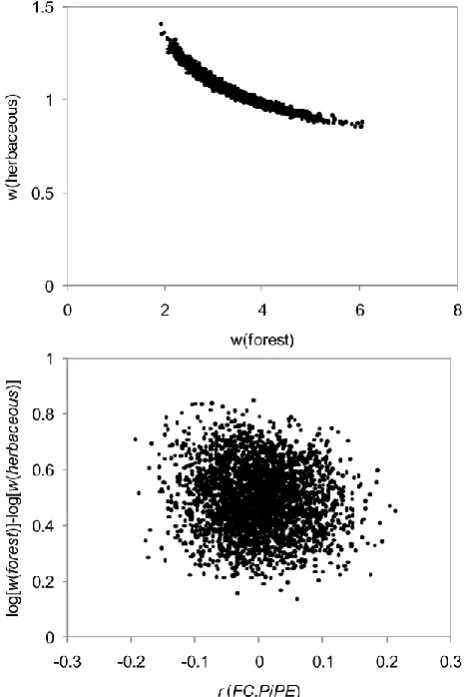
Using simulatedQfor randomly generated hypothetical for-est cover fractions (N= 3000), Zhang model parameter val-ues of 3.4±0.7 (range 1.9–6.1) and 1.1±0.1 (0.9–1.4) were fitted for forest and herbaceous cover, respectively. These av-erage values are relatively close to thewvalues of 3.6 and 1.0 fitted for the full forest and herbaceous cover scenarios (ex-periment 1). In some ex(ex-periments the optimised Zhang pa-rameters were similar to the full cover ones, whereas in other experiments they were very close to each other (Fig. 4a) (it is noted thatw(herbaceous) never exceededw(forest), unlike in the measurement error experiment). It would be tempting to conclude that the covariance between FC andP/PE in the original data set (r=0.44) was the main cause for the under-estimation of land cover influence. However, no relationship was found between the fitted parameter pair and the covari-ance between forest cover andP/PE that was introduced into the data set (Fig. 4a). Nonetheless, our manipulation of the data must have introduced another form of hidden structure in the data that affected the optimised parameter values.
779
a)
0.01 0.1 1 10 100
0 500 1000 1500 2000 2500
w
(
fo
re
st
)
PET (mm y
-1)
780
b)
0.01 0.1 1 10 100
0 20 40 60 80
w
(
n
o
n
-f
o
re
st
)
DWAEP (mm)
781
Fig. 3. Relationship between the catchment variable that explained most of the variance in
782
(log-transformed) Zhang model parameter (w) values inferred from the synthetic land cover
783experiment, (a) potential evaporation (PE) for forest catchments and (b) depth-weighted
784average event precipitation (DWAEP) for herbaceous catchments.
785786 779
a)
0.01 0.1 1 10 100
0 500 1000 1500 2000 2500
w
(
fo
re
st
)
PET (mm y
-1)
780
b)
0.01 0.1 1 10 100
0 20 40 60 80
w
(
n
o
n
-f
o
re
st
)
DWAEP (mm)
781
Fig. 3. Relationship between the catchment variable that explained most of the variance in
782
(log-transformed) Zhang model parameter (w) values inferred from the synthetic land cover
783experiment, (a) potential evaporation (PE) for forest catchments and (b) depth-weighted
784average event precipitation (DWAEP) for herbaceous catchments.
785786
Fig. 3. Relationship between the catchment variable that explained most of the variance in (log-transformed) Zhang model parameter (w)values inferred from the synthetic land cover experiment, (top panel) potential evaporation (PE) for forest catchments and (bottom panel) depth-weighted average event precipitation (DWAEP) for herbaceous catchments.
4 Discussion
4.1 Methodological problems can explain previous contrasting findings
[image:8.595.309.545.60.414.2]A. I. J. M. van Dijk et al.: Land cover and water yield 3469
the use of Budyko models as a detection method in this par-ticular application.
The synthetic experiments demonstrated that all method-ological issues tested (measurement errors, the presence of other important uncontrolled factors, structure in the catch-ment data set) were plausible and can contribute to a failure to accurately quantify land cover influence with the Budyko model that was used. In all cases, underestimation of the land cover influence was the most likely result. Desirable aspects of Budyko models are their conceptual simplicity and the minimal number of parameters. However, in qualifying the principle of Occam’s Razor, Albert Einstein (1934) proposed that “the supreme goal of all theory is to make the irreducible basic elements as simple and as few as possible without hav-ing to surrender the adequate representation of a shav-ingle da-tum of experience”. On the basis of our results we conclude that, for the purpose at hand, Budyko models fail at the sec-ond part of this statement; that is, they are too simple to ad-equately quantify the influence of land cover in collatedQ data from catchments with mixed land cover.
Although we only tested one particular Budyko model, previous studies suggest that conclusions would likely have been very similar if any other Budyko model had been used, due to the identical conceptual structure and similar function form (see e.g. Oudin et al., 2008). Moreover, we argue that the methodological issues with heterogeneous data sets such as the one we analysed are probably not limited to Budyko models but likely to extend to similarly simple top down in-ference methods.
There have been attempts to increase the predictive perfor-mance of the Budyko models by including additional vari-ables, often within a stochastic framework (e.g. Porporato et al., 2004). Those not related to land cover include absolute PE values (Peel et al., 2010), solar radiation, phase differ-ences between the seasonalP and PE patterns (Donohue et al., 2010), and the daily distribution of precipitation (see re-view in Gerrits et al., 2009). Our results suggest that some of these factors may indeed exert a similarly large or larger in-fluence on catchment response than land cover. However, try-ing to control for these additional factors introduces further parameters and observed or estimated attributes with associ-ated uncertainty. Ultimately such an approach must fall prey to the very issue that top-down approaches aim to avoid, that is, an underdetermined (or undetermined) problem in which competing hypotheses create similar outcomes and therefore cannot be tested conclusively.
This is obviously certainly not avoided by the use of dy-namic process models. An advantage of such models, how-ever, is that process assumptions can be made more explicit and individually tested against different types of observa-tions with different spatial and temporal characteristics. In light of this, we question whether it is advisable to fit a sim-plified hydrological model to collated heterogeneousQdata such as the data analysed here. Arguably, it is more pertinent to demonstrate that the observations can be explained
satis-factorily by a (more, but not unnecessarily complex) theory and therefore are not falsified by experimental knowledge. In this context, the Budyko framework may be a valuable benchmark test, whose predictive power should be matched or exceeded by any competing theory (cf. van Dijk and War-ren, 2010). It is however perhaps less advisable as infer-ence method to detect second order drivers in heterogeneous data sets.
Strictly speaking, our results are only valid for one partic-ular data set. However, all factors we investigated negatively affected accurate quantification of the land cover influence. We consider it inevitable that at least some of these prob-lems will be encountered in anyQdata set from large catch-ments with mixed land cover. Zhang et al. (2001) showed that this need not prevent detection of land cover impacts in data from catchments that represent extreme scenarios and in controlled experiments. Paired catchment experiments in particular are much more likely to adequately control for cli-mate and terrain factors and thereby allow accurate quantifi-cation of the land cover influence. Apart from experimen-tal issues associated with such necessarily small-scale ex-periments (e.g. subterranean leakage), a critical issue in the extrapolation of the results from such experiments will be the degree to which hydrological processes and land cover characteristics are representative for those in larger, non-experimental catchments (see van Dijk and Keenan, 2007 for a discussion). More elaborate process models may have a role to play here, as the influence of such representational errors can be investigated in model experiments.
4.2 Potential physical causes for reduced land cover influence in catchments with mixed land cover
3470 A. I. J. M. van Dijk et al.: Land cover and water yield
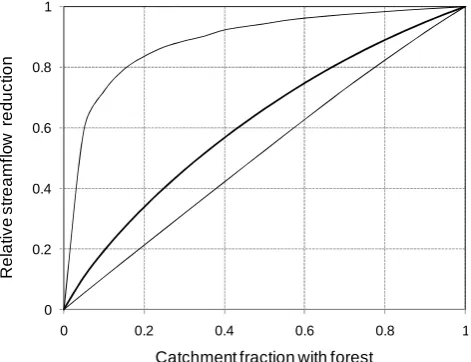
model across all catchments, varying the catchment fraction of forest from 0–100 %; and (iii) comparing the resultantQ estimates to those obtained in the case without redistribution as a reference. The experiment is similar to that reported on by Vertessy et al. (2002), and can be interpreted as a case in which forest is preferentially located in the catchment val-leys, maximising its potential streamflow impact by inter-cepting and lateral flows from upslope areas with herbaceous vegetation. The reference case (i.e. that used in all previous experiments) can be interpreted as a case where any of the hill slopes within a catchment are either fully with or without forest, in which case the forest impact scales linearly with the area under the forest. The results (Fig. 5) show that, accord-ing to the model, a considerable departure from the reference case is plausible, in line with previous modelling results re-ported by Vertessy et al. (2002, their Fig. 3). Climate humid-ity was a strong determinant of the relative influence of lat-eral interactions; the strongest non-linear response was pre-dicted for the driest catchments (top curve in Fig. 5), whereas the wettest catchments showed an approximately linear re-sponse (bottom curve). Importantly, the results predict that a small fraction of forest can cause a disproportionate reduc-tion inQ, which can indeed lead to an underestimation of land cover influence from analysing mixed land-cover catch-ments. It is noted that this model experiment likely overes-timates the importance of land cover configuration. Firstly, the scenario tested is extreme and in contrast with actual land cover distribution in the catchments, which tend to have most of the forested area on the less accessible and less produc-tive hill slopes and tops. Secondly, we are not able to vali-date the magnitude of the model-predicted fluxes against ex-perimental data. Indeed, the potential effectiveness of deep-rooted vegetation in intercepting lateral flows from upslope has been speculated on and predicted with models several times (e.g. Stirzaker et al., 2002) but so far rarely observed in reality (e.g. McJannet et al., 2000; van Dijk et al., 2007).
[image:10.595.311.544.63.412.2]An examination of the main model-predicted causes ofQ change associated with land cover change may provide some further insight into reasons why large catchments with mixed land cover might behave differently from small, homogenous (experimental) ones. The model predicts that the main cause of the different hydrological response is the greater rainfall interception loss from forest vegetation (Fig. 6). The differ-ence represents around 10–15 % of rainfall; consistent with the majority of published experiments (e.g. Roberts, 1999; although much greater differences can occur under maritime conditions, e.g. Schellekens et al., 1999; McJannet et al., 2007). A priori it would seem plausible that that the asso-ciated rapid return of moisture to the atmosphere may in-fluence rainfall generation downwind (cf. D’Almeida et al., 2007; Pielke et al., 2007; van Dijk and Keenan, 2007). If this is indeed the case, then accurate prediction of the influence of land cover change on the water balance of large catch-ments may depend on the spatial distribution of precipitation and how it is measured and represented in models. In other
Fig. 4. Zhang model parameter values fitted to synthetic mean streamflow estimates for 278 catchments produced by AWRA-L with random forest cover fractions assigned to each of the catch-ments. Data points represent the results of 3000 replicate experi-ments. (Top panel) Zhang model parameter data pairs fitted in each experiment showing a well-defined relationship; (bottom panel) the difference between log-transformed parameter values versus the correlation between synthetic forest cover fraction (FC) and catch-ment humidity (P/PE) introduced in the experiment, showing no relationship (r=0.11).
words, in sufficiently large catchments the rainfall intercep-tion effect might be mitigated by rainfall recirculaintercep-tion.
A. I. J. M. van Dijk et al.: Land cover and water yield 3471 0 0.2 0.4 0.6 0.8 1
0 0.2 0.4 0.6 0.8 1
R e la ti v e s tr e a m fl o w r e d u c ti o n
Catchment fraction with forest
[image:11.595.311.545.61.220.2]796
Fig. 5. The theoretical maximum influence of lateral water redistribution, from herbaceous to
797
forest areas, on mean streamflow (Q) as predicted by the AWRA-L model for 278 Australian
798
catchments. The middle bold and two outer lines represent the catchments with the median
799
and most extreme responses, respectively. Q reduction is shown relative to the difference
800
between the 0 and 100% forest cover cases (in the absence of redistribution a linearly
801
proportional influence would be predicted).
802
803
Fig. 5. The theoretical maximum influence of lateral water redistri-bution, from herbaceous to forest areas, on mean streamflow (Q) as predicted by the AWRA-L model for 278 Australian catchments. The middle bold and two outer lines represent the catchments with the median and most extreme responses, respectively.Qreduction is shown relative to the difference between the 0 and 100 % forest cover cases (in the absence of redistribution a linearly proportional influence would be predicted).
5 Conclusions
Controlled experiments provide strong evidence that chang-ing land cover (e.g. deforestation or afforestation) can af-fect mean catchment streamflow (Q). By contrast, a similarly strong influence has not been found in studies that interpret Qfrom multiple catchments with mixed land cover. One pos-sible reason is that there are methodological issues with the way in which the Budyko framework was used in the latter type studies. We examined this usingQdata observed in 278 Australian catchments and by making inferences from syn-theticQdata simulated by a hydrological process model (the Australian Water Resources Assessment system Landscape model). We draw the following conclusions:
1. Carrying out synthetic experiments with the process model, we could reproduce the absence of a detectable influence in mixed land-cover catchments as well as the presence of such an influence in individual catchments. In other words, previous contrasting findings could be reconciled.
2. Several potential methodological problems with the Budyko framework based inference approach applied in previous studies were investigated. The apparent ab-sence of a detectable influence when comparing mixed land-cover catchments could, at least partially, be ex-plained by the three factors investigated, viz. (i) noise in land cover, precipitation andQdata; (ii) additional catchments climate characteristics more important than
-10% -5% 0% 5% 10% 15% 20%
Es Et Ei
D if fe re n ce ( n o n -f o re st -f o re st ) a s p e rc e n ta g e o f p re ci p it a ti o n
P/PE=0.54 (N=167) P/PE=0.95 (N=87) P/PE=1.60 (N=24)
804
Fig. 6. Contribution of different evaporation terms to the increase of mean streamflow after 805
forest removal estimated by the AWRA-L model, expressed as a percentage of rainfall. 806
Values represent fluxes averaged over three groups of catchments, intended to represent 807
(from left to right) water-limited (P/PE<0.75), transitional, and energy-limited (P/PE>1.25) 808
environments. Es=soil and open water evaporation; Et=transpiration; Ei=rainfall interception 809
losses. 810
Fig. 6. Contribution of different evaporation terms to the increase of mean streamflow after forest removal estimated by the AWRA-L model, expressed as a percentage of rainfall. Values represent fluxes averaged over three groups of catchments, intended to represent (from left to right) water-limited (P/PE<0.75), transitional, and energy-limited (P/PE>1.25) environments. Es = soil and open wa-ter evaporation; Et = transpiration; Ei = rainfall inwa-terception losses.
land cover; and (iii) covariance betweenQand catch-ment attributes. Such methodological issues are likely to be found in any heterogeneous streamflow data set. 3. In addition to these methodological issues, there are also
plausible physical causes for the failure to adequately detect a land cover influence in catchments with mixed land cover. This includes the lateral redistribution of wa-ter from herbaceous to forest areas, and potential recir-culation of rainfall intercepted by the forest canopy.
Acknowledgements. This work is part of the water information research and development alliance between the Bureau of Me-teorology and CSIRO’s Water for a Healthy Country Flagship. Comments from Lu Zhang and Randall Donohue helped improve earlier versions of this paper, as did reviews by N. McIntyre, the editor, and two anonymous referees.
Edited by: R. Merz
References
Andr´eassian, V.: Waters and forests: from historical controversy to scientific debate, J. Hydrol., 291, 1–27, 2004.
Austin, J., Zhang, L., Jones, R. N., Durack, P., Dawes, W., and Hair-sine, P.: Climate change impact on water and salt balances: an as-sessment of the impact of climate change on catchment salt and water balances in the Murray-Darling Basin, Australia, Climatic Change, 100, 607–631, 2010.
[image:11.595.50.286.63.244.2]3472 A. I. J. M. van Dijk et al.: Land cover and water yield
change on flood generation, R&D Technical Report FD2120/TR, UK Department for Environment, Food and Rural Affairs, Lon-don, 84 pp., 2008.
Bosch, J. R. and Hewlett, J. D.: A review of catchment experiments to determine the effect of vegetation change on water yield and evapotranspiration, J. Hydrol., 55, 3–22, 1982.
Brown, A. E., Zhang, L., McMahon, T., Western, A., and Vertessy, R.: A review of paired catchment studies for determining changes in water yield resulting from alterations in vegetation, J. Hydrol., 310, 28–61, 2005.
Brown, A. E., Podger, G. M., Davidson, A. J., Dowling, T. I., and Zhang, L.: Predicting the impact of plantation forestry on wa-ter users at local and regional scales An example for the Mur-rumbidgee River Basin, Australia, Forest Ecol. Manage. 251, 82– 93, 2007
Bruijnzeel, L.: Hydrology of moist tropical forests and effects of conversion: a state of knowledge review, International Hydrolog-ical Programme of UNESCO, Paris/Vrije Universiteit, Amster-dam, 224 pp., 1990.
Bruijnzeel, L.: Hydrological functions of tropical forests: not seeing the soil for the trees?, Agric., Ecos. Env., 104, 185–228, 2004. Budyko, M. I.: Climate and Life Academic Press, New York,
508 pp., 1974.
Calder, I. R.: Forests andWater – Ensuring benefits outweigh water costs, For. Ecol. Man., 251, 110–120, 2007.
D’Almeida, C., V¨or¨osmarty, C. J., Hurtt, G. C., Marengo, J. A., Dingman, S. L., and Keim, B. D.: The effects of deforestation on the hydrological cycle in Amazonia: a review on scale and reso-lution, Int. J. Clim., 27, 633–647, doi:10.1002/joc.1475, 2007. Dawes, W. R., Gilfedder, M., Walker, G. R., and Evans, W. R.:
Bio-physical modelling of catchment-scale surface water and ground-water response to land-use change, Math. Comput. Simulat. 64, 3–12, 2004.
Donohue, R. J., Roderick, M. L., and McVicar, T. R.: On the impor-tance of including vegetation dynamics in Budyko’s hydrological model, Hydrol. Earth Syst. Sci., 11, 983–995, doi:10.5194/hess-11-983-2007, 2007.
Donohue, R. J., Roderick, M. L., and McVicar, T. R.: Can dynamic vegetation information improve the accuracy of Budyko’s hydro-logical model?, J. Hydrol., 390, 23–34, 2010.
Einstein, A.: On the method of theoretical physics, Philos. Sci., 1, 163–169, 1934.
Farley, K., Jobb´agy, E., and Jackson, R.: Effects of afforestation on water yield: a global synthesis with implications for policy, Glob. Ch. Biol., 11, 1565–1576, 2005.
Gash, J. H. C.: An analytical model of rainfall interception by forests, Q. J. Roy. Meteorol. Soc., 105, 43–55, 1979.
Gerrits, A. M. J., Savenije, H. H. G., Veling, E. J. M., and Pfister, L.: Analytical derivation of the Budyko curve based on rainfall characteristics and a simple evaporation model, Water Resour. Res., 45, W04403, doi:10.1029/2008wr007308, 2009.
Guerschman, J.-P., van Dijk, A. I. J. M., McVicar, T. R., Van Niel, T.G., Li, L., Liu, Y., and Pe˜na-Arancibia, J.: Water balance esti-mates from satellite observations over the Murray-Darling Basin, CSIRO, Canberra, Australia, 93, 2008.
Guerschman, J. P., van Dijk, A., Mattersdorf, G., Beringer, J., Hut-ley, L. B., Leuning, R., Pipunic, R. C., and Sherman, B. S.: Scaling of potential evapotranspiration with MODIS data repro-duces flux observations and catchment water balance
observa-tions across Australia, J. Hydrol., 369, 107–119, 2009.
Holmes, J. W. and Sinclair, J. A.: Water yield from some afforested catchments in Victoria, in: 17th Hydrology and Water Resources Symposium, Brisbane, Institution of Engineers, Australia, Bar-ton, ACT, Australia, 1986.
Jeffrey, S. J., Carter, J. O., Moodie, K. B., and Beswick, A. R.: Us-ing spatial interpolation to construct a comprehensive archive of Australian climate data, Environ. Modell. Softw., 16, 309–330, 2001.
Klemeˇs, V.: Conceptualization and scale in hydrology, J. Hydrol., 65, 1–23, 1983.
McJannet, D. L., Vertessy, R. A., and Clifton, C. A.: Observations of evapotranspiration in a break of slope plantation susceptible to periodic drought stress, Tree Physiol., 20, 169–177, 2000. McJannet, D., Wallace, J., Fitch, P., Disher, M., and Reddell, P.:
Wa-ter balance of tropical rainforest canopies in north Queensland, Australia, Hydrol. Process., 21, 3473–3484, 2007.
Milly, P.: Climate, soil water storage, and the average annual water balance, Water Resour. Res., 30, 2143–2156, 1994.
Monteith, J. L.: Evaporation and environment, Symposia of the So-ciety for Experimental Biology, 19, 205–224, 1965.
Oreskes, N., Shrader-Frechette, K., and Belitz, K.: Verification, val-idation, and confirmation of numerical models in the earth sci-ences, Science, 263, 641–646, 1994.
Oudin, L., Andr´eassian, V., Lerat, J., and Michel, C.: Has land cover a significant impact on mean annual streamflow? An interna-tional assessment using 1508 catchments, J. Hydrol., 357, 303– 316, 2008.
Pe˜na-Arancibia, J. L., van Dijk, A. I. J. M., Guerschman, J. P., Mulligan, M., Bruijnzeel, L. A. S., and McVicar, T. R.: Detect-ing changes in streamflow after partial woodland clearDetect-ing in two large catchments in the seasonal tropics, J. Hydrol., 416, 60–71, 2012.
Peel, M., McMahon, T., and Finlayson, B.: Vegetation impact on mean annual evapotranspiration at a global catchment scale, Water Resour. Res., 46, W09508, doi:10.1029/2009WR008233, 2010.
Pielke, R. A., Adegoke, J., Beltr´an-Przekurat, A., Hiemstra, C. A., Lin, J., Nair, U. S., Niyogi, D., and Nobis, T. E.: An overview of regional land-use and land-cover impacts on rainfall, Tellus B, 59, 587–601, doi:10.1111/j.1600-0889.2007.00251.x, 2007. Porporato, A., Daly, E., and Rodriguez-Iturbe, I.: Soil water balance
and ecosystem response to climate change, Am. Nat., 164, 625– 632, 2004.
Roberts, J.: Plants and water in forests and woodlands, in: Ecohy-drology, Routledge, London, UK, 1999.
Schellekens, J., Scatena, F. N., Bruijnzeel, L. A., and Wickel, A. J.: Modelling rainfall interception by a lowland tropical rain forest in northeastern Puerto Rico, J. Hydrol., 225, 168–184, 1999. Sivapalan, M., Bl¨oschl, G., Zhang, L., and Vertessy, R.: Downward
approach to hydrological prediction, Hydrol. Process., 17, 2101– 2111, 2003.
Stednick, J. D.: Monitoring the effects of timber harvest on annual water yield, J. Hydrol., 176, 79–95, 1996.
A. I. J. M. van Dijk et al.: Land cover and water yield 3473
Sun, G., Zhou, G., Zhang, Z., Wei, X., McNulty, S. G. and Vose, J. M.: Potential water yield reduction due to forestation across China, J. Hydrol., 328, 548–558, 2006.
Trimble, S. W., Weirich, F. H., and Hoag, B. L.: Reforestation and the reduction of water yield on the Southern Piedmont since circa 1940, Water Resour. Res. 23, 425–437, 1987.
Turner, K. M.: Annual evapotranspiration of native vegetation in a Mediterranean-type climate, J. Am Water Resour. Assoc., 27, 1– 6, 1991.
van Dijk, A. I. J. M.: Selection of an appropriately simple storm runoff model, Hydrol. Earth Syst. Sci., 14, 447–458, doi:10.5194/hess-14-447-2010, 2010a.
van Dijk, A. I. J. M.: AWRA Technical Report 3, Land-scape Model (version 0.5) Technical Description, WIRADA/CSIRO Water for a Healthy Country Flagship, http://www.clw.csiro.au/publications/waterforahealthycountry/ 2010/wfhc-aus-water-resources-assessment-system.pdf, (last access: 8 March 2011), Canberra, 2010b.
van Dijk, A. I. J. M.: Climate and terrain factors explaining stream-flow response and recession in Australian catchments, Hydrol. Earth Syst. Sci., 14, 159–169, doi:10.5194/hess-14-159-2010, 2010c.
van Dijk, A. I. J. M. and Bruijnzeel, L. A.: Modelling rainfall inter-ception by vegetation of variable density using an adapted analyt-ical model. Part 1. Model description, J. Hydrol., 247, 230–238, 2001a.
van Dijk, A. I. J. M. and Bruijnzeel, L. A.: Modelling rainfall inter-ception by vegetation of variable density using an adapted analyt-ical model. Part 2. Model validation for a tropanalyt-ical upland mixed cropping system, J. Hydrol., 247, 239–262, 2001b.
van Dijk, A. I. J. M. and Keenan, R. J.: Planted forests and water in perspective, Forest Ecol. Manage., 251, 1–9, doi:10.1016/j.foreco.2007.06.010, 2007.
van Dijk, A. I. J. M. and Renzullo, L. J.: Water resource monitoring systems and the role of satellite observations, Hydrol. Earth Syst. Sci., 15, 39–55, doi:10.5194/hess-15-39-2011, 2011.
van Dijk, A. I. J. M. and Warren, G.: AWRA Tech-nical Report 4, Evaluation Against Observations, WIRADA/CSIRO Water for a Healthy Country Flagship, http://www.clw.csiro.au/publications/waterforahealthycountry/ 2010/wfhc-aus-water-resources-assessment-system.pdf, (last access: 8 March 2011), Canberra, 2010.
van Dijk, A. I. J. M., Evans, R., Hairsine, P. B., Khan, S., Nathan, R., Paydar, Z., Viney, N., and Zhang, L.: A Systems View of Water in the Murray-Darling Basin. 2. Risks to Our Shared Wa-ter Resources, CSIRO/Murray-Darling Basin Commission, Can-berra, 2006.
van Dijk, A. I. J. M., Hairsine, P. B., Arancibia, J. P., and Dowl-ing, T. I.: Reforestation, water availability and stream salinity: A multi-scale analysis in the Murray-Darling Basin, Australia, Forest. Ecol. Manage., 251, 94–109, 2007.
van Dijk, A. I. J. M., Bacon, D., Barratt, D., Crosbie, R., Daamen, C., Fitch, P., Frost, A., Guerschman, J. P., Henderson, B., King, E. A., McVicar, T., Renzullo, L. J., Stenson, M. P., and Viney, N.: Design and development of the Australian Water Resources As-sessment system. In: Proceedings, Water Information Research and Development Alliance Science Symposium, August 2011, Melbourne, 2012.
Vertessy, R. A., Zhang, L., and Dawes, W. R.: Plantations, river flows and river salinity, Australian Forestry, 66, 55–61, 2002. Zhang, L., Dawes, W. R., and Walker, G. R.: Predicting the effect of
vegetation changes on catchment average water balance. Tech-nical Report 99/12, Cooperative Research Centre for Catchment Hydrology, Canberra, 1999.
Zhang, L., Dawes, W. R., and Walker, G. R.: Response of mean an-nual evapotranspiration to vegetation changes at catchment scale, Water Resour. Res., 37, 701–708, 2001.