DRYING SIMULATION OF CERAMIC SHELL BUILD UP PROCESS
Zawati Harun
1, D.T.Gethin
21University Tun Hussein Onn, Parit Raja, 86400, Batu Pahat, Johor, Malaysia.
(phone:+660-7453 7717; Fax:+ :+660-7453 6080) E-mail: [email protected], [email protected]
2Civil and Computational Engineering Centre, University of Wales, Singleton Park, Swansea, SA2 8PP,
United Kingdom
(phone:+440-1792 295902; Fax:+440-1792 295903) E-mail:[email protected]
Abstract
In this work, a two-dimensional numerical model for the convective drying process of ceramic shell layers was developed. The governing system of fully coupled non-linear partial differential equations describing the process was derived from a mechanistic approach along with the implementation of continuum model. The most extensive formulation of the material used in many hygrothermal and soil transport investigation was adopted as the basis for further development in this work. Two examples comprising one dimensional brick drying and shell drying are solved to validate and demonstrate robustness of the approach. Validation within a one dimensional framework showed that the model presented is in a good agreement with other studies that have been reported previously in the drying of porous material. A two layers case study which illustrate the drying of ceramic shell layers are compared and contrasted against experimental data on shell drying, showing good agreements.
Keywords: ceramic shell layers, convective drying, porous media.
1. Introduction
In the investment casting process, the formation of a ceramic shell mould is needed before the cast body can be formed. The formation of the ceramic shell mould involves several dipping and drying stages to form a strong multilayer mould system. The drying stage is very critical to the process as the ceramic material is very sensitive to any thermophysical change and this is always related to the variation in moisture content in a non-linear way[1]. In fact the drying stage is one of the longest steps in shell manufacture, therefore failure of an investment mould can be extremely expensive not
only because of the loss of raw materials, but in terms of processing time and the cost of the drying process which is energy intensive.
Most of the previous drying during the ceramic shell build up processes have been studied and explored through an experiment technique along with theoretical evaluation. Although experimentation has contributed to significant process understanding and hence improvement, it does not supply a detailed knowledge of the drying mechanism such as its material and transport properties that highly influence the drying mechanism. Therefore a theoretical and mathematical modelling that is based on the laws of heat, mass and gas transport are incorporated into a numerical solution which give a good prediction of the controlled variables will aid experimentation and improvement in drying performance.
A ceramic shell system is an unsaturated porous material which contains a three-phase system (liquid, gas and solid). Therefore modelling of this drying porous system involves heat, mass and gas transport phenomena. So in this work, a comprehensive model [2] which includes heat, mass and gas transport was selected. This model provides a systematic way to incorporate transport through capillary, convective and diffusive mechanisms. In fact the derivation of the transport equations is based on the drying working parameters such as temperature, gas and pore water pressure that can be measured within laboratory experiments. This model may be contrasted against most of the previous drying works[3, 4] that use irreversible phenomena with an introduction of the “phenomenalogical” coefficients which are not easily determined experimentally [4].
provide an attractive route to investigate the drying phenomena in the shell layering process.
2. Theoretical formulation
The theoretical formulation of the heat, mass and gas transport balance equation is based on the work by Ben Nasrallah[5] which is one of the most significant advances in developing Whitaker’s theory. Based on the above analysis, the governing equations of the model are expressed in terms of the chosen state
variables; pore water pressure, Pl temperature, T and
gas pressure, Pg. The gas is assumed to follow an ideal
gas law and is a mixture of dry air and vapour portion. The time derivative of moisture (liquid and vapour) transport as given below shows the gradient in liquid flux, the influence of vapour pressure gradient and vapour bulk flow with gas pressure gradient.
( l l) v v
(
v g)
gv l
lS φρ S ρ v ρ v ρ v
φρ ∇ − ∇ − −∇ = ∂ ∂ + ∂ ∂ t ) ( t )
( (1)
Water and gas velocity can be easily derived from Darcy’s law.
(P Z)
x l l ∇ + ∂ ∂ − = µ ν l l
Kk (2)
( )
g l P x ∂∂ − = µ ν g gKk (3)
where Z is the vertical elevation from a datum. Transport in the vapour state by diffusion is given by;
v v atm g v D v ρ ρ ν ε ∇ −
= . (4)
where Datm is the molecular diffusivity of water vapour
through dry air, calculated by the following semi-empirical relationship[6]. By simplifying the above equation according to the measured variables gives;
∇ ∂ ∂ + ∂ ∂ + + ∇ ∂ ∂ − = g g s s l l s v g atm v P P rh T rh rh P P rh D
v ρ ρ β ρ
ρ νε
)
( (5)
The energy equation employed considers the effect of conduction, latent heat and convection phases as given below;
(
)
− ∇ − + ∇ − ∇ ∇ = ∂ + − ∂∑
∑
= = i v l ai r i pi
g v v v v l a i i i i s p V C T T L V V T t C S C , , , , ) ( ) ( ) ( 1 ρ ρ ρ λ ρ φ ρ φ (6)
By applying a mass balance to the flow of dry air within the pores of the ceramic body dictates that the time derivative of the dry air content is equal to the spatial derivative of the dry air flux as given in Eqn (7) and Eqn (8).
{
}
(
)
v v g a a g t S ν ρ ν ρ ρ φ − −∇ = ∂∂ (7)
{
}
v v atm g v g g g a a g D P KK t S ρ ρ ν ε ρ µ ρ ρ φ ∇ − − ∇ ∇ = ∂ ∂. (8)
3. Thermodynamic relationship
The existence of a local equilibrium at any point
within the porous system is assumed. The equilibrium vapour pressure can be approximated by Kelvin’s equation below. This equation shows that the
equilibrium of water vapour, Pv differs from the
saturation pressure Pvs, due to the curvature of the
interface between capillary or hygroscopic water and the gas phase inside the pores of the medium;
− − = − = T R P P T R P rh v l l g v l c ρ ρ exp exp )
( (9)
The vapour partial pressure can be calculated as a function of local temperature and relative humidity using the relationship;
( )
sv rh P
P = (10)
where the saturation vapour pressure, Pv may be
estimated using the saturated vapour density as a function of temperature and is given in [7]. This has been fitted to the vapour-pressure–temperature data from the steam tables. The degree of saturation S (considering together physically hygroscopic and capillary water, if the latter is contained in the pores) is an experimentally determined function of capillary pressure and temperature.
)
,
(
p
T
S
In many soil transport and hygrothermal problems, this is expressed as the combination of temperature effect in reference[8, 9].
(
)
m n r s r l TS
+ = − − = ) ( 1 1
αϕ
θ
θ
θ
θ
(12)where the parameters α, n and m are three different
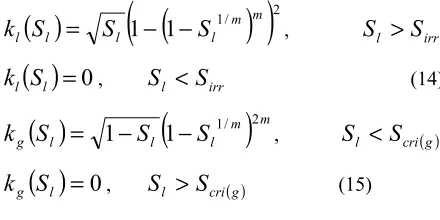
porous material properties that are directly dependent on the shape of the water retention curve. In this work, the same corresponding parameters that have been used in the above saturation curve are chosen. In this selected work [10], both the permeabilities of water and gas were approached using Mualem’s model. These formulations are given here as below.
( )
(
(
1/)
)
21
1
l m ml l
l
S
S
S
k
=
−
−
,S
l>
S
irr( )
l=
0
l
S
k
,S
l<
S
irr (14)( )
(
m)
ml l l
g
S
S
S
k
=
1
−
1
−
1/ 2 ,S
l<
S
cri( )g( )
l=
0
g
S
k
,S
l>
S
cri( )g (15)
4. Material data for the ceramic body
[image:3.612.72.292.262.372.2]In this work the ceramic body was considered to have the same properties as a nonhygroscopic brick. This is because the drying process in this study was considered far below the temperature at which bound water becomes a consideration[11]. Due to the low temperature and the slow drying process, the bound-moisture flux effects are negligible when compared with the free moisture flux.
Table 1: Physical properties of ceramic body and transport parameter.
ρo φ K(m2) Cp λ Sirr
2000 0.35 1x10-14 925 1.8 0.1
5. Boundary Condition
The general boundary condition formulation for convective mass and heat transfer are given by:
(
v)
s v
m
P
P
h
−
=
∞m
J
(15)(
−
∞)
=
h
cT
fT
m
J
(16)6. Solution of governing equations and
numerical method
The coupled heat and mass transfer equations described above, in 2-dimensions can be written into a matrix form as follows;
( )
[
] { }
(
[
K( )
]
i[
K( )
]
i)
{ } ( )
R Z tC Φ =∇ cx∇Φ x+ cy∇Φ y Φ + ∇
∂ ∂
Φ (16)
where {Φ}= {Pl,T,Pg} is the column of
unknowns;[C],[Kcx]and [Kcy] are 3x3 matrices. Each
element of the matrix, is a coefficient for the unknown
{φ}; ix and iy are the unit direction vectors. This
simplified second order non-linear coupled partial differential equation, is then discretised using the FE method. By minimising the residual error using the Galerkin method, followed by the application of Greens theorem to the dispersive term involving second order derivatives, this simplified combined equation set can be expressed in the following form.
{ }
0
)
(
)
(
)
(
Φ
Φ
+
C
Φ
Φ
+
J
Φ
=
K
(17)where, = 0 33 32 31 24 23 22 21 14 13 12 11 K K K K K K K K K K K K = 33 32 31 23 22 21 13 12 11 C C C C C C C C C C ∂ ∂∂ ∂∂ ∂ = Φ t P t T t P gs s ws
=
Φ
gs s wsP
T
P
=
3 2 1J
J
J
J
In which typical elements of the matrix are
∑ ∫
= ΩΩ
∇
∇
=
n 1 s e s r ij ij ed
N
N
K
K
∑ ∫
= Ω Ω = n 1 s e s r ij ij e d N N C C e i r e r i i e ed
J
N
zd
N
K
J
∫
∫
Γ Ω
Γ
−
Ω
∇
∇
=
4(i, j=1,2,3) and (
n
- outward normal vector to thenonlinear second order differential equations above were then solved by using a fully implicit backward time stepping scheme along with a Picard iterative method to account for non-linearity.
7. Result and discussion
Testing of the model for verification was performed
for a nonhygroscopic material within a one- dimensional framework. The geometry was described by a brick comprising side 10.7cm long and 3.2cm thick. The short sides and bottom were treated as being insulated and impermeable and the heat transfer and drying process takes place at the top exposed surface only. This enables validation against the work by Stanish et. al[6] The relevant material properties are presented in the Table 1 and the matrix is assumed to be saturated at the commencement of the drying process. Experimental data are chosen based on the related references[5,6,10] and simulation results in this
model, for brick drying at 75°C with heat and mass
transfer hT= 6 W/m2/K and hm = 0.008 ms-1 are shown
in Figure 1.
0 10 20 30 40 50 60 70
0 20 40 60 120 180 240 300 360 420 480 540
Time(minutes)
S
atu
ra
ti
o
n
,s
l(
%
)
0 10 20 30 40 50 60 70 80
Te
m
p
er
at
ur
e,
T
Experiment(sl), ref[10] Model(sl) Experiment(T), ref[10] Model(T)
Figure 1: liquid saturation and temperature changing with time.
Figure 1 showed the simulation results and experimental data are in a close agreement. Clearly the figure shows that the drying behaviour of non-hygroscopic brick is separated into two sharply distinct stages. Initially, the drying rate is very high due to liquid migration to the surface nearly as rapidly as it evaporates from the surface, in which a condition of constant drying rate occurs. During this stage the movement of liquid is almost maintained by the capillarity of the free liquid water content. At this time, the temperature will slowly increased gradually starting from the top surface and along with the slow increment of temperature in the middle of the sample as shown in Figure 1. Over the drying duration, the
saturation level will decrease and at nearly 60 minutes, it displays the characteristics of a falling rate period where there is a reduction in the rate of moisture loss. Theoretically, the saturation level will recede continuously into the interior of the materials and the dry zone will extend gradually.
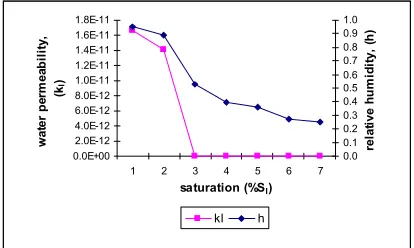
0.0E+00 2.0E-12 4.0E-12 6.0E-12 8.0E-12 1.0E-11 1.2E-11 1.4E-11 1.6E-11 1.8E-11
1 2 3 4 5 6 7
saturation (%Sl)
w
at
er
p
er
m
ea
b
ilit
y,
(kl
)
0.0 0.1 0.2 0.3 0.4 0.5 0.6 0.7 0.8 0.9 1.0
re
la
ti
ve
hu
m
idi
ty
, (
h
)
[image:4.612.318.525.154.278.2]kl h
Figure 2: Permeability and relative humidity against Saturation.
[image:4.612.80.285.364.497.2]This is also reflected in the permeability properties as presented Figure 2, where the permeability change starts to show a small reduction when nearing hygroscopic saturation. Also, as can be seen from this figure, the permeability properties drop close to zero at the saturation value 0.1. This is due to failure of liquid transport by capillary action. This is no longer possible below the irreducible saturation level[12, 13]. It has been found that the experimental detection of very low permeability is extremely difficult and it is generally taken as equal to zero in the drying process. Figure 2, also includes the variation of relative humidity within the porous matrix as a function of saturation. Above the critical saturation, the humidity remains close to a saturated humidity condition and below this value it shows the falling rate condition where the vapour mechanism plays an important role in changing the local humidity. When near to the irreducible saturation, the relative humidity just shows a very small change, indicating that the minimum water content to which a material can theoretically be dried under the nonhygroscopic condition.
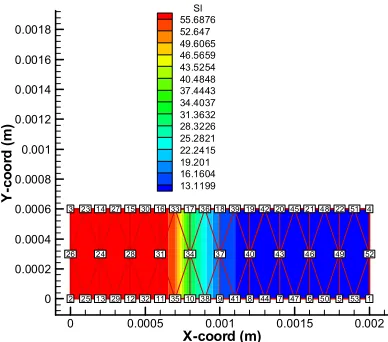
Based on the above validation, the simulation of the same material with comprising two layers shell with
the one side convective drying wasdeveloped. Due to
with different saturation across the domain is shown in Figure 3.
1 2
3 4
5 6 7 8 9 10 11 12 13
14 15 16 17 18 19 20 21 22
23
24
25 26
27
28
29 30
31
32 33
34
35 36
37
38 39
40
41 42
43
44 45
46
47 48
49
50 51
52
53
X-coord (m)
Y-co
o
rd
(m
)
0 0.0005 0.001 0.0015 0.002
0 0.0002 0.0004 0.0006 0.0008 0.001 0.0012 0.0014 0.0016 0.0018
Sl 55.6876 52.647 49.6065 46.5659 43.5254 40.4848 37.4443 34.4037 31.3632 28.3226 25.2821 22.2415 19.201 16.1604 13.1199
Figure 3: Schematic for the initial condition of two layers system of the shell body.
As shown in Figure 3 the shell layers were described with 2 mm thickness and drying takes place only at the node 3, 26,2 while other sides are treated insulated which is appropriate to reflect the zero gradient through a long straight shell section and the conditions that applies at the wax surface corresponding to nodes 1,52, and 4. All other parameters such as temperature
(at 23°C), gas pressure (1 bar) are assumed constant
throughout the body. The heat and mass transfer
coefficient values which are 2 W/m2K and 0.001 ms-1
along with the ambient relative humidity of 50% and
temperature at 23°C are used as the best approximation
in describing a slow and a controlled drying shell process.
X-coord (m)
Y
-c
oor
d
(m
)
0 0.0005 0.001 0.0015 0.002
0 0.0002 0.0004 0.0006 0.0008 0.001 0.0012 0.0014 0.0016
0.0018 30.0858Sl
[image:5.612.73.267.113.284.2]30.0837 30.0816 30.0795 30.0774 30.0753 30.0732 30.0711 30.069 30.0669 30.0648 30.0627 30.0606 30.0585 30.0564
Figure 5: Saturation contour at 25 seconds drying times
At the beginning of the drying process, there is a balancing or transition that shows movement of the moisture content from the wet layers to the dried inner layer within 1 minute as presented in Figure 5 and Figure 6. This penetration of moisture is strongly influenced by the properties that initially exist within the previously dried inner layer. This still indicates that the process occurred in the presence of free water. As the initial transient is finished, then the moisture gradient starts to decrease and the moisture distribution across the domain levels out. Over the drying times as expected the greatest changes are observed at the convective side (as presented in Figure 6) and the remaining saturation level are compared well with shell drying experimental data[14].
X-coord (m)
Y
-c
oor
d
(m)
0 0.0005 0.001 0.0015 0.002
0 0.0002 0.0004 0.0006 0.0008 0.001 0.0012 0.0014 0.0016
0.0018 Sl
[image:5.612.320.515.264.427.2]12.8788 12.8718 12.8647 12.8576 12.8506 12.8435 12.8364 12.8294 12.8223 12.8152 12.8082 12.8011 12.794 12.787 12.7799
Figure 6: Saturation contour at 2 hours drying times
8. Conclusion.
[image:5.612.85.273.507.663.2]Notations :
T = Temperature, K
P = pressure, Pa
v = velocity, ms-1 ρ = density, kg/m3
φ = porosity S = saturation
R = gas constant, J/ (mol K) t = time, s
k = relative permeability
K = intrinsic permeability (m2)
Cp = heat capacity, J/(mol K)
θ = volumetric
χ = thermal conductivity, (W/mK)
Subscripts:
a,c.v,g,l = air, capillary, vapour, gas, liquid, s = saturated
irr =irreducible cri = critical r = residual
9. References
1. George W.S., Theory of Drying. Journal
American Ceramic Society, 1990. 73(1): p.
3-14.
2. Whitaker S., Simultaneous Heat, Mass and
Momentum Transfer in Porous Media: A Theory of Drying. Advances in Heat Transfer,
1977. 13: p. 119-203.
3. Keum Y.T., Jeong J.H., and Auh K.H.,
Finite-element Simulation of Ceramic Drying Processes. Modelling Simulation Material
Science Engineering, 2000. 8: p. 541-556.
4. Malan A.G., Investigation into the Continuum
Thermodynamic Modelling of Investment Casting Shell-mould Drying. September 2002, University of Wales, Swansea,
5. Ben Nasrallah S., Detailed Study of A Model
of Heat and Mass Transfer During Convective Drying of Porous Media. International Journal
Heat and Mass Transfer, 1988. 31: p.
957-967.
6. Stanish M.A., Schajer G.S, and Kayihan F., A
Mathematical Model of Drying for Hygroscopic Porous Media. AIChE, 1986.
32(8): p. 1301-1311.
7. Mayhew Y.R. and Rogers G.F.C.,
Thermodynamic and Transport Properties of Fluids. 1976: Oxford, Blackwell.
8. Van Genucthen M.T., A Closed-form
Equation for Predicting the Hydraulic Conductivity of An Unsaturated Soils. Soil
Science Soc. American Journal, 1980. 44: p.
892-898.
9. Grant S.A., and Salehzadeh, H., Calculation
of Temperature Effects on Wetting Coefficients of Porous Solids and Their Capillary Functions. Water Resources Research Journal, 1996. p. 261-270.
10. Baroghel-Bouny, V., Characterization and
Identification of Equilibrium and Transfer Moisture Properties for Ordinary and High-performance Cementitious Materials. Cement
and Concrete Research, 1999. 29: p.
1225-1238.
11. Hansen K.K, Unfired clay bricks-retention
curves and liquid diffusivities. Building Physics, 2002.
12. Spolek, G.A., and Plumb O.A., Capillary
pressure in softwood. Wood Science and Technology, 1981. 15, p. 189-199.
13. Tesoro F.O, Choong E.T., and Kimbler O.K.,
Relative permeability and the porous pore structure of wood. Wood and Fibre Science, 1974. 6(3), p. 226-236.
14. Leyland S., and Jones S., The Effect of
Varying The Intercoat Drying Time Upon The Rate of Moisture Removal From Investment Casting Shell Mould. in 22nd Bicta