vi
ABSTRACT
vii
ABSTRAK
viii
TABLE OF CONTENTS
CHAPTER TITLE PAGE
1 SUPERVISOR VALIDATION TITLE DECLARATION DEDICATION ACKNOWLEDGEMENT ABSTRACT ABSTRAK
TABLE OF CONTENTS LIST OF FIGURES LIST OF TABLES
LIST OF ABBREVIATIONS LIST OF APPENDICES
INTRODUCTION 1.1 Project Background 1.2 Problem Statement 1.3 Objectives
1.4 Scope of Works 1.5 Thesis Outlines
ix 2
3
4
LITERATURE REVIEW 2.1 Previous Researches
METHODOLOGY 3.1 Introduction 3.2 Project Flow Chart 3.3 Project Review 3.4 AHP Method
3.5 Application of AHP Method 3.5.1 Built up Hierarchy 3.5.2 Pairwise Comparison 3.5.3 Eigenvalue Method 3.6 Fuzzy AHP Method
3.7 Application of Fuzzy AHP Method
RESULTS AND ANALYSIS 4.1 Introduction
4.2 AHP Method
4.2.1 Built up Hierarchy 4.2.2 Pairwise Comparison 4.2.3 Ranking of Priorities
4.2.4 Calculation for Criteria Eigenvector 4.2.5 Calculation for Alternative Eigenvector 4.2.6 Result for AHP Method
4.3 Fuzzy AHP Method
4.3.1 Pairwise Comparison
4.3.2 Comprehensive Pairwise Comparison
x 5 CONCLUSION
5.1 Introduction
5.2 Conclusion of AHP Method 5.3 Conclusion of Fuzzy AHP Method
5.4 Comparison Between AHP and Fuzzy AHP Method 5.5 Future Works
REFERENCES APPENDIXES
61 62 63 64 66
xi
LIST OF FIGURES
FIGURE. NO TITLE PAGE
1.1 3.1 3.2 3.3 3.4 3.5 3.6 3.7 4.1 4.2 4.3
Typically Distribution Feeder and AR Location Project Flow Chart
AHP Major Step Flowchart AHP Hierarchy
Pairwise Comparison Matrix Fuzzy Logic Approach Step of Fuzzy AHP Method
The Intersection Between M1 and M2 Hierarchical Tree
Hierarchical Tree for Criteria Hierarchical Tree for Alternatives
xii
LIST OF TABLES
TABLE. NO TITLE PAGE
3.1 4.1 4.2 4.3 4.4 4.5 4.6 4.7 4.8 4.9 4.10 4.11 4.12 4.13 4.14 4.15 4.16 4.17 4.18 4.19
AHP 1-9 Scale Data Collected
Intensity of Importance Pairwise Comparison
Decimal Pairwise Comparison Result for First Iteration Result for Second Iteration Result for Third Iteration Ranking of Priority for Criteria Pairwise Comparison for Load Pairwise Comparison for Location Pairwise Comparison for Length Pairwise Comparison for C.I Ranking of Priority for Load Ranking of Priority for Location Ranking of Priority for Length Ranking of Priority for C.I First Decision Maker Second Decision Maker Third Decision Maker
xiii 4.20
4.21 4.22 4.23 4.24 4.25
Fuzzy Evaluation Matrix for Criteria Fuzzy Evaluation Matrix for Load Fuzzy Evaluation Matrix for Location Fuzzy Evaluation Matrix for Length Fuzzy Evaluation Matrix for C.I Result for Fuzzy AHP Method
xiv
LIST OF ABBREVIATIONS
AHP - Analytical Hierarchy Process
AR - Auto-Recloser
MCDM - Multicriteria Decision Making Method MPGA - Multiple-Population Genetic Algorithm
GA - Genetic Algorithm
SAIFI - System Average Interruption Frequency Index C.I - Composite Index Reliability
LOC - Location
DG - Distribution Generation VoLL - Value of Lost Load
TFN - Triangular Fuzzy Numbers
xv
LIST OF APPENDICES
APPENDIX TITLE PAGE
A Datasheet SEL-351R Recloser Control 71
B Datasheet SEL 651R Recloser Control European Patent Application
91
1
CHAPTER 1
INTRODUCTION
1.1 Project Background
In electric power distribution system, an AR is used as circuit breaker equipment that can automatically open and close the breaker due to a fault. The faults most common on overhead lines are transient, semi-permanent or permanent in nature and permanent fault [1].
2 Semi-permanent or permanent in nature fault commonly cause by a small branch falling onto the line. An immediate de-energizing of the line and subsequent auto-reclosing does not clear the fault. Instead, a coordinate time-delayed trip would allow the branch to be burned away without damage to the system. The permanent faults are those will not clear upon tripping and reclosing. Main cause due to permanent fault on an overhead line is broken wire causing a phase to open, or the broken pole causing the phase to short together [2]. Fault on the underground cables should be considered permanent. Cable fault should be cleared without auto-reclosing and the damage cable repaired before service is restored.
At the present time, Sarawak Energy Berhad only provide for distribution electricity at 33kV and 11kV. The numbers of ARs place along a spur lines is not more than 3 to maintain the effectiveness of AR. Besides that, the limitation numbers of ARs also subject to cost constrain where the equipment itself can cost up to RM 60, 000 per AR and the installation can cost up to RM 20, 000. For the time being, there were almost 200 AR place throughout Sarawak where in Kuching itself there were almost 50 AR was installed.
3 Recently, various methods have been developed to find the location of AR in distribution network such as Genetic Algorithm (GA), Ant Colony System Algorithm, Cost Analysis and Multiple-Population Genetic Algorithm (MPGA). The Multicriteria Decision Making Method (MCDM) has been widely used in power system currently. MCDM identifies and chooses alternative based on the value and preference of decision maker. Making a decision implies that there are alternative choices to be considered, and in such a case not only to identify as many of these alternative as possible but to choose best alternative that fits with our goals, objective, desires, values and so on [3]. In this paper, the MCDM is propose and used to determine suitable location of AR in feeder.
The Fuzzy AHP is one of the MCDM group and extension from AHP to efficiently handle the fuzziness of the data involved in the decision making. It is easier to understand and it can effectively handle both qualitative and quantitative data in the multi-attribute decision making problems. In this approach triangular fuzzy numbers are used for the preferences of one criterion over another and then by using the extent analysis method, the synthetic extent value of the pairwise comparison is calculated [4].
4 1.2 Problem Statement
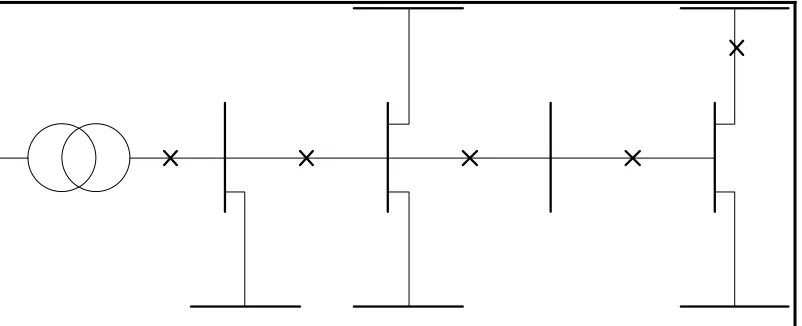
[image:14.612.131.532.443.606.2]The flow of power is always from the substation transformer to the individual customers for the typical radial feeder. For a fault anywhere on the feeder showed in Figure 1.1, only one AR operates which is the closest to the fault typically to minimize the number of affected customers. Assuming that when there is fault occurs on the line, the first AR location at upstream of the fault will operate in the presence of a fault anywhere on the line. Then the customers locate at downstream of the AR will also be affected by this fault. A faulted branch may be energized from both sides and several protection devices may need to operate in order to completely interrupt the current. Having many protection devices in the system required a lot of money. By using Multi-Criteria Decision Making Method (MCDM), it can analyze the system and decide the condition of the area whether it is critical, less critical or normal area. When the condition already being discovered, it will calculate suitable location of AR are needed in each condition area
5 1.3 Objectives
The objectives of this project are:-
1. To propose the Multi-Criteria Decision Making Method (MCDM) to find the best location of AR in the power distribution system.
2. To determine the appropriate location for the placement of AR in power distribution system based on the priority ranking.
3. To increase the reliability of protection in distribution network.
1.4 Scope of Work
The scopes of this project are:-
1. Research only cover for the radial system at 11kV on distribution network.
2. The research only focuses on suitable location to place AR in the Sarawak distribution system.
6 1.5 Thesis Outline
This thesis consists of five chapters. The current chapter mainly presents the background, the objective and the significance of this study. It also provides the general development of method used in determining the location of AR in distribution system and its benefiting contribution towards electricity distribution globally.
Chapter 2 consists of previous studies and research that are relevance in determining the placement of AR in distribution system. As this study uses multi criteria decision making method, Analytical Hierarchy Process (AHP) and Fuzzy AHP is also discussed in this chapter.
Chapter 3 discussed the methodology that is used for this study. It details the process that has been carried out for the short listing of alternatives and the steps taken in building the AHP and Fuzzy AHP model for this study.
Chapter 4 details the analysis and the result of the study. Every chosen criteria and alternatives is assessed individually and related detailed calculation is executed to see their values in the ranking of priorities for the determination of the placement of AR. Pairwise comparison and the results are also discussed in this chapter.
7
CHAPTER II
LITERATURE REVIEW
2.1 Previous Researches
8 Then, S. Jamali [8] explained that the optimal placement of recloser and sectionalizers in overhead distribution network to reduce Non-Distributed Energy cause by permanent fault. This research proposed the Numbering Method to reduce the non distributed energy and describe for optimal placement of recloser and sectionalizer in the network. For the advantage of this research is location of recloser and sectionalizer on a distribution feeder to balance the non distributed energy including the energy cost and installation cost and the disadvantage is the research limit for the Iranian distribution feeder and other country using the same power distributed only.
In the research by Lingfeng Wang [9] proposed the new method named Ant Colony System Algorithm in order the find the optimum recloser placement in distribution generation. The advantage of this research is the optimal recloser locations define by minimizing a composite reliability index to enhance power system reliability in distribution network. Then, the disadvantages of its are limit for small range power distribution system and the operational cost by minimizing customer interruption cost should be incorporated see the comprehensive reliability indices.
9 other method may be used to planning new DG-enhance feeder design in order to improve power system distribution networks.
For the research by Amir Hisham Hashim [11] proposed the Sabah Electricity (SESB) operates a vertically integrated electricity utility in East Malaysia. It is currently embarking on an initiative to improve the reliability of its 11KV distribution network which is prone to tripping due to vegetation growth along their long spur lines. Apart from that, another proposed solution is to install auto reclosers.(AR) at appropriate locations in their network. This work deals in developing a methodology to determine the most economic location of ARs and their numbers to be installed. In order to do that, data in the form of customer types, load levels and network topology were collected from site visits at SESB.
The study then used an estimated Value of Lost Load (VoLL) to quantify the financial losses that customers suffer given a loss of supply. The proposed method to determine the recloser location in this research is Cost Analysis and its advantages is demonstrated for selecting an optimal location of Auto-Recloser placement, the location determines using minimizing risk levels of the feeder and the impact of the tripping and probabilities of tripping implemented in this paper. The disadvantages of this research is this method can be confine to Sabah Electricity Distribution Network only and to determined the location the Auto-Recloser in distribution network. This method has no impact in improving power system distribution networks and useful for the first approximation for real Auto-Recloser placements.
10 reliability of service. A composite reliability index is defined as the objective function in the optimization procedure. Then, the zone-network method is introduced for reliability evaluation. The proposed method used in this research is Multiple-Population Genetic Algorithm (MPGA) and the advantages of the research is using the MPGA to improve reliability of power system distribution network and optimization method used to seek the optimal recloser location. However there are few area need to be improved when using this method such as investigate the simultaneous placement of both reclosers and distributed generators hich are dependant on each other. Besides that the operational cost should be incorporated by minimizing the customer interruption cost.
11
CHAPTER III
METHODOLOGY
3.1 Introduction
This chapter will discuss on overall method involved on selecting the best placement of AR in distribution system. The Multicriteria Decision Making Method (MDCM) such as AHP method and Fuzzy AHP method will be used in order to identify the best placement of AR in distribution system.
3.2 Project Flow Chart
12 also describes the phases of project achievement from beginning until the end of this project.
13 3.3 Project Review
Figure 3.1 shows the overall processes involved in executing this project. The process will be divided into eight stages accordingly. The first stage is to study literature review from previous research to gain the knowledge and information required of AR placement. The comparisons from previous research are used to get better improvement in this project. The project will be followed by the second stage which is data collection. All the data required to get the best placement of AR will be identify in this stage. Once the data is collected, the third stage will begins where the understanding of the method need to be practiced in order to identify the best placement of AR in distribution system.
Next, stage four refers to the evaluation of the data using AHP method and stage five involved the evaluation of data using the Fuzzy AHP method. The Microsoft Office Excel is used in this stage. The result and analysis of the effectiveness placement of AR will be explained on stage six, and then the comparisons between both methods will be elaborated in stage seven, thus suggesting which one is the best method used in terms of the placement of AR in distribution system. Finally, the conclusions for the whole process involved in this project will be explained in stage eight.
3.4 AHP Method
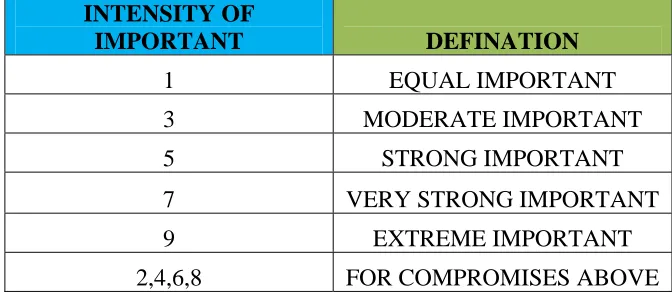
14 alternatives are determined by making pairwise comparisons. In pairwise comparison,
the decision maker examines two alternatives by considering one criterion and indicates
a preference [8-9]. These comparisons are made using a preference scale, which assigns
numerical values to different levels of preference. The standard preference scale as
show in Table 3.1, used for AHP is 1-9 scale which lies between “equal importance” to
“extreme importance” where sometimes different evaluation scales can be used such as
1 to 5. In the pairwise comparison matrix, the value 9 indicates that one factor is
[image:24.612.158.494.334.480.2]extremely more important than the other, and the value 1/9 indicates that one factor is extremely less important than the other, and the value 1 indicates equal importance [10].
Table 3.1: AHP 1-9 Scale
INTENSITY OF
IMPORTANT DEFINATION
1 EQUAL IMPORTANT
3 MODERATE IMPORTANT
5 STRONG IMPORTANT
7 VERY STRONG IMPORTANT
9 EXTREME IMPORTANT
2,4,6,8 FOR COMPROMISES ABOVE
Therefore, if the importance of one factor with respect to a second is given, then the importance of the second factor with respect to the first is the reciprocal. Ratio scale and the use of verbal comparisons are used for weighting of quantifiable and
non-quantifiable elements. AHP proposed as a decision aid to help solve unstructured
problems in economics, social and management sciences [11]. AHP has been applied in
a variety of contexts: from the simple everyday problem of selecting a school to the
complex problems of designing alternative future outcomes of a developing country,
15 The AHP enables the decision-makers to structure a complex problem in the
form of a simple hierarchy and to evaluate a large number of quantitative and qualitative
factors in a systematic manner under multiple criteria environment in confliction [15].
3.5 Application of AHP Method
The application of the AHP to the complex problem usually involves four major
steps. The major steps as shown in Figure 3.2:-
16
Step 1: Break down the complex problem into a number of small constituent elements
and then structure the elements in a hierarchical form.
Step 2: Make a series of pair wise comparisons among the elements according to a ratio
scale.
Step 3: Use the eigenvalue method to estimate the relative weights of the elements.
Step 4: Aggregate these relative weights and synthesize them for the final measurement
of given decision alternatives.
3.5.1 Built up Hierarchy
The AHP is a powerful and flexible multi-criteria decision-making tool for
dealing with complex problems where both qualitative and quantitative aspects need to
be considered. The AHP helps analysts to organize the critical aspects of a problem into
a hierarchy rather like a family tree as shown in Figure 3.3 :-
17 The essence of the process is decomposition of a complex problem into a
hierarchy with goal (criterion) at the top of the hierarchy, criteria and sub-criteria at
levels and sub-levels of the hierarchy, and decision alternatives at the bottom of the
hierarchy.
3.5.2 Pairwise Comparisons
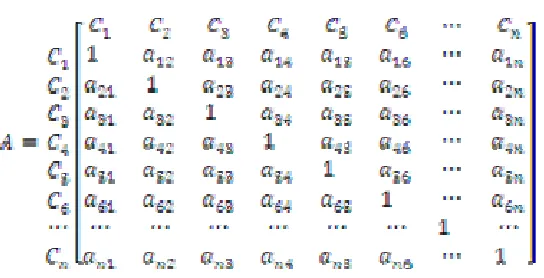
To elicit pairwise comparisons performed at a given level, a matrix A is created in turn by putting the result of pairwise comparison of element I with element j into the position aji as Figure 3.4 :-
[image:27.612.195.467.395.534.2]
Figure 3.4: Pairwise Comparisons Matrix
Where:-
n = criteria number to be evaluated Ci = i. criteria,
18 3.5.3 Eigenvalue Method
The elements at given hierarchy levels are compared in pairs to assess their
relative preference with respect to each of the elements at the next higher level. The
method computes and aggregates their eigenvectors until the composite final vector of
weight coefficients for alternatives is obtained. The entries of final weight coefficients
vector reflect the relative importance (value) of each alternative with respect to the goal
stated at the top of the hierarchy. A decision maker may use this vector according to his
particular needs and interests.
3.5.4 Aggregate Weight
After obtaining the weight vector, it is then multiplied with the weight coefficient
of the element at a higher level that was used as criterion for pairwise comparisons. The
procedure is repeated upward for each level, until the top of the hierarchy is reached.
The overall weight coefficient, with respect to the goal for each decision alternative is
then obtained. The alternative with the highest weight coefficient value should be taken
19 3.6 Fuzzy AHP Method
There is an extensive literature that addresses the situation where the comparison ratios are imprecise judgments. In most of the real-world problems, some of the decision data can be precisely assessed while others cannot. Humans are unsuccessful in making quantitative predictions, whereas they are comparatively efficient in qualitative forecasting. Essentially, the uncertainty in the preference judgments gives rise to uncertainty in the ranking of alternatives as well as difficulty in determining consistency of preferences. These applications are performed with many different perspectives and proposed methods for fuzzy AHP [17].
The fuzzy AHP technique can be viewed as an advanced analytical method developed from the traditional AHP. Despite the convenience of AHP in handling both quantitative and qualitative criteria of multi-criteria decision making problems based on decision makers’ judgments, fuzziness and vagueness existing in many decision-making problems may contribute to the imprecise judgments of decision makers in conventional AHP approaches.
So, many researchers who have studied the fuzzy AHP which is the extension of Saaty’s theory, have provided evidence that fuzzy AHP shows relatively more sufficient description of these kind of decision making processes compared to the traditional AHP methods.
20 mainly used in nearly crisp (non-fuzzy) decision applications and creates and deals with a very unbalanced scale of judgment.
Therefore, the AHP method does not take into account the uncertainty associated with the mapping. The AHP’s subjective judgment, selection and preference of decision-makers have great influence on the success of the method. The conventional AHP still cannot reflect the human thinking style. Avoiding these risks on performance, the fuzzy AHP, a fuzzy extension of AHP, was developed to solve the hierarchical fuzzy problems [18].
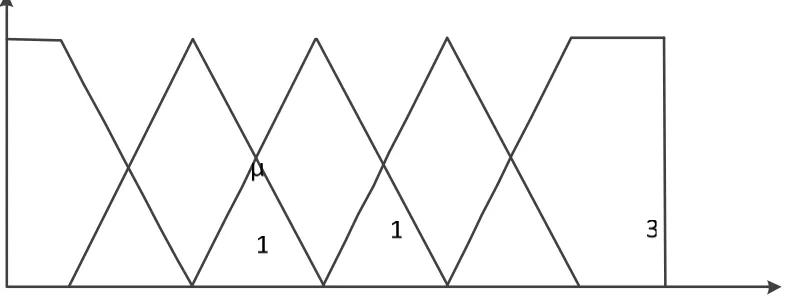
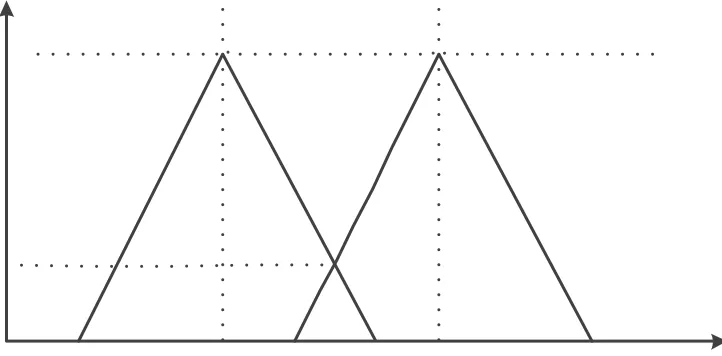
The analysis on fuzzy AHP depends on the degree of possibilities of each criterion. According to the responses on the question form, the corresponding triangular fuzzy values for the linguistic variables are placed and for a particular level on the hierarchy the pairwise comparison matrix is constructed. Sub totals are calculated for each row of the matrix and new (l, m, u) set is obtained, then in order to find the overall triangular fuzzy values for each criterion, li/Σli, mi/Σmi, ui/Σui, (i=1,2,..., n) values are found and used as the latest Mi(li, mi, ui) set for criterion Mi in the rest of the process. In the next step, membership functions are constructed for the each criterion and intersections are determined by comparing each triangular fuzzy number.
21
Figure 3.5: Fuzzy Logic Approach
3.7 Application of Fuzzy AHP Method
To apply the process depending on this hierarchy, each criterion is taken and extent analysis for each criterion, gi; is performed on, respectively. Therefore, m extent analysis values for each criterion can be obtained by using following notation:-
22
Figure 3.6: Step of Fuzzy AHP Method
Step 1: The fuzzy synthetic extent value (Si) with respect to the ith criterion is defined as
equation 1 .
(1) To obtain equation 2:
23 Perform the “fuzzy addition operation” of m extent analysis values for a particular matrix given in equation 3, at the end step of calculation, new (l, m, u) set is obtained and used for the next:-
(3)
Where l is the lower limit value, m is the most promising value and u is the upper limit value and to obtain equation 4:-
(4)
Perform the “fuzzy addition operation” of values give as equation 5:-
(5)
and then compute the inverse of the vector in the equation 5 and equation 6 is then obtain such that
24
Step 2: The degree of possibility of
as defined equation 7:
(7)
And x and y are the values on the axis of membership function of each criterion. This expression can be equivalently written as given equation 8:-
(8)
[image:34.612.159.520.452.630.2]Where d is the highest intersection point and in Figure 3.7:-
Figure 3.7: The Intersection Between and
67
REFERENCES
[1] A. Chaly, K. Gutnik, A. Testoedov, A. Astrakhantsev (2004). “Autocoordination Of Protection Settings Of Series Reclosers”. Tavrida Electric, Moscow, Russia, Marshala.
[2] NPCC (1998).”Guide for the Application of Autoreclosing to the Bulk Power System”. NPPC.
[3] Ackerman T, Anderson G and Selder L , (2001).”Distributed Generation “. Electrical Power System Research.
[4] János Fülöp (2006).”Introduction to Decision Making Methods” Laboratory of Operations Research and Decision Systems,Computer and Automation
Institute, Hungarian Academy of Sciences.
[5] D.A. Fischer and S.A. Seeker. (2000). "Automatic Circuit Reclosers Characteristics and Application Factors on Application and Coordination of Reclosers, Sectjonalises, and Fuses”
68 [7] A.Pregelj, M.Begovic, A.Rohatgi (2002). “On Optimization of Reliability of Distribution Generation-Enhance Feeder”. School of Electrical and
Computer Engineering Georgia. Institude of Technology Atlanta.
[8] S.Jamali, H.Shateri (2005). “Optimal Application of Recloser and Sectionalizer to Reduce Non-Distributed Energy in Distribution Network”. University Science and Technology. Iran.
[9] Lingfeng Wang, Chanan Singh (2006). “Reliability-Constrained Optimum Recloser Placement in Distribution Generation Using Ant Colony System Algorithm”. Department of Electrical and Computer Engineering. Texas.
[10] SA.Pregelj, M.Begovic, A.Rohatgi (2006). “Recloser Allocation for Improved Reliability of DG-Enhance Distribution Network”. School of Electrical and Computer Engineering Georgia. Institude of Technology Atlanta
[11] Amir Hisham Hashim, Abdul Malik Mohamad, Izham Zainal Abidin, Mohd. Zafri Baharuddin, Eng Chin Yeoh (2006).“Determination of Auto- Recloser Location Using Cost Analysis in the Sabah Electricity Distribution Network”.TNB Research.
[12] Zhang Li, Xu Yuquin, Wang Zengping (2008). “Research on Optimization of Recloser Placement of DG-enhance Distribution Networks”. Hebei Industri University.
[13] A.R. Karim, N. Mehrdadi, S.J Hashemian, Gh.R. Nabi Bidhendi, R. Tavakkoli- Moghaddam (2011) "Using of The Fuzzy Topsis and Fuzzy AHP Methods
For Wastewater Treatment Process Selection” University of Tehran.
69 [15] Saroj Koul (2010) "Dynamic Vendor Selection: A Fuzzy AHP Approach ”.
School of Business. Acadia University. Canada.
[16] Debmallya Chatterjee, Dr. Bani Mukherjee (2010). "Study of Fuzzy AHP Model to Search The Best Technical Institude”. International Journal of Engineering Science and Technology. ISM Dhanbad. Jharkhand, India.
[17] R. Aghataher, M.R Delavar, M.H. Nami and N. Samnay (2008). "A Fuzzy AHP Decision Support System for Evaluation of Cities Vulnerability Againt Earthquakes”. University of Tehran, Iran.
[18] Omid Khorasani, Morteza Khakzar Bafruei (2011). "A Fuzzy AHP Approach for Evaluating and Selecting Supplier in Pharmaceutical Industry”.
Department of Industrial Engineering. Payam, Noor University.
[19] S. Mahmoodzadeh, J. Shahrabi, M. Pariazar and M.S. Zaeri (2010). "Project Selection by Using Fuzzy AHP and TOPSIS Technique”. Economic Department. University of Tehran, Iran.