STUDY ON ROUGHNESS COEFFICIENT AT NATURAL
CHANNEL
ZARINA MD. ALI1, NUR HUSNA ABDUL KARIM2, MOHD ADIB MOHAMAD RAZI3 1,2,3
Faculty of Civil and Environmental Engineering Department of Water and Environmental Engineering
Universiti Tun Hussein Onn Malaysia 86400 Parit Raja, Batu Pahat, Johor, Malaysia E-mail: [email protected]; [email protected]; 3
ABSTRACT
Roughness coefficient for open channel has been study widely to alleviate engineers to manage flood problem or to design the hydraulic structures. Dissimilarity of n values occurs especially at two or more different locations due to channel properties, geometry and other factors. The study was carried out Parit Karjo channel to determine a range of value for roughness coefficient and its relationship with flow rate. In-situ measurement was carried out at 10 stations along Parit Karjo channel in order to determine velocity of flow. The result shows the range of roughness coefficient, n is ranged from 0.04 to 0.48. As conclusion, the states of flow for Parit Karjo channel are located between transitions to turbulent flow region.
Keywords: Parit Karjo river; Roughness coefficient
INTRODUCTION
In hydraulic engineering, the friction coefficient is a crucial parameter in designing water structures, calculation of velocity distribution and energy losses determination [1]. Besides that, flow profile calculation, velocity and discharge plays significant roles in water resources project, flood management planning and the determination of hydraulics effects for river conservation. In several cases, a sufficient variety of channel roughness coefficient is needed in these calculations [2]. There several formula are used to determine the roughness coefficient, n for open channels such as Manning formula The n values are used to measure surface roughness and flow resistance even though small errors of this value can effected to the calculations [3]. The coefficient is not easy to determine and is varying constantly. Due to related parameters, the roughness of the channel is not equally distributed over the channel, the banks and the floodplains [4].
Referring to Fu-Sheng [5], the flow resistance in open channels with non-submerged rigid vegetation is related with hydraulic characteristics where vegetation will cause flow resistance, rise of water level and reduction of discharge capacity. Due to that, the n values cannot be computed equally for all types of open channel because the value must be referred factors that influenced the coefficient of roughness both artificial and natural channel such as surface roughness, vegetation, sedimentation and at cetera [3][4]. The roughness coefficient values provided in reference books or previous research normally based on study of selected rivers or ditches in a foreign country. In addition, high technology also caused westerners capable of developing database as ways to ease the determination of n values.
calculation, to increase the usage of engineering structures, to improve design works of water storage and to control flood. These advantages were used to solve hydraulic problems easily.
MATERIALS AND METHODS
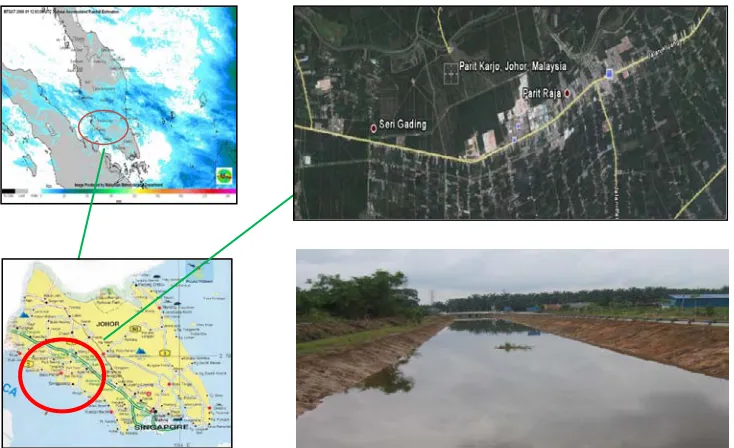
Case Study. The study was located at Parit Karjo river in Batu Pahat district (latitude: 1° 52' 0" N, 103° 4' 0" E and longitude: 103° 11' 28.4" T, 103° 16' 40.7") as shown in Figure 1.
Data Collection. Data was measured at 10 selected locations along the Karjo channel by in-situ measurement within two months (December 2009 – January 2010). The distance between the stations is about 500 to 1900 meters. In-situ measurement: This work was carried out to measure channel characteristics such as channel cross-section, velocity and depth of water for 5 times. Beside that, width and distance between cross section also have been determined. Velocity: The velocity was measured at 0.2 and 0.8 of water depth since the depth of water is between 0.5 m to 1.0 m. Current meter (Valeport BFM001) was used as a tool in measuring the velocity. Therefore, flowrate of river can be calculated by mean-section method.
Manning Formula. Manning's equation was used to calculate cross-sectional average velocity flow. In applying the Manning Formula, the greatest difficulty lies in the determination of roughness coefficient, n for there is no exact method of selecting the n value. The equation of Manning formula is stated at equation (1) [6].
2 / 1 3 / 2
1
o
S AR n AV
Q= = (1)
where:
Q = volume flow (m3/s)
v = cross-sectional average velocity (m/s) A= cross sectional area of flow (m2) n = Manning coefficient of roughness R = hydraulic radius (m)
S = slope of bed channel (m/m)
The dimensions of open channel change relatively due to several factors such as channel roughness, erosion and others. This situation leads to changes of depth of flow and gives effects to parameter that contribute in calculating Manning Formula.
State of Flow. The friction factor of an open channel flow is generally affected by the Reynolds number and the roughness conditions, and can be decided by laboratory or field measurements [7]. Depending on the effect of viscosity relative to inertia, the flow may be laminar, turbulent or transitional. The flow is laminar if the viscous forces are strongly relative to the inertial forces that mean viscosity plays a significant part in determining flow behaviour [4]. If the viscous forces are weak relative to inertial forces, the flow is turbulent where the water particles move in irregular paths which are neither smooth nor fixed. While, transitional flow located between laminar and turbulent. The effect of viscosity relative to inertia can be represented by the Reynolds number, defined as shown in equation (2).
where,
L = Characteristic length (m)
V = Velocity (m/s)
[image:3.612.123.490.150.374.2]ν = Kinematics viscosity of water (m2/s)
Figure 1: Location of Study Area
RESULTS AND DISCUSSION
The characteristics of channel have been collected in order to determine the flow rate and n value. The value of bottom slope was determined as 0.0005. Figure 2 (a) shows the value of hydraulic radius, R is ranging from 0.14 to 0.59m. While values of wetted parameter, P and area, A in Figure 2 (b) both show a similar pattern which is ranging from 20.93 to 61.21m and 5.05 to 35.28m2 accordingly. The average value for hydraulic radius, area and wetted parameter are 0.38m, 17.6m2
0 1
1 31
Number of sampling
H
yd
rau
lic R
ad
iu
s,
R
(
m
)
and 45.43m. From this graph, the values of geometry elements are slightly vary according to date of sampling.
0 30 60 90
1 31
Number of sampling
A
rea,
A
(
m
2)
an
d
W
et
ted
Pe
ri
m
e
te
r,
P (m
)
A (m 2)
P (m )
(a) Data of Hydraulic Radius (b) Data of channel Area and Wetted
Parameter
Figure 2: Data of Geometry Elements
S1 S2
S3
S4
S5
S6 S7 S8
S9
[image:3.612.79.469.548.663.2]Velocity, V of water was calculated based on geometry element findings in Figure 2. 10% of velocity data are located at ranged of 1.5 to 3m/s but in overall the data is ranging between 0.28 to 1.5m/s as shown in Figure3. In addition, the average value of velocity is 0.71m/s.
0 1.5 3
1 30
No of sampling
V
el
o
ci
ty (
m
[image:4.612.186.424.134.270.2]/s)
Figure 3: The Data of Velocity
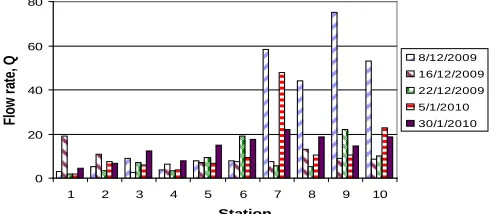
Figure 4 shows values of flow rate at station 1 to station 6 are not reached 20m3/s. Furthermore, the values at station 7 to station 10 ranged from 45 to 75m3/s on 8 December 2009. This is because of the tides effect during the measurement. Overall, the values are ranging from 1.81 to 75.21m3/s.
According to Figure 5, the distribution of roughness coefficient, n is ranging from 0.04 to 0.48 based on number of sampling. According to Chow [4], the suitable range of n for this channel is between 0.025 to 0.033 for clean open channel, straight and no rifts. Compared to previous reference or study, the ranged of data obtained is lesser than Adib et al [8] but slightly bigger than Chow [4].
0 20 40 60 80
1 2 3 4 5 6 7 8 9 10
Station
Flow
r
at
e, Q
8/12/2009 16/12/2009 22/12/2009 5/1/2010 30/1/2010
[image:4.612.183.431.447.554.2]0.00 0.10 0.20 0.30 0.40 0.50
0 25 50
Number of Sampling
roughne
s
s
c
oe
ff
ic
ie
nt
, n
Figure 5: The Distribution of Roughness Coefficient
0.00 0.06 0.12 0.18 0.24 0.30 0.36 0.42 0.48 0.54
0 20 40 60 80
Flow rate (m3/s)
ro
u
g
h
n
e
s
s
c
o
e
ff
ic
ie
n
t,
[image:5.612.185.429.88.213.2]n
Figure 6: Relationship between Roughness Coefficients and Flow Rate
The relationship between roughness coefficients, n and flow rate, Q is shown in Figure 6. The data are scattered mostly when flow rate is lesser than 24 m3/s. Overall, the data ranging from 1.81 to 75.21 m3/s. The Q minimum is figured as 1.98 m3/s at n = 0.48 (maximum) while Q maximum is 75.21 m3/s at n = 0.05 (minimum). Furthermore, the n values are proportionally inversed to Q values.
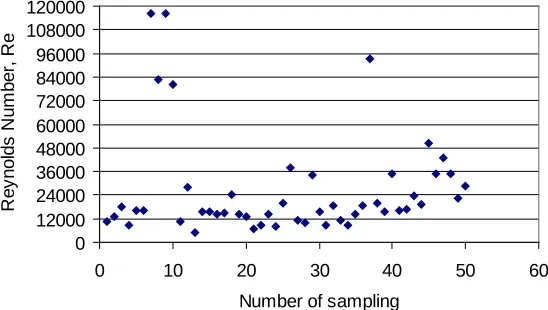
0 12000 24000 36000 48000 60000 72000 84000 96000 108000 120000
0 10 20 30 40 50 60
Number of sampling
R
ey
nol
ds
N
um
ber
, R
[image:5.612.168.442.518.673.2]e
Based on Figure 7, the states of flow for Parit Karjo channel was calculated by Reynolds Number where kinematics viscosity, ν is 1.08 x 10⁻⁵
m2/s. About 15% of data findings located at transitions region; overall the data are situated at transitions and turbulent region.
CONCLUSIONS
As conclusion, the range of roughness coefficient, n isfrom 0.04 to 0.48. Besides that, the n values were founded proportionally inversed to Q values. The states of flow for Parit Karjo channel are located between transitions to turbulent flow region.
ACKNOWLEDGEMENTS
The author would like to thank the Ministry of Higher Education Malaysia (FRGS 1/2008, Vot 0561) and University Tun Hussein Onn Malaysia for sponsoring this study.
REFERENCES
[1] Bilgil, A. and Altun, H. (2008) Investigation of flow resistance in smooth open channels using artificial neural networks. Flow Measurement and Instrumentation 19, Elsevier, pp 404-408
[2] Robertson, B.A., Cassidy, J.J. and Rutherfurd, I. (2000). Towards An Australian Handbook of Stream Roughness Coefficient. Journal of Hydraulic Engineering.
[3] Jarret, R.D. (1985). Determination of Roughness Coefficients for Streams in Colorado.
USGS Water Resources Investigation Report.
[4] Chow, V.T. (1973). Open-channel Hydraulics. Singapore. McGraw-Hill Book Co.
[5] Fu-sheng, W. (2008) Characteristics of Flow Resistance In Open Channels With Non-Submerged Rigid Vegetation. Journal of Hydrodynamics, 20 (2) pp 239-245
[6] Amat Sairin Demun (1997). Hidraulik Saluran Terbuka dengan Penggunaan Komputer. Universiti Teknologi Malaysia: Penerbit UTM.
[7] Yuhong, Z. and Wenxin, H. (2009). Application Of Artificial Neural Network To Predict The Friction Factor Of Open Channel Flow. Commun Nonlinear Sci Numer Simulat 14, Elsevier, pp 2373–2378