Determination of Veld Fire Hazard Zones in
Multiple Tenure Systems in Zimbabwe:
Implications for Intervention
Robert Maponga1,2,*, Fethi Ahmed3, Desmond Manatsa2
1Department of Geography, Environmental Management and Energy Studies, University of Johannesburg, South Africa 2Department of Geography, Bindura University of Science Education, Zimbabwe
3School of Geography, Archaeology and Environmental Studies, University of Wits, South Africa
Copyright©2017 by authors, all rights reserved. Authors agree that this article remains permanently open access under the terms of the Creative Commons Attribution License 4.0 International License
Abstract
The study determined fire hazard zones inmultiple tenure systems from 2001 to 2013 in Mazowe district, Zimbabwe, using Landsat 7 and 8 30m resolution images, a fire hazard model and weighted sum of burnt area. The model divided the district into high, moderate and low fire hazard zones across five tenure systems that obtain. Most of the district (50%) was in the high hazard zone. Fire events superimposed onto the zones confirmed that most of the fire events (60%) occurred in the high hazard zone. The weighted sum of burnt area revealed that 47% of the study area was not burnt. The level of fire risk in terms of pasture per livestock unit was substantially high. At 1% of land burnt four times in A2 and Communal systems involved losses of 2784 and 1682 livestock units’ worth of pasture respectively. The hazard zones show hotspots needing monitoring, fire problem occurring irrespective of tenure and that the problem could be addressed. The study recommends setting up a fire command centre, involving all parties, urgent attention to the fire problem across tenure and adoption practices such as law enforcement, hierarchical structures and participation of grassroots communities in addressing the fire problem.
Keywords
Fire Hazard, Fire Hazard Zone, Fire Event,Weighted Sum of Burnt Area, Pasture per Livestock Unit
1. Introduction
The outbreak of wildfires varies from one place to another and impacts on property, human life, livestock, wildlife resources, ecological processes, life support systems and livelihoods differently from one zone to another [1–3]. Equally, there are variations in the level of risk from control
and spread of wildfires in space and time (4). In the absence of quantitative hazard zones, the management of wildfires remains a major challenge among local and government authorities (5). The study focuses on delineation of fire hazard zones in Mazowe district, Zimbabwe, where there are five tenure systems that fall within the same climatic zone but under different land or resource management systems [6,7]. The tenure systems (A1, A2, Communal, Private and Institutions) emerged from the fast track land reform programme (FTLRP) that took place from 2000 to 2002 (8). The mosaic distribution of tenure systems (6) and the prevailing conditions are believed to promote runaway fires that continue to pose threats to the local environment on an annual basis [7,9,10]. The fires tend to ignore boundaries (firebreak, tenure, farm or national), leap forward and ignite fuels far ahead [7,11]. For instance, (12) confirm that fires that affected Gonarezhou National Park, Zimbabwe, spread from adjacent and or distant communal areas. The use of fire has become a threat as it causes suffering instead of offering benefits to vulnerable local communities (13). The determination of fire hazard zones is necessary to enable planners and resource managers know where, what impacts, how much is required and when to invest in fire control and management [5,14,15].
[20–22]. Although climatic conditions are generally uniform in the district (7), terrain conditions, human activities and the capacity to tackle the fires differ from one part of the district or tenure system to another. This study traces fire hazard zones in the district, as from 2001 to 2013 then determine fire hazard zones across land tenure systems for strategic planning and solutions across the fire management spectrum [4,5].
A fire hazard offers conditions that would possibly cause harm culminating into a fire risk [23,24]. The fire risk has a dual dimension of danger and vulnerability: one refers to the potential to occur and spread while the other refers to harm on life, property and environmental resources (26). Wildfires have become a major hazard as they evade suppression or control [26,27]. For instance the Environmental Management Agency (EMA) reports that a wildfire killed a mother and her three daughters in one event in 2010 in the study area (29). Although reports show that the number of fires in Zimbabwe as a whole declined from 9631 in 2010 to 2464 in 2015, the area burnt rose from 1 152 413 ha to 1 510 343ha in 2015 and 13 human lives were lost in every fire season (10). The study sought to detect fire hotspots from 2001, a year after the FTLRP was introduced, to 2013, in order to inform policy and fire management authorities, however, as also found in Bontebok park South Africa, the records were usually unreliable as they were missing or incomplete (30). It became necessary to use remote sensing imagery that could collect data beyond accessibility, tenure and record barriers to motivate strategies that avert subsequent hazard events [28,29].
In Zimbabwe, (9) contends that wildfires reached alarming proportions as stakeholders and government faced challenges in trying to contain them. Mazowe district, has had the highest number of reported cases of wildfires in the province over the years and was regarded as falling within extreme wildfire hazard (10) yet it has the highest agricultural yield (7). The EMA responded to the runaway veld fire problem by introducing intervention measures such as firebreaks, fire awareness campaigns, reduction of fuel load by hay bailing, fines and institutional structures among others in 2009 [10,18] but the fire problem persisted as evidenced by an increase in burnt area, continued outbreaks and direct loss of human lives from fire events. Farmers in the study area, regardless of tenure, are highly vulnerable to frequent fires [10,32] as most of them lack the capacity to contend with the damage inflicted to their high valued environmental resources and assets [12,13,32]. The situation is compounded by the interwoven nature of tenure systems as a fire from one system is capable of moving across several systems and lack of scientifically demarcated hazard zones for target effort to contain the fires. The study used a fire risk model (25) to determine hazard zones in the multiple tenure district as a primary step offering opportunities for policy formulation or review of an integrated approach to the veld fire problem stemming from within and across tenure boundaries.
The study uses Remote Sensing (RS) data processed in appropriate computer RS and Geographical Information Systems (GIS) software to delineate the fire hazard zones and map them [33,34] without any restrictions posed by inaccessibility, incomplete records or lack of historical data. The use of RS and GIS techniques has been done to identify hazards in Spain (36), risk at Canary (37), in forested and grasslands in Iran (25) and forest fire hazard mapping in Honduras (34). The study was based on Landsat data, available since 1972, and GIS to detect fire hazard zones and mapping burnt areas [35–37]. The readily available large spatial resolution (30m) Landsat 7 images and GIS techniques were employed to delineate the hazard zones within multiple tenure systems then validated them with fire events that broke out in the study area.
The main objective of the study was to determine fire hazard zones in one of the most fire prone districts in Zimbabwe by ‘integrating various layers of data’ in GIS (34). The study adopted the fire risk model (FH) (34) also employed by (25) as a Hybrid Fire Index model (HFI). The objectives of the study were to:
• Determine and map the fire hazard zones in multiple tenure systems in Mazowe district, Zimbabwe.
• Apply a fire hazard model in delineating fire hazard zones in Mazowe district.
• Suggest recommendations for prevention and control of veld fires in Zimbabwe and elsewhere.
The study sought for opportunities for stakeholders across sector and tenure divides to come together in an effort to reduce the level of or eliminate fire hazards.
2. Materials and Methods
The study used Landsat 7/8 images, digital elevation model (DEM) downloaded from United States Geological Survey (USGS), fire data from Earth Data on Fire Information for Resource Management Systems (FIRMS) platform, land cover maps of Mazowe, shapefiles of Mazowe District and land tenure boundaries, ground coordinates for land cover during the dry season for vegetation dryness and burnt area, image processing and GIS software.
2.1. Study Area
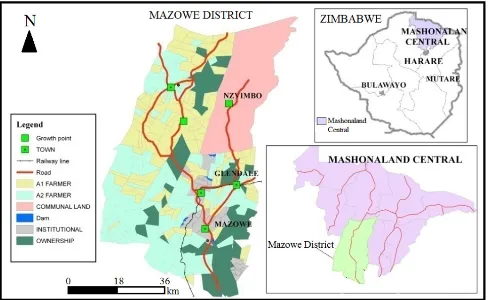
The study focused on Mazowe district, regarded as having had the largest number of fires in the province since 2010 [10,32]. It is located to the south western part of Mashonaland Central province of Zimbabwe, Figure 1, between latitudes 16°47’2’’ - 17°44’28’’S and longitudes 30°36’18’’ - 31°17’32’’E.
seasonal growth and accumulation of fuel (43) for seasonal fires and ultimately pose seasonal fire risk. The minimum and maximum altitudes are 879m and 1747m above sea level respectively. It covers 4354.16km2 in area with a total
population of 233450 and a density of 53.6/km (44). There are five interwoven tenure systems – freehold (private and institutional), communal and resettlement permit tenure, A1 and A2, products of FTLRP (6). The A1 scheme comprises the village type of arrangement, arable land and common pasture while A2 is for smallholder commercial farming. The resettlement schemes were at the centre of controversy in terms of starting the fires (19,45). The study sought to inform planners so as to design strategies necessary to plan for fire risk where hazard zones were identified.
2.2. Research Design
The study adopted a case study approach that covered all the various tenure systems in the study area. Fire hazard zones were mapped, the number of fires quantified and hotspots determined within the varied tenure systems
2.3. Field Data Collection
Fire reports were obtained from EMA; maps on land cover for 2008 from Forestry Commission, farm boundaries and tenure systems from Mashonaland Central Provincial lands office. Fifty ground coordinates for each land use before fire season (May 2013) and for burnt area at the end of fire season (October 2013) were collected using a hand handled GPS along major highways such as Harare - Bindura and Mazowe – Mvurwi highways. The ground points and land cover maps were used to validate the data obtained from satellite imagery.
2.4. Collection of Landsat Data
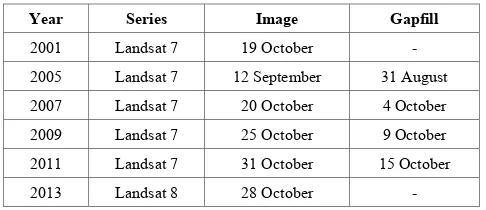
Two series, Landsat 7 from 2001 to 2012 and Landsat 8 30m resolution images for 2013, path/row 170/72, were acquired freely courtesy of the USGS-EROS Centre (www.earthexplorer.usgs.gov). The images were selected for high spatial resolution and higher accuracy in land cover classification (46). The images are listed in Table 1.
2.5. Collection of MODIS Data
[image:3.595.311.554.254.359.2]Higher temporal resolution MODIS, Terra and Aqua systems, offer data on specific dates when fire broke out [46,47]. The Near Real-Time MODIS active fire data were downloaded for free from Earth Data on a Fire Information for Resource Management System (FIRMS) platform for the period 2001 - 2013. The data were downloaded for each year covered in the study. Fires that had 95% chances of having occurred were chosen. Twenty ground samples were collected using a hand held GPS during the last week of October 2013 for fires that occurred along major roads in the study area to validate MODIS data.
Table 1. Landsat path/row 170/72 data utilized in the study
Year Series Image Gapfill
2001 Landsat 7 19 October -
2005 Landsat 7 12 September 31 August
2007 Landsat 7 20 October 4 October
2009 Landsat 7 25 October 9 October
2011 Landsat 7 31 October 15 October
2013 Landsat 8 28 October -
2.6. Image Radiometric and Geometric Correction
Figure 1. Location of Mazowe District
2.7. Image Classification
The images were classified in order to determine land use land cover (LULC) for the hazard zones and to map burnt and non-burnt areas. The digital numbers of Landsat images were converted to reflectance using the Reflectance Tool extension in ArcGIS10.2 and parameters obtained from the metadata files accompanying each dataset. The objective was to classify LULC and burnt and non-burnt areas for each Landsat image used. The supervised classification used relied on ground data for training and verification. Therefore, 50 points per class fairly distributed across the study area were used; 70% for classification and 30% for validation (51). The points were used to create regions of interest in the ENVI version 5.0 software. Regions of interest increase the number of pixels for both classification and accuracy assessment by using polygons created around points obtained from the field and are more accurate than using raw points
Supervised classification using the maximum likelihood option was used since ground truth points were collected to verify the burnt status of the study area (52). Maximum likelihood classifier was chosen as it is one of the most common techniques used in land cover classification and that it produces accurate results as it assumes that the sample points are representative and evenly spread over the study area (53). The accuracy of the classification was assessed in ENVI 5.0 software using a confusion matrix which compares the mapped classes with actual class in the field based on an
independent set of ground data (54).
2.8. Burnt Area Determination
The classified maps showed burnt and non-burnt areas over the entire study area for the period covering fire seasons from 2001 to 2013. The maps were used to generate a time series analysis of fire events. In order to link fire occurrence with tenure systems, tenure data were clipped from the classified study area maps. The extracted maps were used to compute burnt area per season in square kilometres (km2) for
each tenure system based on the coverage of pixels classified as burnt in that system.
2.9. Number of Fires and Date of Fire Events
Fire events were clipped from the FIRMS layers as per Mazowe district shapefile, then for each tenure system in GIS Arc Map 10.1. The number of fires and dates were collected from the attribute table for each clipped layer.
2.10. Vegetation Moisture
(NIR) and 2.10 to 2.30 µm for mid infrared (MIR) where used in formula 1 to determine normalized difference moisture index (NDMI).
(
)
(
)
NIR MIR
NDMI
NIR MIR
−
=
+
(1)2.11. Slope Data
The slope angle was derived from the Digital Elevation Model (DEM) of the area. The 30m DEM was obtained from the USGS earth explorer website. It was then re-sampled (46) to the orientation of Landsat 7 and 8 images. Five classes were developed in the range 1-5 with lower slopes having lower values for hazard delineation as shown in Table 2. The slope per se, does not influence ignition, however it affects the spread of fire through ventilation [52–54] and makes it inaccessible for the implementation of suppression strategies as the slope height increases (59). The premise is based on the observation that an increase in slope height enhances the rate of fire spread and subsequent level of fire risk (60); hence it is one of the key variables in determining fire hazard zones.
2.12. Aspect Data
Aspect was derived from the 30m DEM. Only four classes - north, east, south and west - were generated after reclassifying the variables. The north facing slopes in the southern hemisphere would have more exposure to the sun. The exposed slope produces a higher fuel load, enhances drying of fuels and promotes a higher temperature that influences rapid burning and spread of veld fires (61). Thus the highest risk level was apportioned to north, the least to south while east and west were treated as shown on Table 2.
2.13. Proximity to settlement
Nearness to settlements influences the probability of veld fire ignition [25,58]. A settlement layout map was digitized from the Surveyor General’s maps before being re-sampled to the 30m resolution Landsat 7 and 8 images. Thereafter the distance buffers from settlements, as shown on Table 2 and Figure 2e, were done in Arc Map 10.1.
2.14. Proximity to Roads
The road network was also digitized from the Surveyor General of Zimbabwe maps, re-sampled and buffered as shown in Figure 2. Motorists or any other road users usually
throw lit cigarette stubs on roadsides that ignite fuels nearby. A buffer distance of 100m per strip was adopted from literature [24,58].
2.15. Elevation
The elevation values were derived from a 30m DEM of the study area. Five classes were developed for weighting (25), Table 2. Veld fires spread freely at higher altitudes, flow more rapidly upslope (35) as influenced by uphill flow of winds. The fires that reach higher altitudes are a major hazard; they are not easily controllable or put out from below because of difficulty in accessibility. The Iron Mask to the southeastern and the Great Dyke to the north western are some of the uplands.
2.16. The Fire Hazard Model
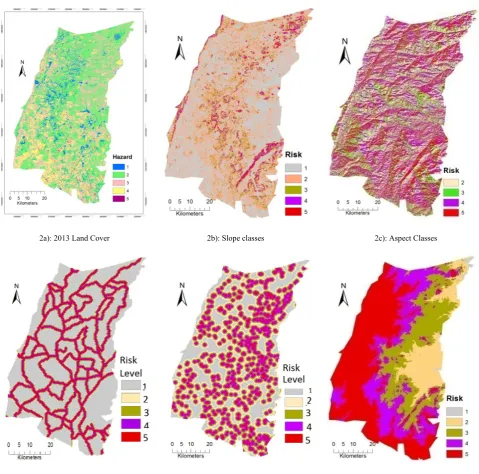
The study integrates the six layers Table 2, Figure 2a-f (25) and also applied by (34) except for NDMI which was replaced by land cover. The variables, Table 2, were apportioned some weights, then computed in ArcMap using the raster calculator to generate an output layer that revealed the fire hazard levels in the study area
The weightings were used to generate layers as shown in Figure 2a-f. The individual layers formed the basis upon which the composite hazard map was generated as the layers were factored into the model.
The hybrid fire index (HFI) adopted from (25) for this study is outlined as:
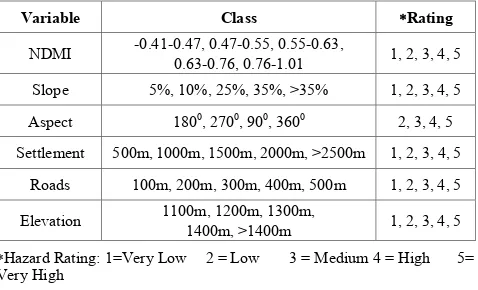
[image:5.595.313.552.477.622.2]HFI = (100v+50s+25a+10×(r+c)+5e)/10 (2) Table 2. Weights of variables and classes for veld fire hazard modelling
Variable Class ∗Rating
NDMI -0.41-0.47, 0.47-0.55, 0.55-0.63, 0.63-0.76, 0.76-1.01 1, 2, 3, 4, 5
Slope 5%, 10%, 25%, 35%, >35% 1, 2, 3, 4, 5
Aspect 1800, 2700, 900, 3600 2, 3, 4, 5
Settlement 500m, 1000m, 1500m, 2000m, >2500m 1, 2, 3, 4, 5 Roads 100m, 200m, 300m, 400m, 500m 1, 2, 3, 4, 5
Elevation 1100m, 1200m, 1300m, 1400m, >1400m 1, 2, 3, 4, 5
∗Hazard Rating: 1=Very Low 2 = Low 3 = Medium 4 = High 5= Very High
2a): 2013 Land Cover 2b): Slope classes 2c): Aspect Classes
[image:6.595.66.546.77.551.2]2d): Distance from road 2e) Settlement classes 2f): Elevation classes
Figure 2. The map layers used in the model
2.17. The Fire Hazard Zones
The output values were normalized to 255 so that that the lowest risk value is 0 and the highest is 255. The risk levels were thus classified on the basis of probability distribution of the normalised values. The output map had to be reclassified using the probability of distribution scale 0-10% as low; 10 – 50% as moderate and 50 – 100% as high risk (25). The hazard values were computed using the 2013 image taking advantage of data points collected from the field and some reference maps such as the 2008 Forestry Commission land cover map. The hazard levels defined the zones prone to fire propagation and spread in the district.
2.18. The Fire Hazard Zones and Fire Events
Fire events were attached to the attribute table of the hazard layer in ArcMap. The extract multi values to points spatial analyst tool was used to extract and show the fire events that occurred in the hazard zones. The tenure systems were then clipped from the main hazard map to show distribution of hazard and frequency of fires per tenure.
3. Results and Discussion
the number of times the study area was burnt and the implications of the hazard zones on tackling the fire problem in Mazowe and Zimbabwe as a whole.
3.1. Image Accuracy Assessment
[image:7.595.57.299.238.373.2]The accuracy results for the images used in the study are shown in Table 3. The assessment produced very high accuracies for all the classification done in this study. The assessment was done to reconcile the classes that were generated with an independent set of sample points from the study field [50,52,53].
Table 3. Accuracy assessment for images used in the study
Year Accuracy Kappa Accuracy (%) Kappa
LULC LULC Burnt Burnt
2001 - - 98 0.96
2005 - - 99 0.99
2007 - - 89 0.78
2009 - - 96 0.92
2011 - - 99 0.99
2013 88 0.84 94 0.83
The assessment results at 82 – 98% overall accuracy and above 0.78 for all the classifications done, confirm a high agreement (62) for all the classes of images used and the independent validation sample. The overall accuracies exceeded the recommended threshold of 80% [51,62], thus images derived from processing could be used showing a true picture of the ground conditions
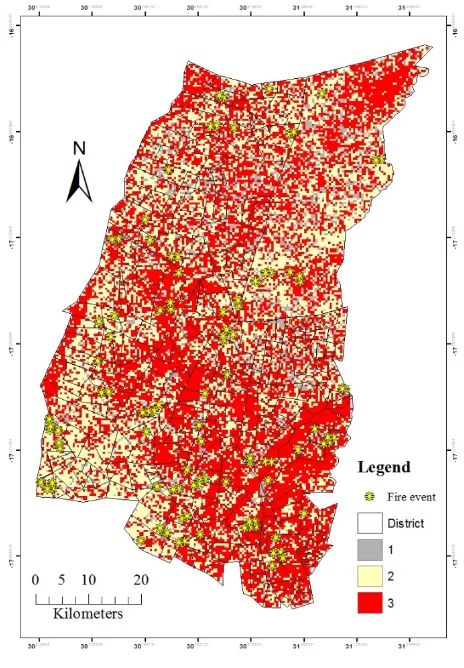
3.2. Distribution of Veld Fire Hazard Zones
The model reveals a distribution of hazard levels (Figure 3). Generally the hazard zones are fairly distributed across tenure systems. The normalized distribution of hazard zones reveals that areas of high altitude had higher hazard while those of low elevation had low hazard (64). Notably, high altitude places such as Iron Mask Range to the south eastern part, the Great Dyke to the west and many others within the district were demarcated as zones of high fire hazard.
When the fire reaches the slopes it becomes uncontrollable, engulfs flammable fuel, destroys vegetation and weakens soil productive capacity in the affected zones (65).
However, except when the fire is caused by lightning, ignition is rare on the uplands thus effective control of the fires is highly probable on if downslope anthropogenic causes of ignition could be controlled. The level of hazard in the uplands in terms of actual burning could thus decline significantly. The other high hazard areas on the gentle terrain, in the interior of the district, are a result of nearness to settlements and roads where ignition could readily occur [58, 54]. Open grasslands where seasonal grass grows coupled with idle agricultural lands offer more opportunities for increased fire (7). There are low hazard zones on rivers,
other wetlands and patches of vegetation that have high moisture content during the fire season.
[image:7.595.316.548.260.594.2]The distribution of the hazard zones is shown in Table 3. The demarcations show that the high hazard zone has the largest while the moderate and low have lower proportions at tenure system levels. The model shows that the low hazard level has the lowest proportion across tenure systems with a mean value of 9.4%. Most of the values are below 10% except for communal that had 15% in this category, an indication that veld fires have a higher potential to occur in the district. The moderate level occupies the middle position (mean of 35.6%). The proportion is fairly large as the occurrence of fires could spread and cause harm to the environment.
Figure 3. Fire hazard zones in Mazowe district
Table 4. Distribution of hazard zones
Tenure
Area (km2) Low (%) Moderate (%) High (%)
A2 1392 8 44 48
A1 1193 8 39 53
Communal 841 15 39 46
Private 676 8 30 62
[image:7.595.312.553.627.753.2]The high hazard category has the highest values in all tenure systems (mean 55%). The results confirm the general trends that obtained when the model was applied [24,36], except (34) who found the results skewed towards the low hazard values. Three of the systems A1, Private and Institutions had over 50%, the highest occurred in Institutions tenure that had 66% of its total area in this category. It reveals that about half of the land area in the district is in the high hazard category thus liable to ignition leading to subsequent spread of veld fires. The tenure systems have hazard values skewed to high hazard category. The model portrays predominantly a moderate to high fire hazard district, a situation that needs to be confirmed by fire events. The generally moderate to high proportion of hazard calls for farmers and authorities to be cautious and alert so as to prevent and battle with fires whenever they occur.
The high hazard zones are on high land, near settlements, near roads and have grass as the dominant vegetation (61). The prevailing wind, high temperature and low relative humidity conditions, characteristic of the fire season in the region (66), would further compound the ignition of the runaway fires. The fire in high hazard zones has the potential to cross barriers such as roads, rivers or narrow windbreaks where firebrands develop (11). The fire brands would start up a new fire ahead of the approaching fire thereby perpetuating the spread of the fire and associated risks if appropriate measures are not put in place. When the fuels are ignited, they have the potential to spread, damage pasture and ecological processes on uplands and ecosystems, pasture, cropping and properties on the lowlands. Nonetheless, the fire situation can be ably explained by fire events and resultant burnt area in the study area.
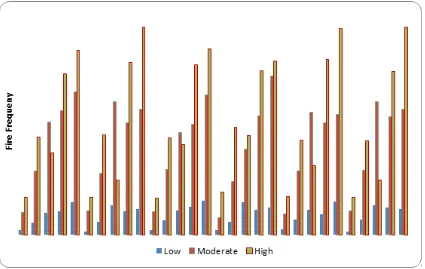
3.3. Wild fire Zones and Fire Frequency
[image:8.595.95.520.471.740.2]The spread of fire events in the hazard zones is shown on Figure 4.
The results show that the largest number of fires occurred in the high hazard zone while the least occurred in low hazard in Institutions, Private, A1 and A2. The four could be described as systems in high fire hazard category. In Communal tenure, the largest number of fires occurred in the moderate category except for year 2009. The tenure negates the general norm of the model as it can be described as a moderate fire hazard tenure system. The trends further show that the least number of fires occurred in Institutions (0 low, 2 moderate and 3 high in 2001) and the highest in A2 (3, 11 and 18 in 2011). Except Communal tenure, the results confirm findings by [24, 54] which show most of the fires as occurring in the high hazard category.
The results show that in tenure systems where the highest number of fire events occurred in the high hazard zone, fires ignited readily and would spread easily if measures were not in place. The fires would become difficult to control once they spread to hilly terrain, where a strong wind, high temperature or highly flammable fuel such as dry grass prevailed [1,34]. The spread of fires could be compounded by firebrands (57) that develop during windy conditions causing the fires to jump over barriers such as roads, rivers or firebreaks and ignite new fuels ahead of the fire. The results, except in Communal, dispute the contention that fires occurred predominantly in resettled tenure systems [9,13]. Thus an all-embracing approach to the fire problem needs to be employed throughout the district as fires from one system could readily leap into an adjacent system.
3.4. The Weighted Sum of Fire Hazard and Burnt Area
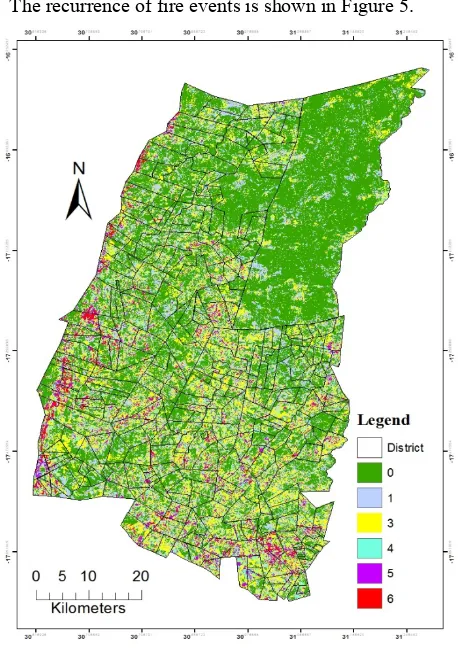
[image:9.595.62.291.100.428.2]The recurrence of fire events is shown in Figure 5.
Figure 5. Number of times pixels burnt in six years
The places that were burnt more frequently were the hotspots. The number of times each pixel was burnt was determined by the weighted sum of burnt area within six years that were randomly selected from the study period as shown in Figure 5. Communal tenure system occupied the largest unburnt area in the district, a result of institutions that were in control. The part that had the highest number of times burnt, maximum of six were uplands on parts of the Great Dyke to the west and the Iron Mask Range to the east where it was difficult to enforce control measures due to
inaccessibility. There are also portions in between and near Harare to the south that were burnt every fire season, possibly a result of close to high population densities from nearby settlements.
The number of times each pixel was burnt was quantified according to tenure to show the zones that required attention in an effort to address the fire problem in the district. A summary of the results is shown in Figure 6.
[image:9.595.313.552.372.552.2]The distribution of the number of times burning occurred in each tenure reveals that it was possible for burning to be prevented as evidenced by a large portion that was not burnt. The communal tenure had ‘effective institutions’ (16) precence of long standing measures and to some extent limited fuel load due to overgrazing (7) that prevented fires from sprouting. A2, Private and Institutions employed their own ways of combating the fires (7) but were not spared from multiple burning over the years. Thus the strategies required to address the fire problem need to embrace all the tenure systems so that they could address the fire problem as a common challenge that requires attention from all parties. Government departments and fire management authorities need to appreciate that fires are part of local communities (67) and that an urgent integrated approach was critical to address the runaway fire problem.
Figure 6. Percentage Number of Times an Area has been Burnt
Table 5. Number of times land was burnt and potential loss of pasture (livestock units)
Area Zero One Three Four Five Six
hectares % L/U % L/U % L/U % L/U % L/U % L/U
Institution 25200 35 4410 23 2898 27 10206 8 4032 5 3150 2 1512
Private 67600 43 14534 25 8450 21 21294 6 8112 4 6760 2 4056
Communal 84100 81 34061 13 5467 5 6308 1 1682 0 0 0 0
A1 119300 46 27439 23 13720 20 35790 5 11930 4 11930 2 7158
A2 139200 42 29232 24 16704 25 52200 1 2784 5 17400 3 12528
Overall 435400 50 108850 22 47894 19 124089 3 26124 4 43540 2 26124
[image:9.595.63.548.606.725.2]3.5. Magnitude of Risk
The weighted sum of burnt area reveals the magnitude of risk in terms of livestock units (LU), mostly cattle that could be deprived of pasture in the event that a fire consumed the seasonal and major stockfeed available for livestock in the study area, Table 5.
The results show that there was loss of pasture throughout the study period when burning occurred. The greatest saving occurred when none of the district was burnt, a total of 435400ha of pasture equivalent to 108850 livestock units (LU) was saved. However repeated burning meant continued losses for instance when 27% of Institutions and 25% of A2 were burnt three times a total loss of 10206 and 52200 livestock units worth of pasture was incurred.
The magnitude of burnt area could be attributed to a seasonal supply of grass, the dominant fuel in the region (68,69). The fires require attention across tenure divide.
Pasture was the most sensitive to veld fires as it was fine fuel that readily ignited and the fire spread rapidly. The first three levels of frequency – zero, one and three times - had the highest across tenure. The pasture that is lost indicates a decline in the carrying capacity of the land and subsequent land degradation (70). Land that has been burnt several times was more prone to risk
Land that has been burnt several times was more prone to risk. For instance, 1% burnt four times in Communal and A1 amounted to 1652 and 2758LU worth of lost pasture in these systems respectively. It is therefore critical to prevent recurrent burning to avert loss of pasture and land degradation.
3.6. Implications for Intervention
The results reveal that the district has a larger proportion in the high hazard zone, where chances of ignition are very high [24,54]. Farmers and stakeholders in these zones need to monitor the cause of ignition, work together as one team across tenure to curb ignition that leads to runaway fires. The farmers need to contend with whatever causes the fires [70,71] in order to contain them or suggest lasting solutions.
The structures in communal tenure seem to bear fruit as the veld fire outbreak has been subdued throughout the study period. Fire control where the grassroots are empowered [21,72] to form hierarchical structures, augmented by government initiatives to deal with the fires would help curb the fire challenge as evidenced by high proportion of land that was not burnt, 80%, in communal tenure.
The high percentage of land that was not burnt, 47% of the district, indicates that it is possible to contain the veld fire scourge. Interestingly, some parts delineated as high hazard zones were not burnt at all within the six year period sampled. Intervention measures thus need to target hotspots (70) which are high hazard zones that coincide with high frequency of fire events and highest number of burnt times.
The grassroots communities need to be incorporated into the initiatives so as to contain the fires (73,74). Most important are the former farm workers, poachers, illegal
miners and the farmers who need to be motivated to condemn the damage caused and appreciate the action needed. The causes of fire ignition need to be identified, not as witch hunting but as a way to address a perennial problem. Fire command centres need to be set up in the districts and subsidiary units in hotspots zones to be able to monitor, raise awareness and communicate fire information to immediate stakeholders for prompt action when the needs arises. Government departments, EMA and the local communities [27,74] need to consider the hazard zones as the starting point for informed research indications and designing the requisite action to combat the fires.
4. Conclusions and Recommendations
The fire hazard zones suggested by the model and the weighted sum of burnt area, provide valuable indicators of fire prone and hazard zones that require a proactive approach if the fire problem is to be contained. The landscape, weather conditions and interwoven nature of the tenure systems promote ignition and subsequent spread of fires in the district. A multipronged approach that would address all dimensions of the root causes of fire ignition and spread is called for to tackle the fire risk situation in the district.The fire hazard situation in the district is high as depicted by the hazard model and validated by the fire events on the ground. The high risk fire problem in the district therefore requires all stakeholder participation, within and/or across tenure and sectoral divides. There is need for all involved to undertake or declare some commitment to participate in prevention and/or control of the fire scourge. While conditions in the resettlement programme, blamed for an increase in veld fires in the district, promote ignition and spread of the fires, the level of risk is equally high in non-accelerated land reform areas such as private and institutions. Thus measures proposed to tackle the fire problem need to target the whole district irrespective of tenure or sector.
The model was confirmed as applicable by the fire events that took place in the study area, most of the fires took place in the zone depicted as high hazard. There is need however to check whether the model or any other would confirm actual losses incurred at grassroots level.
Overall, the study offers insights on the need to address the fire problem in a holistic manner to avert ignition that would lead to runaway fires. It shows hotspots that could be given full attention for reducing the spread of fires. The need for grassroots community participation is critical. The assessment of the applicability of the model against losses that occur at the ground would be the next level of the study in an effort to suggest measures needed to address the wildfire problem.
Acknowledgements
Agency of Zimbabwe, Forest Commission, the District Administrator for Mazowe and Mazowe Rural District council for allowing the research to go ahead, their informed responses and facilities to hold meetings.
Funding
This research did not receive any specific grant from funding agencies, in the public, commercial or nonprofit sectors.
Competing Interests
This research did not receive any specific grant from funding agencies, in the public, commercial or nonprofit sectors.
REFERENCES
[1] Furley PA, Rees RM, Ryan CM, Saiz G. Progress in Physical Geography long-term fi re experiments with particular reference to Zimbabwe. Prog Phys Geogr. 2009; 32(6): 611–34.
[2] Oliveira, S.L.J., Pereira JMC and, Carreiras MB. Fire frequency analysis in Portugal ( 1975 – 2005 ), using Landsat-based burnt area maps. Int J Wild L Fires. 2012;21:48–60.
[3] Ager AA, Vaillant NM, Finney MA, Haiganoush P. Analyzing wildfire exposure and source – sink relationships on a fire prone forest landscape. For Ecol Manage [Internet]. Elsevier B.V.; 2012; 267: 271–83. Available from: http://dx.doi.org/10.1016/j.foreco.2011.11.021
[4] Thompson MP, Calkin DE, Finney MA, Ager AA, Gilbertson-Day JW. Integrated national-scale assessment of wildfire risk to human and ecological values. Stoch Environ Res Risk Assess [Internet]. 2011; 25 (6): 761–80. Available from:
http://apps.webofknowledge.com.proxy-um.researchport.um d.edu/full_record.do?product=UA&search_mode=OneClick Search&qid=23&SID=3ALJdhdnpA7B@GmFpn2&page=1 &doc=2
[5] Thompson MP, Scott J, Helmbrecht D, Calkin DE. Integrated Wildfire Risk Assessment: Framework Development and Application on the Lewis and Clark National Forest in Montana, USA. Integr Environ Assess Manag. 2012; 2(9): 329–42.
[6] Paradzayi C. Land Tenure in Zimbabwe ’ s Post Agrarian Reform Land Tenure in Zimbabwe ’ s Post Agrarian Reform. In: FIG Working Week 2007 “Strategic Integration of Surveying Services.” Hong Kong; 2007. p. 13–7.
[7] Maponga R, Ahmed F, Mushore TD. Remote sensing-based assessment of veld fire trends in multiple interwoven land tenure systems in Zimbabwe. Geocarto Int. 2017;1–15.
[8] Nyawo VZ. Zimbabwe post-Fast Track Land Reform Programme : The different experiences coming through Zimbabwe post-Fast Track Land Reform Programme : The different experiences coming through. Int J African Renaiss Stud - Multi-, Inter- Transdiscipl. 2017; 9(1): 36–49. [9] Dube E. Environmental challenges posed by veld fires in
fragile regions: The case of the Bulilima and Mangwe districts in southern Zimbabwe. Jàmbá J Disaster Risk Stud. 2015; 7(1): 1–8.
[10] EMA. Annual Fire Report. Harare; 2015.
[11] Viegas DX, Almeida M, Raposo J, Oliveira R, Viegas CX. Ignition of Mediterranean Fuel Beds by Several Types of Firebrands. Fire Technol. 2014; 50(1): 61–77.
[12] Zisadza-gandiwa P, Gandiwa E, Matokwe TB, Gwazani R, Mashapa C. Preliminary Assessment of Vegetation Fires and their Impact in Nyanga National their Impact in Nyanga National Park, Zimbabwe. Greener J Biol Sci. 2014; 4: 009–17.
[13] Nyamadzawo G, Gwenzi W, Kanda A, Kundhlande A, Masona C. Understanding the causes , socio-economic and environmental impacts , and management of veld fires in tropical Zimbabwe. Fire Sci Rev. 2013; 2(1): 1–13.
[14] Higgins E, Taylor M, Jones M, Lisboa PJG. Understanding community fire risk—A spatial model for targeting fire prevention activities. Fire Saf J [Internet]. Elsevier; 2013 Nov [cited 2014 Nov 21]; 62:20–9.
[15] Thompson MP, Haas JR, Gilbertson-day JW, Scott JH, Langowski P, Bowne E, et al. Environmental Modelling & Software Development and application of a geospatial wild fi re exposure and risk calculation tool. Environ Model Softw [Internet]. Elsevier Ltd; 2015;63:61–72.
[16] Shaffer LJ, Hall B, Street J. Indigenous fire use to manage Savanna landscapes in Southern Mozambique. Fire Ecol. 2010; 6(2): 43–59.
[17] Sletto B. The Knowledge that Counts : Institutional Identities, Policy Science, and the Conflict over Fire Management in the Gran Sabana, Venezuela. World Dev. 2008; 36(10): 1938–55.
[18] McGee TK, McFarlane BL, Varghese J. An Examination of the Influence of Hazard Experience on Wildfire Risk Perceptions and Adoption of Mitigation Measures. Soc Nat Resour. 2009; 22(4): 308–23.
[19] EMA. Fire Assessment Report. Harare; 2011.
[20] EMA. Fire Assessment Report. Harare: Environmental Management Agency; 2013.
[21] Hudak AT, Fairbanks DHK, Brockett BH. Trends in fire patterns in a southern African savanna under alternative land use practices. Agric Ecosyst Environ. 2004; 101: 307–25.
[22] McGee TK. Public engagement in neighbourhood level wildfire mitigation and preparedness: case studies from Canada, the US and Australia. J Environ Manage. 2011 Oct;92(10):2524–32.
[24] Keane RE, Drury SA, Karau EC, Hessburg PF, Reynolds KM. A method for mapping fire hazard and risk across multiple scales and its application in fire management, Ecol Modell. 2008;221:2–18.
[25] Adab H, Kanniah KD, Solaimani K. GIS-based Probability Assessment of Fire Risk in Grassland and Forested Landscapes of Golestan Province , Iran. 2011 Int Conf Environ Comput Sci. 2011;19:170–5.
[26]Chuvieco E, Camia A, Bianchini G, Margalef T, Koutsias N, Martínez J. Using remote sensing and GIS for global assessment of fire danger. XXII Int Cartogr Conf [Internet]. 2005; (July): 11–6. Available from:
http://cartesia.org/geodoc/icc2005/pdf/oral/TEMA29/Session\ n1/EMILIO\nCHUVIECO.pdf
[27] Mccaffrey S. Thinking of Wildfire as a Natural Hazard. Soc Nat Resour. 2004;17(6):509–16.
[28] Dube E. Improving disaster risk reduction capacity of District Civil Protection Units in managing veld fires : A case of Mangwe District in Matabeleland. Jàmbá J Disaster Risk Stud. 2015;7(143):1–13.
[29] EMA. Fire Assessment Report. Harare; 2010.
[30] Kraaij T. Changing the fire management regime in the renosterveld and lowland fynbos of the Bontebok National Park. South African J Bot [Internet]. Elsevier B.V.; 2010 Aug [cited 2014 Nov 21];76(3):550–7.
[31] Jakes P, Kruger L, Monroe M, Nelson K, Sturtevant V. Improving wildfire preparedness: Lessons from communities across the U.S. Hum Ecol Rev. 2007;14(2):188–97.
[32] Calkin DE, Cohen JD, Finney M, Thompson MP. How risk management can prevent future wildfire disasters in the wildland-urban interface. Proc Natl Acad Sci U S A [Internet]. 2014;111(2):746–51.
[33] EMA. Fire Assessment Report. Harare; 2014.
[34] Caceres CF. Using GIS in Hotspots Analysis and for Forest Fire Risk Zones Mapping in the Yeguare Region, Southeastern Honduras. Papers in Resource Analysis. 2011. p. 1–14.
[35] Ghobadi GJ, Gholizadeh B, Dashliburun OM. Forest Fire Risk Zone Mapping From Geographic Information System in Northern Forests of Iran ( Case study , Golestan province ). Int J Agric Crop Sci. 2012;4(12):818–24.
[36] Chuvieco E, Congalton RG. Application of remote sensing and geographic information systems to forest fire hazard mapping. Remote Sens Environ. 1989;29(2):147–59. [37] Hernandez-Leal PA, Arbelo M, Gonzalez-Calvo A. Fire risk
assessment using satellite data. Adv Sp Res [Internet]. 2006;37(4):741–6.
[38] Epting J, Verbyla D, Sorbel B. Evaluation of remotely sensed indices for assessing burn severity in interior Alaska using Landsat TM and ETM +. 2005;96:328–39.
[39] Smith R, Adams M, Maier S, Craig R, Kristina A, Maling I. Estimating the area of stubble burning from the number of active fires detected by satellite. Remote Sens Environ [Internet]. 2007 Jul [cited 2014 Nov 21];109(1):95–106. [40] Bastarrika A, Chuvieco E, Martín MP. Remote Sensing of
Environment Mapping burned areas from Landsat TM / ETM
+ data with a two-phase algorithm : Balancing omission and commission errors. Remote Sens Environ [Internet]. Elsevier Inc.; 2011; 115(4):1003–12. Available from: http://dx.doi.org/10.1016/j.rse.2010.12.005
[41] Manatsa D, Mukwada G. The cientific WorldJOURNAL Rainfall Mechanisms for the Dominant Rainfall Mode over Zimbabwe Relative to ENSO and / or IODZM. Sci J. 2011;2012:1–15.
[42] Mushore TD. Uptake Of Seasonal Rainfall Forecasts In Zimbabwe Uptake Of Seasonal Rainfall Forecasts In Zimbabwe . IOSR J Environ Sci Toxicol Food Technol. 2013;5(1):31–7.
[43] Roy DP, Frost PGH, Justice CO, Landmann T, Le Roux JL, Gumbo K, et al. The Southern Africa Fire Network (SAFNet) regional burned‐area product‐validation protocol. Int J Remote Sens [Internet]. 2005 Oct 10 [cited 2014 Nov 12];26(19):4265–92.
[44] ZimStats. Zimbabwe Census 2012 National Report. Harare; 2013.
[45] Chinamatira L, Mtetwa S, Nyamadzawo G. Causes of wildland fires , associated socio- economic impacts and challenges with policing , in Chakari resettlement area ,. Fire Sci Rev. 2016;5(1):1–11.
[46] Dube, T. and Mutanga O. Evaluating the utility of the medium-spatial resolution Landsat 8 multispectral sensor in quantifying aboveground biomass in uMgeni catchment, South Africa.pdf. ISPRS J Photogramm Remote Sensing, 101, 36-46. 2015;101:36–46.
[47] Levin N, Heimowitz A. Mapping spatial and temporal patterns of Mediterranean wildfires from MODIS. Remote Sens Environ [Internet]. Elsevier Inc.; 2012 Nov [cited 2014 Nov 11];126:12–26.
[48] Ganteaume A, Jappiot M. What causes large fires in Southern France. For Ecol Manage [Internet]. 2013 Apr [cited 2014 Nov 21]; 294:76–85.
[49] Roy DP, Ju J, Lewis P, Schaaf C, Gao F, Hansen M, et al. Multi-temporal MODIS–Landsat data fusion for relative radiometric normalization, gap filling, and prediction of Landsat data. Remote Sens Environ [Internet]. 2008 Jun [cited 2014 Aug 29];112(6):3112–30.
[50] Chen J, Zhu X, Vogelmann J, Jin S. A simple and effective method for filling gaps in Landsat ETM + SLC-off images. Remote Sens Environ. 2011;xxx(xxx-xxx):1–12.
[51] Mushore TD, Mutanga O, Odindi J, Dube T. Assessing the potential of integrated Landsat 8 thermal bands, with the traditional reflective bands and derived vegetation indices in classifying urban landscapes. Geocarto Int [Internet]. 2016;6049(July):1–14.
[52] Omran E-SE. Detection of Land-Use and Surface Temperature Change at Different Resolutions. J Geogr Inf Syst. 2012;04(03):189–203.
[53] Oumar Z. Fire scar mapping for disaster response in KwaZulu-Natal South Africa using Landsat 8 imagery. Sout African J Geomatics. 2015;4(3):309–16.
a semiarid woodland using Rapid Eye image. J Appl Remote Sens [Internet]. 2013;7(1):073480–13.
[55] Hernandez-Leal PA., Arbelo M, Gonzalez-Calvo A. Fire risk assessment using satellite data. Adv Sp Res. 2006;37:741–6. [56] McAllister S, Finney M. The Effect of Wind on Burning Rate
of Wood Cribs. Fire Technol [Internet]. Springer US; 2015;52(4):1035–50.
[57] Suzuki S, Johnsson E, Maranghides A, Manzello SL. Ignition of Wood Fencing Assemblies Exposed to Continuous Wind-Driven Firebrand Showers. Fire Technol [Internet]. Springer US; 2016;52(4):1051–67.
[58] Lam CS, Weckman EJ. Wind-blown pool fire, Part I: Experimental characterization of the thermal field. Fire Saf J [Internet]. Elsevier; 2015;75:1–13.
[59] Jaiswal RK, Mukherjee S, Raju KD, Saxena R. Forest fire risk zone mapping from satellite imagery and GIS. Int J Appl Earth Obs Geoinf. 2002;4(1):1–10.
[60] Viegas DX. A Mathematical Model for Forest Fires Blowup. Combust Sci andTech,. 2005;177:27–51.
[61] Haiganoush KP, David RB, Robert EB, Benoit J. Probability based models for estimation of wildfire risk ∗. Int J Wildl Fire. 2004;13:133–42.
[62] Jia K, Wei X, Gu X, Yao Y, Xie X, Li B. Land cover classification using Landsat 8 Operational Land Imager data in Beijing, China. Geocarto Int. 2014;29(8):941–51.
[63] Acharya TD, Parajuli J, Shahi K, Poudel D, Yang I. Extraction and Modelling of Spatio-Temporal Urban Change in Kathmandu Valley. Int J IT, Eng Appl Sci Res. 2015;4(3):1–11.
[64] Buxton M, Haynes R, Mercer D, Butt A. Vulnerability to Bushfire Risk at Melbourne’s Urban Fringe: The Failure of Regulatory Land Use Planning. Geogr Res [Internet]. 2011 Feb 5 [cited 2014 Nov 21];49(1):1–12.
[65] Chuvieco E, Aguado I, Yebra M, Nieto H, Salas J, Martín MP, et al. Development of a framework for fire risk assessment using remote sensing and geographic information system technologies. Ecol Modell [Internet]. 2010 Jan [cited 2014
Sep 3];221(1):46–58.
[66] Hudak AT and BBH. Mapping fire scars in a southern African savannah using Landsat imagery. Int J Remote Sens. 2004;25:16(February 2015):3231–43.
[67] Sletto B, Rodriguez I. Burning , fi re prevention and landscape productions among the Pemon , Gran Sabana, Venezuela : Toward an intercultural approach to wildland fi re management in Neotropical Savannas. J Environ Manage. 2013;115:155–66.
[68] Andersen AN, Woinarski JCZ, Parr CL. Savanna burning for biodiversity: Fire management for faunal conservation in Australian tropical savannas. Austral Ecol [Internet]. 2012 Sep 16 [cited 2014 Nov 10];37(6):658–67.
[69] Archibald S, Scholes RJ, Roy DP, Roberts G, Boschetti L. Southern African fire regimes as revealed by remote sensing. Int J Wildl Fire [Internet]. 2010;19(7):861.
[70] Le Maitre DC, Kruger FJ, Forsyth GG. Interfacing ecology and policy: Developing an ecological framework and evidence base to support wildfire management in South Africa. Austral Ecol. 2014;39(4):424–36.
[71] Martinez-Fernandez, J. Vega-garcia C, Chuvieco E. Human-caused wildfire risk rating for prevention planning in Spain. J Environ Manage. J Environ Manage. 2008;90(November 2015):1241–52.
[72] Martin WE, Martin IM, Kent B. The role of risk perceptions in the risk mitigation process: The case of wildfire in high risk communities. J Environ Manage. 2009;91(2):489–98.
[73] Kirschenbaum A. Preparing For The Inevitable: Environmental Risk Perceptions and Disaster Preparedness. Int J Mass Emerg Disasters. 2005;23(2):97–127.
[74] Kirschenbaum A. “Disaster preparedness a conceptual and empirical reevaluation. Int J Mass Emerg Disasters. 2002;20(1):5–28.