Two-Element Phased-Array Acousto-Optic Deflector at
High Diffraction Efficiency: Scanning Range Broadening
Sergey Antonov
1, Valery Proklov
1, Yuri Rezvov
2, Alexander Vainer
1,*1Kotel’nikov Institute of Radio Engineering and Electronics, Fryazino Branch, Russian Academy of Sciences,pl. Vvedenskogo 1, Fryazino, Moscow oblast, 141190, Russia
2Novomoskovsk Institute, Mendeleev University of Chemical Technology, ul. Druzhby 8, Novomoskovsk, Tula oblast, 301665 Russia *Corresponding Author: [email protected]
Copyright © 2014 Horizon Research Publishing All rights reserved.
Abstract
An acousto-optic deflector with a two-element phased-array piezoelectric transducer is investigated at high diffraction efficiency (close to 100%). Significant broadening of the frequency band (and, thus, the angular scanning range) relative to the well-known low efficiency regime is theoretically predicted and experimentally demonstrated. Experiments with an off-axis deflector based on paratellurite (TeO2), a 1.06 µm light radiation and 6 mm interaction length gave frequency band from 17 to 48 MHz at an efficiency of no less than 94% of the maximum value.Keywords
Acousto-Optic Deflector, Phased-Array, Paratellurite1. Introduction
Phased-array transducers are used to broaden the frequency band (and, thus, the scanning range) and to lower the driving power of acousto-optic (AO) deflectors. Such a transducer consists of several elements, each of them emitting an acoustic wave of the same frequency, but with different phase. The phase shifts between the elements deflect the main lobe of the directivity pattern of the acoustic field, and the Bragg phase-matching can be maintained in a wider frequency band. There are several methods of creating those phase shifts: connecting neighbor elements with opposite polarity [1], mounting elements on the steps that are cut in the AO medium [2], and controlling phases of the driving signals electronically [3], which provides the best results.
Although phased-array transducers in acousto-optics were described in the 1960s, they are investigated almost only in case of weak AO interaction, under a linear approximation. The analysis is often carried out by an examination of the angular spectrum of the acoustic field. The efficiency is supposed to be proportional to the power of the corresponding component of that spectrum. Those investigations show that in case of N transducer elements,
each of length L, the spectrum is a product of slowly varying envelope function – it is called the element factor, because it has exactly the shape of the spectrum of the acoustic field, produced by only one element – and a quickly oscillating array factor [1]. By varying the phases of the elements, one can arbitrarily move the maximums of the array factor. If the phases are being kept optimal for every driving frequency, then the resulting bandwidth would be exactly equal to the bandwidth of one element of the transducer, operating solely. That is, the bandwidth corresponds to the interaction length L . However, the diffraction efficiency produced by multi-element transducer corresponds to the total interaction length, N L⋅ .
But this approach is valid only at weak interaction. In this work we demonstrate a substantial difference in the high efficiency regime, when the diffraction efficiency is not linear with respect to acoustic power. In particular, the frequency band of a two-element transducer at a level of 94% is equal to that of an undivided transducer of the length L 2, not L. Under isotropic AO interaction, when frequency band is inversely proportional to interaction length, that doubles the band relative to low-efficiency regime.
The relevance of this work is caused by the application of AO devices in power optics, where constant high diffraction efficiency throughout entire scanning range is needed. Another important factor is the development of multichannel signal generators, which made it possible to create any phase shifts and control them precisely.
2. Basic Equations
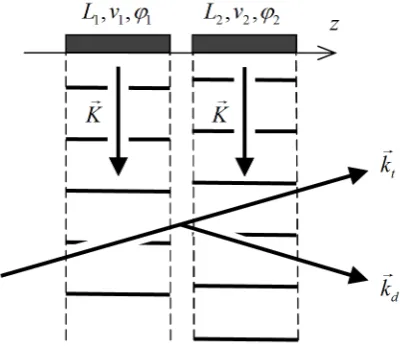
diffracted light wave, K is the central wave vector of the acoustic field (i.e., the one that is perpendicular to the transducer plane). Axis z is drawn along the propagation direction of light.
Figure 1. The AO diffraction by layered acoustic field
We define the entire light field as:
( )
( )
( )
, exp 2 exp 2 2 E r t e C zt t j t jk r j zte C zd d j t j ft jk r j zd χ ω χ ω π = − − + + + − + ,
Ct d are complex amplitudes of the diffraction orders; ,
et d are unit polarization vectors; j is the imaginary unit; ω is the initial optic frequency; f is the acoustic frequency; r is the position vector;
χ
is the Bragg phase-matching condition mismatch:kd kt K z
χ= − − (1) Here index z denotes the component of the vector along z axis.
Our notation differs from classical by the factors ±jχ 2z in the exponents. They are introduced to simplify the following formulas. Namely, they detach the phases of the diffraction orders from the plane z=0. Without them a recalculation would be needed to proceed from the exit plane of one acoustic layer to the input plane of the next one, even if they actually coincide [4].
Under this notation the standard coupled-waves equations take the following form:
(
)
( )
exp 2 2 exp 2 2d C j C v j C
t t d
dz L
d C v j C j C
d t d
dz L χ ϕ χ ϕ = − − = −
The solution can be written as a transmission matrix that links the amplitudes of light waves at the exit plane of the acoustic layer to that at the input plane of the same layer:
(
)
(
)
( )
( )
* *
C z Lt T D C zt C z Ld D T C zd
+ − = +
( )
2 2 sinc exp2 2 2
v v L
D= +χ jϕ
2 2 cos 2 2 2 2 sinc
2 2 2
v L
T
L v L
j χ χ χ = + + + +
where sinc
( )
x =sin( )
x x , and «*» designates complex conjugate. Let us denote the diffraction efficiency in i-th layer as ηi and the additional phase shift of the zeros diffraction order [5] as ψi:( )
1 exp
2 exp
Li
Ti i j j i
Di i j i χ η ψ η ϕ = − + =
The diffraction by successive acoustic layers , , ,1 2 N is described by simple multiplication of the matrices of all the layers:
(
)
(
)
( )
( )
* 1 * 1
* 1 * 1
* *
2 2 1 1
* *
2 2 1 1
T D T D
C zt out N N N N
C zd out D T D T
N N N N
C z
T D T D t in
C zd in
D T D T
− − − − = − − − −
Our system actually consists of three layers – the acoustic fields of two elements of the transducer and an optional soundless gap between them. Multiplying the matrices we find the total diffraction efficiency by the entire system:
(
)
(
)
(
)(
)
( )
1 1
1 2 2 1
2 1 2 1 1 1 2 cos total
η η η η η
η η η η
= − + − +
+ − − Φ , (2)
with all phase parameters collected in one term:
1 2
2 1 1 2 L 2L d
ϕ ϕ ψ ψ χ +
Φ = − + + + +
(3)
d is the width of the gap between the elements. In a simple case with no gap and identical elements (equal sizes and acoustic amplitudes) this turns into:
(
)
( )
2 1 1 cos
2
2 1
total
L
η η η
ϕ ϕ ψ χ
= − + Φ
Φ = − + + (4)
The efficiency of the AO interaction depends on the product of the Bragg condition mismatch and the interaction length: the higher is the product, the lower is the efficiency. To increase the efficiency and broaden the frequency band (i.e., the scanning range), firstly the geometry of AO diffraction should be chosen so that the wave vectors difference in (1) stays low in as wide band as possible. Secondly, the interaction length should be lowered. However, the necessary driving power is inversely proportional to that length, and this circumstance (and also some others [6]) limits the lowering of the interaction length. To overcome this limit a phased-array transducer should be used, which has longer interaction path and lower driving power, but wider frequency band.
To estimate the bandwidth at high efficiency level we expand the one-element efficiency in series with respect to the mismatch accurate to first three terms. Efficiency does not depend on the sign of the mismatch, so the series contain only even-power terms:
( )
2 4 6
1
2 2
L L
A B O
I
η= − χ + χ + χ
(5)
I is the efficiency without mismatch (i.e., the maximum efficiency). Coefficients A and B depend on I and lay within intervals 0.33 – 0.4 and 0.045 – 0.065, respectively.
Let us consider two-element transducer with identical elements and without gap (4). If there is no phase shift between the elements, than it is equivalent to single undivided transducer. Its total efficiency expands into almost the same series:
( )
2( )
4( )
61 2 2
undiv A L B L O
Iundiv
η = − χ + χ + χ (6)
The differences are double interaction length and different values of coefficients (they are marked with index «2» not to forget it).
Let us determine the bandwidth at a level γ relative to maximum efficiency:
I total total
η ≥γ If
γ
is higher than 50%, we can truncate (6) to square term. Consequently, to keep total efficiency not lower than the chosen levelγ
, we have to stay within the following range of mismatch:1 1 2 undiv L Aγ
χ ≤χ = −
Now if the phase shift 2 1ϕ −ϕ is introduced to keep 0
Φ = at all frequencies, than total efficiency would become:
(
0)
4 1(
)
total opt
η Φ = =η = η −η (7) Index «opt» designates the optimal phase shift between the elements.
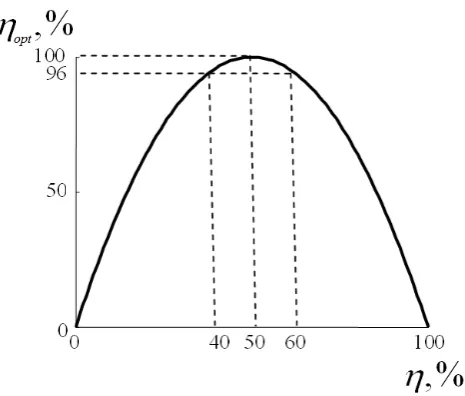
In spite of its simplicity, this formula is an important result
[image:3.595.317.550.208.406.2]of the work. Let us analyze this dependency – fig. 2. First, the total efficiency maximum ηtotal =100% is reached when one-element efficiency is η=50%. Second, the total efficiency remains high in a wide range of η – it lowers to 96% only if η drops down to 40%. In other words, if the Bragg condition mismatch and available driving power let us gain at least 40% diffraction by one element, than total efficiency would be no less than 96%. This circumstance significantly broadens the frequency band, as it would be shown further.
Figure 2. Total diffraction efficiency versus efficiency of one element
Substituting (5) into (7), we get:
( )
21 2 1
1 1
1 1 2
4 4
1 2 1 1 2 6
1 1
1 1 2 1 1 2
I L
opt A
Iopt I
I B L I A L O
I I
η χ
χ χ χ
−
= − +
−
−
+ − +
− −
Here indices «1» are used to emphasize that parameters refer to the efficiency of a single element, not the entire transducer.
In low-efficiency regime (I1<<1) we consider only square term:
( )
2 4
1 1 2
2 1 1 L
opt A O
Iopt
low L A
η χ
χ
γ χ χ
= − +
−
≤ =
At low efficiency the difference between 1A and 2A is negligible, so we get the well-known result:
2 low undiv
χ = χ , i.e. splitting the transducer into two elements with optimal phasing doubles the allowed range of the mismatch.
zeroed:
( )
42 6
1 1
2 1 2
41 1 L
opt A O
Iopt
low high L A
η χ
χ
γ χ
χ χ
γ
= − +
−
≤ = =
−
It means that the allowed mismatch under maximum efficiency is
(
1−γ −)
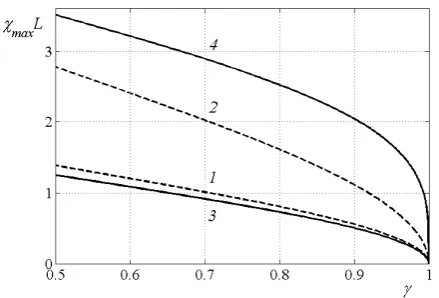
1 4 times higher than in low-efficiency regime. The exact numerically calculated allowed mismatch is shown on fig. 3. The dashed lines correspond to low efficiency regime, whereas solid lines describe maximum efficiency regime. In case of undivided transducer (curves 1, 3) the difference between low efficiency and high efficiency is insignificant and corresponds to the interval of variation in coefficient A. The important difference appears in case of optimal phase shifts – curves 2 (low efficiency) and 4 (maximum efficiency). This difference increases with levelγ
. When the bandwidth is determined at a level of γ =0.5, the allowed mismatch for the strong interaction is 25% greater than at low efficiency; when γ =0.75 – 50% greater; when γ =0.94 – two times greater.Let us compare not different levels of efficiencies, but the operation of a single transducer and an optimally phased two-element transducer of the same total length and at the same maximum efficiency. As it may be seen from figure 3, if we take γ =0.94 than the allowed range of mismatch increases 4.5 times when we replace a single transducer with a two-element phased array. It's worth mentioning once more that the driving power remains the same. In isotropic AO diffraction the frequency band would be increased the same 4.5 times.
4. Transducer Imperfections
Let us consider the influence of several expectable imperfections of the transducer fabrication and operation:
an inequality of the interaction lengths;
an inequality of the acoustic amplitudes;
the gap between the acoustic layers.
The first and second factors make the diffraction efficiencies of the acoustic layers different. However, this difference does not limit the total efficiency, because under optimal phase shift:
(
)
(
)
(
)
21 1
1 2 2 1
opt
η = η −η + η −η
total efficiency reaches 100% provided η η1+ 2=1. The negative effect of this difference is the growth of necessary driving power. Since the dependence of the η upon driving power is a saturation curve (negative second derivative), the more is the difference between 1η and 2η , the more power
[image:4.595.316.536.107.256.2]is needed to reach η η1+ 2=1.
Figure 3. Maximum allowed Bragg condition mismatch versus minimum efficiency level. Low efficiency case: 1 – no phase shift (undivided transducer), 2 – optimal phase shift. Maximum efficiency: 3 – no phase shift, 4 – optimal phase shift
The third factor – gap – affects the value of optimal phase shift between the elements and decreases the angular aperture of the AO deflector, i.e. the range of angles of initial light beam incidence. Assume the phase shift is set to be optimal for same chosen angle of incidence. As we change the angle of incidence, the Φ grows, leading to decrease in total diffraction efficiency. The growth of Φ is determined by factor
(
L1+L2)
2+d , i.e. the distance between the centers of the elements. The greater is that distance, the fasterΦ grows and the lower is the available angular range.
5. Experiment
For experimental verification a paratellurite (TeO2) [6] single-crystal deflector was used. A slow shear wave was exited with the wave vector lying in crystallographic plane
( )
110 and making an angle of 6° with axis(
110 . The)
sound velocity was equal to 650 m/s. The piezoelectric transducer had two elements, each 3 mm width, with a gap between them of about 0.5 mm. The initial light radiation had wavelength 1.06 µm and angular aperture 2.4 mrad in vacuum.Figure 4. Experimental diffraction geometry
Given the allowed mismatch value maxχ the maximum bandwidth is:
8 max 2
n
K o
f Vs∆π Vs χπλ
∆ = =
where Vs is the acoustic velocity, no is the refraction index of the diffracted light wave, λ is the wavelength of light in vacuum.
The important thing is that unlike the isotropic AO diffraction, in this case the bandwidth is proportional not to the allowed mismatch, but to the square root of that mismatch. Consequently, we should expect an increase in the bandwidth not according to the paragraph 3 values, but according to square roots of those values. In particular, at
0.94
γ = we should expect not 4.5 times increase, but rather 2.1 times.
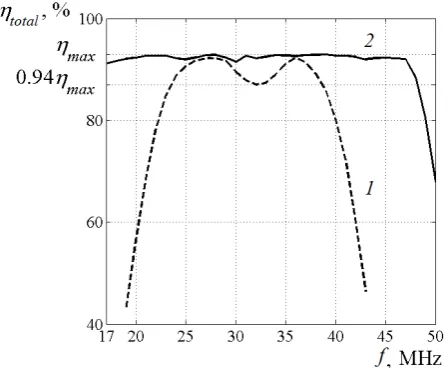
The measured efficiency is plotted on fig. 5. Curve 1 was taken with no phase shift between the elements. At each frequency the powers of the driving signals were adjusted to get maximum efficiency. At frequencies 27 MHz and 36 MHz the exact Bragg matching was observed, and the efficiency was limited only by non-zero angular aperture of the optical radiation [6]. This effect is not accounted for in paragraph 3, since we considered the diffraction orders to be plane waves. But we still can expect a satisfactory agreement of the experimental data and the theoretical predictions, because the maximum gained efficiency – ηmax=95% – was close to 100%, and, consequently, the influence of the angular spread of light was low.
In the center of the band the efficiency had a local minimum of 87%, i.e. 0.94 maxη . This value (0.94) was taken as the level γ to calculate bandwidth in this and subsequent measurements. Without the phase shift the bandwidth amounted to 15 MHz.
Curve 2 represents the measured efficiency under optimal phase shifts. The powers of the driving signals were kept the same as for curve 1. The optimal values of the phase shift were found experimentally for each frequency individually. This regime increases the allowed mismatch maxχ , and because of that the angle of the initial light wave incidence was adjusted to maximize bandwidth.
The following conclusions were drawn from the measured data. First, the maximum efficiency in both regimes was the
same. Since it is limited by the angular width of the optical radiation, we conclude that the angular aperture of the AO diffraction in both cases is virtually the same. Second, the bandwidth under optimal phase shifts was substantially greater. The low-frequency edge of the AO bandwidth was not measured because of the limited frequency range of electrical matching of the elements. Nonetheless, the bandwidth of 31 MHz was reached, which is twice as big as the bandwidth without phase shifts. As it was described earlier, a two-fold increase in bandwidth in this AO geometry is equivalent to four-fold increase in allowed mismatch, or, in other words, to virtual four-fold decrease in interaction length.
The AO bandwidth of one element operating solely was 22 MHz (not shown on the figure), which has a good agreement with the theory and other measurements.
Figure 5. Measured total efficiency versus acoustic frequency. 1 – no phase shift (analogous to undivided transducer); 2 – optimal phase shift
6. Conclusion
It was theoretically found, that the two-element phased-array AO deflector at high diffraction efficiency has greater scanning range, than at well-known low-efficiency regime, provided the driving signals have optimal phase shifts. Such a deflector at low efficiency has the same scanning range as a deflector with twice lower interaction length. At maximum efficiency, the range at 0.94 efficiency level corresponds to 1/4.5 of interaction length, which is a significant broadening. In case of isotropic AO interaction the scanning range is inversely proportional to interaction length, so at high efficiency the phased-array technique with only two elements increases the range in 4.5 times, with no increase in necessary driving power.
[image:5.595.320.544.280.464.2]was expected. The measured broadening was 2 times due to the limited frequency band of electrical matching of the transducer. This result brightly demonstrates the predicted effect, since the well-known low-efficiency broadening for such a deflector is only 1.45 times.
Acknowledgements
The work was supported in part by the Russian Foundation for Basic Research, #12-07-00186-a, #13-02-00479-a.
REFERENCES
[1] E. I. Gordon. A Review of Acoustooptical Deflection and Modulation Devices, Applied Optics, 1966, V. 5, № 10, pp. 1629-1639.
[2] C. P. L. Voshol and A. J. G. Spiekerman. Acoustooptic Laser
Beam Deflector with Modified Phased-Array Transducer, IEEE Transactions on Sonics and Ultrasonics, 1975, V. 22, № 2, p. 143.
[3] J. Aboujeib, A. Perennou, V. Quintard and J. L. Bihan. Planar phased-array transducers associated with specific electronic command for acousto-optic deflectors, Journal of Optics A: Pure and Applied Optics, V. 9, 2007, pp. 463–469.
[4] R. J. Pieper and A. Korpel. Matrix formalism for the analysis of acoustooptic beam steering, Applied Optics, 1983, V. 22, № 24, pp. 4073-4081.
[5] V. I. Balakshy. Additional phase shift effect in acousto-optic interaction and its applications, Proc. SPIE 1844, Acousto-Optics and Applications, pp. 178-186 (November 25, 1992).
[6] L. N. Magdich, V. Ya. Molchanov. Acoustooptic Devices and Their Applications, Gordon and Breach Science Publishers, New-York, 1989.