Economic
Research
and Social
Institute
SMALL-SCALE MANUFACTURING
INDUSTRY IN IRELAND
KIERAN A. KENNEDY and TOM HEALY (assisted by J..Bergin, T. Callan and P. McNutt)
*T. K. WHITAKER, M.SC.(ECON), D.ECON., SC., LL.D., President of the Institute. *P. LYNCH, M.A., M.R.I.A., Chairman of the Council.
D. J. BUCKLEY, Vice President and General Manager, ll/Ierck, Sharp and Dohme (Ireland) Ltd., Co. Tippera~y.
L. CONNELLAN, B. E., ENG., M.I.E.I., Director General, Confederation of Irish Industry. *SEAN CROMIEN, B.A., Second Secretary, Department of Finance.
G. DEAN, M.D., F.R.C.P., Director, Medico-Social Research Board.
N. J. GIBSON, B.SC.(ECON.), PH.D., Professor, Department of Economics, University of Ulster, Coleraine.
PATRICK A. HALL, B.E., M.S., DIP.STAT., Director of Research, Institute of Public Administration.
*W. A. HONOHAN, M.A., F.I.A.
MICHAEL F. KEEGAN, B.A., B. COMM., D.P.A., F.I.P.M., Secretary, Department of Labour.
*KIERAN A. KENNEDY, M.ECON.SC., B.PHIL., PH.D., Director of the Institute. MICHAELJ. KILLEEN, B.A., B.COMM., LL.D., Chairman, Irish Distillers Group. T. P. LINEHAN, B.E., B.SC., Director; Central Statistics Of J~ce.
*D. F. McALEESE, B.COMM., M.A., M.ECON.SC., PH.D., Whately Professor of Political Economy, Trinity College, Dublin.
CHARLES McCARTHY, PH.D., B.L., Professor of Industrial Relations, Trinity College, Dublin.
*EUGENE McCARTHY, M.SC.(ECON.), D.ECON.SC., Director, Federated Union of Employers.
JOHN J. McKAY, B.SC., D.P.A., B.COMM., M.ECON.SC., Chief Executive Of JTceT; Co. Cavan Vocational Education Committee.
*J. F. MEENAN, M.A., B.L.
*D. NEVIN, General Secretary, Irish Congress of Trade Unions. *TOMAS F. O COFAIGH, Governor, Central Bank.
JOYCE O’CONNOR, B.SOC.SC., M.SOC.SC., PH.D., Director, Social Research Centre, College of Humanities, National Institute for Higher Education, Limerick.
D. P. O’MAHONY, M.A., PH.D., B.L., Professor, Department of Economics, University College, Cork.
LABHRAS 6 NUALLAIN, D.ECON.SC.
B. PATTERSON, B.A., M.I.I.E., A.I.P.M., Director General, Irish Management Institute. S. SHEEHY, B. AGR. SC., PH.D, Professor, Department of Applied Agricultural Economics,
University College, Dublin.
J. SPENCER, B.SC. (ECON), Professor; Department of Economics, The Queen’s University of
~lfast.
T. C. TONER, B.COMM., M.B.A., Managing Director, BWG Ltd.
*B. M. WALSH, B.A., M.A., PH.D., Professor, National Economics of Ireland and Applied Economics, University College, Dublin.
T. WALSH, M.AGR.SC., PH.D., D.SC., M.R.I.A.
*REV. C.K. WARD, B.A., S.T.L., PH.D., Professor, Department of Social Science, University College, Dublin.
P.A. WHITE, B.COMM., D.P.A., Managing Director, Industrial Development Authority, Dublin.
INDUSTRY IN IRELAND
Copies of this paper may be obtained from The Economic and Social Research Institute (Limited Company ,/Vo. 18269). Registered Office: 4 Burlington Road, Dublin 4.
Price IR£7.50
IN IRELAND
KIERAN A. KENNEDY and TOM HEALY (assisted by J. Bergin, T. Callan and P. McNutt)
© THE ECONOMIC AND SOCIAL RESEARCH INSTITUTE DUBLIN, 1985
Page
Acknowledgements (iv)
General Summary 1
Chapter
1 INTRODUCTION 5
1 Definitional and Measurement Problems 6
2 Outline of Study 13
PART I THE ROLE OF SMALL MANUFACTURING INDUSTRY 15
2 THE EXTENT OF SMALL MANUFACTURING INDUSTRY
IN IRELAND AND ABROAD 16
1 The Size Structure of Irish Manufacturing Industry 16
2 Comparison with Other Countries 24
3 Conclusions 31
3 SMALL-SCALE INDUSTRY AND THE MAJOR BUSINESS
FUNCTIONS 33
1 Technology 33
2 Marketing 39
3 Finance 43
4 Management 47
5 Conclusions 50
4 THE STRUCTURE AND GROWTH OFSMALL INDUSTRY 51
1 Diversity of Small Firms 51
2 Industrial Distribution of Small Firms 54
3 Productivity and Efficiency 59
4 Growth of Small Firms 66
5 S~I/IALL INDUSTRY AND ENTREPRENEURSHIP 76
1 The Role of the Entrepreneur 77
2 Indigenous Entrepreneurship in Ireland 79
3 The Role of Small Industry in Entrepreneurial Development 82
6 SMALL INDUSTRY POLICIES IN OTHER COUNTRIES 84
1 The General Nature of Policy Interventions 84
2 Institutional Framework 86
3 Finance 88
4 Technological, Marketing and Advisory Services 94
5 Conclusions 98
PART H THE SMALL INDUSTRY PROGRAMME (SIP) 101 7 SMALL-SCALE INDUSTRIAL DEVELOPMENT POLICY IN
IRELAND
1 The Origin and Scope of the Small Industry Programme 2 Other Assistance to Small Firms
3 Conclusions
8 EMPLOYMENT IN SIP FIRMS
1 The Level and Trend of SIP Employment 2 Structure of Employment in SIP Industry 3 Conclusions
9 SIP GRANTS AND INVESTMENT 1 Approvals Data
2 Conversion Rates
3 Closures 4 Conclusions
PART III POLICY CONCLUSIONS 10 POLICY IMPLICATIONS FOR IRELAND
! Overall Industrial Strategy 2 Strategy for Small Industry 3 Policy Instruments
4 Concluding Comments References
Appendix Data Sources and Methods
Table 1.1
Page Relation between Enterprises and Establishments in UK
Manu-facturing, 1980 8
2.1 Number of Establishments in Irish Manufacturing Industry Classi-fied by Size, Various Years, 1929-1980 (CSO data) 18 2.2 Distribution of Employment in Irish Manufacturing Industry by
Establishment Size, Various Years, 1929-1980 (CSO data) 20 2.3 Number of Establishments and Employment in Irish
Manufactur-ing, Classified by Size, 1973 and 1980 (IDA data) 23 2.4 Manufacturing Employment in Various Countries, Divided into
Establishment Size Classes 26
2.5 Average Size of Establishments in Manufacturing, Various
Coun-tries 28
3.1 Percentage of Output Exported for Different Size Categories of Firms
in h’ish Manufacturing Industry, 1973 41
4.1 Share in Total Employment of Small Establishments, Irish
Manu-facturing Groups, Various Years 56
4.2 Shares in Total Manufacturing Employment of Small
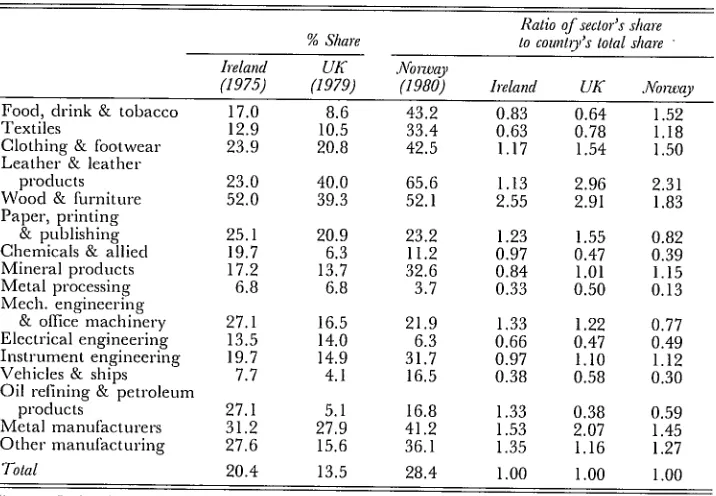
Establish-ments, NACE groups: Ireland, UK and Norway 57
4.3 Average Net Output per Head, Current Prices, in Different Estab-lishment Size Classes, Irish Manufacuring, Various Years 60 4.4 Distribution of Establishments in Different Size Classes by Net
Output per Head, Irish Manufacturing, 1975 60
4.5 Average Salaries and Wages in Different Establishment Size Classes,
Irish manufacturing, 1979 62
4.6 Employment Changes 1973-80 in Establishments Existing in Irish
Manufacturing in 1973 71
4.7 Mean and Standard Deviation of the Percentage Changes in Employment 1973-80 in all Establishments Existing in Irish
Manufacturing 1973 72
7.1
8.8 8.9 8.10
IDA Capital Expenditure on Industrial Programmes, Various
Years, Current Prices 110
8.1 Employment in SIP Establishments 1973 and 1980 117 8.2 Components of Employment Changes in Various Types of IDA
Grant-aided and other Establishments, 1973-80 119 8.3 Percentage Change in Employment in Various Types of Industry,
1973-80 121
8.4 SIP Establishments and Employment Distributed by Industry
Group 1973 and 1980 123
8.5 SIP Employment as a Proportion of Total Employment by Industry
Group, 1980 125
8.6 Female Employment Share in SIP Sector and in Total
Manu-facturing 1980 126
8.7 SIP Establishments and Employment Distributed by Region 1973
and 1980 127
SIP Establishments and Employment by Nationality, 1973 and 1980 129 SIP Establishments and Employment by Size, 1973 and 1980 131 Size Class in 1973 (or First Year of Entry) of Establishments with 50
or more Persons in 1980 132
9.1 SIP Grant Approvals 1967-1982 135
9.2 Industrial and Regional Distribution of Number of SIP Project
Approvals, Various Sub-Periods 1967-1982 137
9.3 Industrial and Regional Breakdown of Grant Approvals, 1967-82,
at Constant 1982 Prices 138
9.4 Anticipated Grant Rate and Capital Intensity in SIP, 1967-1982,
at Constant 1982 Prices 139
9.5 Anticipated Grant Rate and Capital Intensity by Industry Group
1967-1982, at Constant 1982 Prices 140
9.6 Anticipated Total Grant Rates and Capital Intensity in Different
IDA Programmes, 1980-82 142
9.7 Conversion Rates for Capital Grants and Jobs in Establishments
9.8
9.10
Comparison of Anticipated and Actual Grant Rate and Capital
Intensity in SIP Cohorts 146
9.9 Comparison of Conversion Rates and Grant Cost per Job in SIP
and Other IDA Programmes 147
Annual Closure Rates 1973-79 for SIP Establishments Approved
in the Period 1967-78 149
9.11 Employment Losses due to SIP Closures 1973-79 as a Percentage of
Total SIP Employment by Industry Group 151
APPENDIX TABLE
Price Indices used to Deflate Nominal Amounts of SIP Grants and Expenditure on Fixed Assets
A
Economic doctrine, like most aspects of human thought and behaviour, is prone to changes of fashion. This is very evident in regard to views on the size structure of industry most suited to economic progress. For long the dominant emphasis was on large-scale production units, which were thought to be more efficient and innovative. But in the last decade or so the pendulum has swung back, and in many countries small-scale industry is looked to increasingly to produce industrial dynamism and more jobs. All fashion changes, however, run the risk of swinging too far, with inevitable disappointment when over-optimistic expectations fail to materialise. To provide a solid basis for policy action, therefore, it is important to assess the weaknesses as well as the strengths of small industry. In that way we can hope to arrive at a realistic definition of the role of small industry and avoid groundless euphoria.
The present study attempts to provide such an assessment for small-scale manufacturing industry in Ireland. The study is divided into three parts. Part I reviews evidence for Ireland and for other countries on the importance of small industry, its performance in carrying out the different functions of business, and its capacity for growth. Consideration is also given to the significance of develop-ing new enterprise, and to the policy stance adopted in other countries towards small industry. Part II examines the operation of the Small Industry Programme initiated by the Industrial Development Authority in 1967. Part III discusses the policy implications for Ireland and makes proposals about future strategy in regard to the development of small industry.
Characteristics of Small Industry
employment in large establishments, and the average size of these large estab-lishments is small by international standards. More so than in most countries, therefore, manufacturing employment is concentrated in middle-sized estab-lishments (50-500 employees).
In all countries, the generality of small firms are technologically unsophisti-cated. Nevertheless, in some countries, especially the United States, a minority of the small firms can and do make a significant contribution to technological change, particularly at the inventive stages of new products and processes. Innovative small firms tend to be concentrated at the early stages of the product cycle when tecl~nological development is rapid and fluid. The great bulk of small firms serve local markets and encounter considerable problems in exporting. Finance is almost always a significant problem for small firms, especially new small firms, partly because of their own poor financial control and expertise. But, in addition, financiers are often reluctant to invest in, or lend to, businesses which are perceived to have no track record, offer little security and are vulner-able to competition from large firms or other small firms. Such perceptions are not without foundation, of course, but if applied in a blanket manner, they can result in a "finance gap" even for viable small firms; and virtually all countries have found it necessary to take special measures to improve access to finance for small firms.
Typically the very small firm is managed solely by the owner, who may also spend some of his time working on the factory floor. This can lead to serious management inadequacies in regard to certain functions in which the owner/ manager has no expertise. Moreover, the manager is often too busy to take time off for management courses. As the small firms grow, a more specialised managerial structure becomes essential, but many small firms fail to make the necessary adaptation -- sometimes because of the reluctance of the owner to dilute control through delegation.
This high degree of variability extends to many aspects of the performance of small firms. Though there is no conclusive evidence that small firms are less profitable than large on the average, their profits fluctuate more. Since small firms are engaged in a more limited range of production, they are less able to offset losses on some lines against profits on others. Because of the pervasive nature of unemployment in recent years, much interest has centred on the employment performance of small firms. Again the evidence points to greater variability in employment changes in small firms than in large. But the evidence also shows that, on average, employment growth has been relatively greater in small firms. This evidence, however, needs to be interpreted with care. Even though small firms are a better bet for employment growth than large firms, nevertheless they account for only a fraction of total employment. If employ-ment in larger firms is static or declining, it is therefore most unlikely that a satis-factory overall employment increase can be achieved solely from employment growth in small firms.
The Small Industry Programme
The Small Industry Programme (SIP), operated by the IDA (and by SFADCo in the mid-west region), is the major national programme directed towards the development of small manufacturing industry in Ireland. Part II of this study describes the evolution of the SIP, which was begun in 1967, and examines the operation of the scheme. The SIP approved establishments are overwhelmingly indigenous and are heavily concentrated in the metals and engineering and wood and furniture industrial groups. The growth of employ-ment in SIP approved establishemploy-ments has been significant, and is widely dis-persed regionally. Some firms have shown a capacity to grow into larger firms, but they are as yet a very small minority. Though SIP firms receive a higher rate of capital grant as a percentage of investment, the grant cost per realisedjob was considerably less than for large firms covered under the New Industry Pro-gramme. This was because more of the planned jobs were converted into actuality, and because the capital investment per worker was lower.
the environment for developing larger industry. Hence in considering overall industrial strategy, the interrelationships between different programmes must be considered.
Policy Implications
The industrial development of Ireland is far from complete, and it would be quite wrong to think it can be completed exclusively by small firm development.
On the contrary, the structure of Irish industry is such that the chief focus of industrial strategy must be the building of more large companies. There are major economies of scale in the production of many products; important innova-tions, as distinct from inveninnova-tions, generally require large resources; the export marketing capability of small firms is limited unless they can combine; and large firms are often needed to provide markets for small.
But there is no reason why this approach should not continue to be accom-panied by a complementary strategy for small firm development. Indeed there are good reasons for doing so in recognition of the potential contribution of small industry to employment creation, the development of new enterprise, regional policy, and meeting the sub-supply needs of larger enterprises. Moreover, the outlook and the instruments needed to nurture new or small enterprises require a distinctive approach from that appropriate to larger firms. As one writer (Bannock 1981) put it, "to treat small firms in the same way as large is usually, in fact, to discriminate against them."
INTR O D UC TI ON
Prior to the last decade or so, small industry received little attention in many industrialised countries. Among the major reasons for this neglect is the fact that small firms, although by far the most numerous in all Western countries, often account for a relatively small share of output and employment -- and up to the 1970s this share was declining in many countries. It was widely assumed that large-sized firms were more efficient. Moreover, with the exception of agricul-ture, the small firm sector is poorly organised as a pressure group. This in turn is largely influenced by the diversity of small firms, their spirit of independence, and their limited management resources which are often too busy for pressure group activity. Also such pressure groups as do exist are biased to the extent that they cover only those already established rather than potential entrants.
In recent years, however, there is much more interest in small industry, not only in newly-industrialising countries, but in the developed countries as well. To some extent, the theme "small is beautiful" originated as a reaction to the growing concentration of power in centralised government and in large indus-trial conglomerates. Quite apart from the social concerns voiced about such de-velopments, there were fears about possible adverse effects on the pace of innova-tions arising from the ever increasing bureaucracy in both the public and private sectors. Confirmation of these views has been claimed from the fact that in recent years some of the largest firms in traditional industries in the developed countries (e. g., shipbuilding, steel, textiles and automobiles) have been in decline, whereas many of the "high technology" activities have emerged from much smaller new enterprises. More generally, the intractable combination of unemployment and inflation that has persisted since the early 1970s, has convinced some observers that new industrial structures need to be developed, in which smaller-scale, more participative, industrial units would figure more prominently.
In underdeveloped countries, the relatively greater interest in small industry is substantially focused on the need to secure economic development. The en-couragement of new local industrial enterprise, which is in scarce supply (Storey 1982) is seen as an important step on the way to development, and such enter-prise must usually begin on a small scale. Ireland also, despite its comparatively
high level of income per capita, exhibits significant features ofunderdevelopment, including a poor response from indigenous manufacturing enterprise. With in-creased international competition for a diminished flow of foreign enterprise, the need to develop such indigenous enterprise, together with pressing jobs require-ments, have attracted greater attention to the potentialities of small industry in Ireland.
Unfortunately, despite the generally increasing interest in small industry, the subject remains, as the Bolton Report (1971, xv) puts it, "little researched and poorly documented". An undue proportion of the growing international litera-ture on the topic tends to be uncritically promoti6nal, abounding in phrases such as "small acorns into large oaks grow". In this study we try to make a realistic assessment of the strengths and weaknesses of small manufacturing industry, with a view to providing a more informed basis for policy measures.
In this introductory chapter, we first discuss the definitional and measure-ment problems that arise, and then outline in greater detail what will be covered in the rest of the study.
1 Definitional and Measurement Problems The Unit of Observation
When we speak of small manufacturing industry, the question immediately arises as to what is the appropriate unit of observation. Although several possible units of observation could be used, the literature on the size distribution of
indus-try generally concentrates on two -- the establishment and thefirm. The establish-ment is the unit of production of a homogeneous activity; while the firm is the unit of common ownership or control of one or more establishments, and is often
taken as synonymous with the term enterprise.
These definitions may be clear in principle, but a number of difficulties arise in translating them into practice. Consider first the case of the establishment. What if two homogeneous activities are carried out at different places, or two disparate activities at the one place? The general practice of the Irish Central
Statistics Office (CSO) in such cases is as follows:
Where two or more factories owned by the same enterprise, are engaged in the same type of production activity each is considered to be a separate es-tablishment if they have separate locations. Where two or more distinct industries are carried on at the same location by the same enterprise each distinct industry is considered to be a separate establishment (CSO, 1973, p. 2).
straightforward matter -- but also on the classification of industry -- a rather more arbitrary matter. Thus, for example, in the Census of Industrial Produc-tion (CIP) industry "manufacture of paper and paper products", a factory pro-ducing paper, cardboard boxes, packing products, stationery and wallcoverings would be classed as one establishment. If a finer industrial classification were used, however, each of these activities would constitute a separate industry, and adherence to the requirement outlined above would involve the identification of five seperate establishments in the one factory. In fact, the position is even more arbitrary than this since the application of the requirement is, as the CSO put it, "in practice determined by the existence of separate records or the possibility of making separate estimates" (CSO 1973, p. 2). It is important to bear these points in mind in any analysis of the data. This is especially so in international compari-sons, since even if the different countries all used the identical concept of estab-lishment, lack of comparability may still arise because of the way the concept is applied in practice.
Difficulties also arise with the concepts of the firm or enterprise. A Census of Industrial Enterprises has been undertaken by the CSO in each year since 1975 in response to EEC directives. An enterprise is defined as the smallest legally autonomous unit, so that in a group comprised of a number of companies, each individual company is generally treated as a separate enterprise. Thus if the term "firm" is used to denote the totality of activity in common ownership or control, it is not synonymous with this concept of "enterprise", since several enterprises could be part of a single firm. Comparison on the basis of such data, therefore, can be affected by changes in legal practice over time or across coun-tries. In addition, there are difficulties in relating either enterprise or firm data to particular industrial sectors. In the CSO enterprise census, only enterprises wholly or mainly engaged in industrial activity are included, so that industrial activity undertaken by enterprises not classified as industrial is excluded. Con-versely, many industrial enterprises are engaged to some degree in non-industrial activity, which is included.
Which is the more appropriate unit of observation in a study of small manu-facturing industry? The answer depends on the nature of the particular enquiry. Take, for example, economies of scale. If we are considering economies of scale in production alone, the establishment would generally be the most appropriate unit. When considering economies of scale in purchasing, marketing, finance and technology, however, the most relevant scale unit may be related not to the size of the establishment or even to the size of the firm in a given industry, but to the overall scale of the firm in all activities -- a factor that greatly complicates such analyses, since the very large firms may be involved in many activities in many countries.
firms. Unfortunately, reliable and comparable data classified by firm size are even rarer for small industry than data by establishment size. The CSO Census of Industrial Enterprises covers only those with 20 or more employees, which rules out much of the data in which we are interested. Consequently we are forced to rely mainly on establishment data. The position is not as damaging to our enquiry as might seem, however. For the vast majority of the units we will be examining in the study of small industry per se, the firm and the establishment come to the same thing. Usually, as Pryor (1972, p. 563) noted, "Establishments in multi-establishment enterprises are larger than establishments which are enterprises in themselves; further, the larger the enterprise, the larger the ditTerent establishments composing it." Table 1.1, which is based on UK data for 1980, confirms that picture. It suggests that few enterprises with less than 100 employees have more than one establishment and that the average size of establishment is an increasing function of enterprise size.
Table 1.1: Relation between enterprises and establishments in UK manufacturing, 1980
Enterprise size Average no. of Average
(in terms of Number of establishments employment per numbers engaged) enterprises per enterprise establishment
Less than 100 84,944 1.05 13
100- 199 2,437 1.50 93
200- 499 1,479 2.11 146
500- 999 599 3.82 183
1,000- 4,999 548 8.39 244
5,000- 9,999 79 24.84 281
10,000-19,999 48 33.36 418
20,000-49,999 21 58.38 553
50,000 and over 8 102.00 884
Total 90,163 1.20 56
Source: Department of Industry, Business Monitor: Report on Census of Pivduction 1980, Summary Tables; PA 1002, Tablc 12, p. 234.
The Size Denominator
The Bolton Report (1971) took the view that the unique and common char-acteristic of small firms is that they are managed by the people who own them. This is certainly an interesting and useful way of segregating firms for various forms of analysis, but as a general denominator of size it would give rise to certain anomalies. For example, a firm owned and managed by one family might employ over 500 workers, whereas a public limited liability company with many shareholders and professional management might employ less than 200 workers. For some purposes, it might be more appropriate to regard the former as "large" and the latter as "small". There is also the problem of how to treat a workers’ co-operative which may range from a small number of employees to a considerable number. Furthermore, there are major problems in getting the necessary data on ownership and control, so much so that in its quantitative analysis, the Bolton Report itself was forced to fall back on denominating firms as large and small in relation to their employment.
In fact, employment is by far the most commonly used size denominator in official statistics. It has many advantages. It is readily understood by the layman, and indeed accords with the way he would instinctively measure the size of firms. Although labour might be viewed as just another input into production, it is usually a substantial input, and one involving immense social significance. It is comparatively easy to collect data on numbers employed, and to compare these data over time and between countries. It becomes possible to define and measure gradations of size, whereas a conceptual denominator like that proposed by Bolton may have only a single cut-off distinguishing large from small.
Nevertheless, there are analytical difficulties attached to using the crude num-bers employed as the size denominator. Although all men (and women) may be equal under God, in economic terms labour is by no means homogeneous. To classify as the same size two establishments, each with 100 workers, could give rise to obvious anomalies where one consisted largely of highly-skilled tech-nologists, while the other consisted mainly of juveniles and unskilled workers. Moreover, labour as an input can be substituted for by other ti~ctors of produc-tion, and the degree of substitution will depend partly on relative factor prices which vary over time and between countries. Thus, the scale (in terms of other important variables such as output or capital employed) of a textile firm em-ploying 100 workers today may be vastly different from one emem-ploying the same number fifty years ago. With the general secular tendency for labour pro-ductivity to rise, the use of labour, compared with either output or capital, as the size denominator, underestimates the rise in average size of establishments over time.
conceptual and practical problems attached to measuring capital employed~ are vastly greater than in the case of labour.
In principle, the value of output would seem an ideal denominator since it may be viewed as the sum of the volume of inputs used, weighted by their explicit or implicit rates of return. Two possible measures of output suggest themselves, gross output and net output, the latter being a rough proxy for value added. Gross
output is the selling value of production (adjusted for changes in stocks), and corresponds to what is commonly called turnover. A major problem about this measure, however, is that only a proportion of the value of turnover is produced within the firm itself- the rest being materials and services purchased from other firms -- and this proportion is highly variable between industries, and even between firms in the same industry. Thus, a firm may be relatively large in terms of turnover but small in terms of most other key indicators of scale, such as value added, employment and fixed capital. Turnover may be important for some purposes -- as a determinant of the amount of working capital, for instance -- but unless the structure of production is broadly similar between firms, it cannot be regarded as a good general denominator of scale.
Value added is free from the objection mentioned in the previous paragraph, and since it represents the value of the firm’s own activity, and is’the fruit of all the factors it owns or controls, it would appear to be the most useful general denominator of size. There are some difficulties, however, which make it less satisfactory in practice than in principle. A firm’s value added may be less stable as a denominator of size than other measures such as employment or turnover. That is because value added consists of wages and profits, and the latter may be either positive or negative in a particular year. Furthermore, for many coun-tries, including Ireland, value added data are not generally available for all firms. Instead what is usually available is net output, which is the difference be-tween the value of gross output and materials purchased; thus net output in-cludes not only value added but also purchases of services such as printing, advertising, accounting and legal fees, etc.
Whether gross output or value added is used as the size denominator, there are difficulties in making comparisons between countries, or over time in the same country, because of changing prices. Often the only method available for con-verting the value figures for different countries to a common base is the foreign exchange rate, which is well known to be subject to serious limitations for this purpose. Over time within a country, there are general and relative price changes, and it is difficult to find suitable deflators at firm level to convert the data for different years to a constant price basis.
nator of size. In principle, this need not be a problem in multivariate analysis since different size variables can be used and attempts made to determine their separate effects if any. In practice, however, the different size variables, while not perfectly correlated, may be correlated to such an extent that it is impossible to distinguish their separate effects - the problem of multicollinearity. For the purpose of policy administration, it is generally not practicable to work with a whole range of size denominators, and simple and somewhat arbitrary denomi-nators must be employed. In practice also, data on the desired size variables may simply not exist, and we must make do with what is available. Employment data are the’ most generally available, and that reason alone largely explains why em-ployment is the most commonly-used size denominator.
The Dividing Line between Small and Large Manufacturing Industry
Assuming that size is denominated in terms of employment, the question re-mains as to where to place the dividing line between small and large manufactur-ing firms or establishments. Practice differs between countries, and even among different agencies within the same country. In Ireland the Industrial Development Authority (IDA) defines "small" as relating to establishments with up to 50 persons engaged, though there is an additional limit in terms of the amount of fixed asset in-vestment (£500,000 in 1983). The Small Firms Association -- a group established within the Confederation of Irish Industry (CII) to represent the interests of small firms -- caters for firms employing up to 100 persons. In the UK, the Bolton Report (1971 ) measured as small those manufacturing firms or establishments with less than 200 persons engaged. The legal definition of small firms in Japanese manufacturing relates to those employing up to 300 persons (Bannock, 1976). In Austria, Belgium, France, Sweden and Switzerland, small firms are usually taken to mean those with less than 50 employees, while Germany and Itally normally include firms with up to 100 employees in that category (OECD, 1971a). In the US, the Small Business Administration (SBA) varies its definition for different pur-poses. For example, in determining access to SBA loans, the general upper limit applying in manufacturing is 250 employees, but in some industries the limit can go as high as 1,000, or even up to 1,500. In developing countries the dividingline is closer to that used by the IDA in Ireland, and certainly firms with more than 100 employees are not normally classified as small. The different concepts of small partly depend, of course, on the differences in industrial structure between coun-tries. If Ireland were to classify as small all manufacturing establishments with less than 200 persons engaged, this would cover about half of total manufacturing em-ployment, whereas in the UK it would cover only about one-quarter.
accord with IDA practice in h’eland, we shall generally reserve the term "small" for establishments or firms with less than 50 persons engaged. We shall also be interested, however, in other ranges of size, though in many tables in order to simplify the, presentation,
labelled as follows:
(1) Small
(2) Small-medium (3) Medium-large (4) Large
we shall compress the ranges into four categories, Persons Engaged
Less than 50 50-199 200-499 500 and over
It will be clear fi’om the foregoing discussion that whereas only category (1) is treated as small here, in some of the developed countries category (2), and even category (3), would also be treated as small.
Data Problems in Relation to Small Industry
The data in relation to small manufacturing industry, particularly the very small firms, often leave much to be desSred. Part of the problem is that there are so many very small firms, consisting of only one or a few people, that these firms are sometimes hard to locate, and that they often have difficulty in giving satis-factory statistical returns. For this reason, many countries adopt a cut-off point and exclude the very small firms from their industrial inquiries. The Irish Cen-tral Statistics Office, for instance, does not normally attempt to cover establish-ments with less than three persons engaged. It is clear, however, that some such establishments have entered the Census of Industrial Production (CIP), since the average employment in the establishments with less than five persons engaged was 2.83 in 1968 and 2.97 in 1975. Moreover, a significant number of small es-tablishments with three or more persons engaged were not covered in practice in the CIP until 1979, when the coverage was significantly improved. Other coun-tries may adopt a higher cut-off point, and some may adopt no cut-offpoint at all, so that cross country comparisons can be very difficult if not outright imposs-ible in some cases. The comparisons are affected more in relation to establish-ment numbers than employestablish-ment (or output, or capital). For example, in Ireland, in 1975, establishments recorded in the CIP with less than five persons amounted to 10.6 per cent of all establishments but only 0.5 per cent of CIP manufacturing employment. If in reality the true number of establishments with less than five persons engaged were, say, four times the recorded number, then such establishments as a proportion of all establishments would rise to 32.2 per cent, but their employment share would only rise to 1.6 per cent (assuming that the average employment per unrecorded establishment was two persons).
economic activities, a problem which is often difficult in the case of small firms and on which practice differs between countries. For example, in Germany, repair work or craft-work carried out in retail establishments (such as baking, sausage-making, upholstery, silversmiths, shoe repairs etc.)is included in manu-facturing, whereas in Ireland or the UK these would generally be included in the distribution sector or other service trades. An indication of the scale of the in-comparabilities that can arise is given in the Bolton Report (1971), where in order to try to render the German data comparable with UK data, Handwerk activities were excluded from the German data. This involved reducing the re-corded number of German manufacturing establishments by 331,000 -- more than 31/2 times the total recorded number of UK manufacturing establishments[ Another way of illustrating the difference, is that although the number of manu-facturing establishments with 10 or more persons engaged is broadly similar in the two countries, the recorded number of manufacturing establishments smaller than this is ten times greater in Germany than in the UK. Although this enormous difference is partly a genuine indication of the greater prevalence of the manufacturing crafts in Germany, it is also due to different ways of classifying the same data.
As we shall see, there are other problems affecting the comparability of data on small manufacturing industry for different countries or different periods. Enough has been said, however, to show that caution must be exercised in com-paring different data sets, particularly when they relate to different countries.
2 Outline of Study
small manufacturing industry, as a background to considering the approach in Ireland.
Part II of the study is devoted to an investigation of the IDA Small Industry Programme (SIP) which has been in operation since 1967. Chapter 7 describes the scheme in the context of general industrial development policy in Ireland as it relates to small firms. Chapter 8 examines the contribution of the SIP in terms of employment. Chapter 9 looks at the cost of the programme in terms of grants, and gives details of the amount of investment, the degree of capital intensity and the grant cost per
job.
Where possible, performance is assessed in comparison with the rest of industry and with other IDA programmes.THE EXTENT OF SMALL MANUFACTURING INDUSTRY IN IRELAND AND ABROAD
In th~s chapter we examine the data for Ireland on the extent of small manu-facturing industry relative to total manumanu-facturing industry, and how it has changed over time. We compare the position in Ireland with a range of other countries for which data are available.
1 The Size Structure of Irish Manufacturing Industry
Two principal data sources are used to analyse the size structure of Irish manufacturing industry: CSO data from the Census of Industrial Productionz and the IDA data from their Annual Employment Survey. A Census of Indus-trial Production is carried out each year, and an analysis of these data by size is published at intervals, the latest data relating to 1980. The IDA Annual Em-ployment Survey started in 1973. Unfortunately, the two sets of data differ in im-portant respects, and in particular the CSO data were less complete in relation to very small establishments prior to the extension of coverage in the 1979 CIP. Since the two sets of data cannot readily combined, we discuss them separately.
The Size Structure Based on CSO Data
The Annual Census of Industrial Production attempts to cover all manu-facturing establishments except those with less than three persons engaged. Yet total manufacturing employment recorded in the CIP is significantly less than in the Census of Population, which is generally regarded as giving the most com-plete picture. In 1971, for instance, CIP manufacturing employment was 196.3 ’~The CSO Census of Industrial Enterprises is also available since 1975. Unfortunately, the data exclude all enteI~prlses with less than 20 persons engaged, so that they are of limited use in a study of small industry as defined here.
thousand as against 213.6 thousand in the Census of Population.3 This disparity was not due solely to the exclusion in the CIP of firms with less than three persons engaged. This is now confirmed by the extension of coverage in the 1979 CIP following the increased use by the CSO of administrative and public utility re-cords, the employment of field officers, and the inclusion of estimates for lishments on the basis of limited information.4 As a result, the number of estab-lishments engaged in manufacturing in 1979 was increased by 683 (to ,4,588) compared with the former coverage, while total manufacturing employment was raised by 10,000 to 228,000.5 The vast majority of the additional establish-ments were small, with nearly three-fifths having less than 10 persons engaged
(cso, 1984).
A further point to be borne in mind is that the disparity between the CIP total for manufacturing employment and that in the Census of Population has narrowed over time -- even before the large, explicit increase in coverage in 1979. In 1946, for example, the gap was 37 thousand (33.6 per cent of the CtP total), as against 17 thousand in 1971 (8.8 per cent). In part, this may reflect a genuine decline in the relative and absolute importance of one-person or two-person concerns. But it may also reflect improvement in the coverage of firms in-cluded in the CIP. Hence, the trends over time in relation to small industry as re-vealed in the CIP must be interpreted with a degree of caution throughout, and since 1979 they cannot validly be compared at all with the figures for earlier years.
Table 2.1 summarises the data on the number of establishments in various size classes in Irish manufacturing industry in the CIP for various years from 1929 to 1980, the former being the first year, and the latter the latest year, for which these data are available. Size is measured in terms of total persons employed. The total number of establishments in CIP manufacturing was 50 per cent higher in 1975 than in 1929. The big increase came in the period 1931-38, when extensive trade protectionist measures were adopted with a view to developing Irish manufacturing. Part of the increase during the 1930s, however, may reflect 3It is true that outside piece-workers, numbering about 4,500 in 1971, are not included in the CIP total but probably appear in the Census of Population. This factor was more than offset, however, by the understatement of t~male employment in the Census of Population. (On this, see Walsh (1971 ), Appendix 1, pp. 111-113). Thus, the Census of Population itself did not give the full total of manufacturing employment, so that the extent of understatement of manufacturing employment in the CIP is greater than the above figures would suggest.
4Furthermore, two other activities, poultry processing and photographic laboratories, have been added which were formerly not included in the CIP.
Establishment size 1980
(in terms of (extended
numbers engaged) 1929 1931 1936 1938 1946 1958 1963 1968 1973 1975 coverage)
<20 1,546 1,558 1,999 2,135 1,769 1,808 1,649 1,512 1,508 1,693 2,878
20-. 49 366 388 563 581 607 703 717 793 792 771 962
Total <50 1,919 1,946 2,562 2,716 2,376 2,511 2,366 2,305 2,300 2,464 3,840
© >.
z ©
50- 99 141 145 220 215 237 291 336 353 411 411 475
100-199 147 161 199 223 234 250 301
122 114 190 210
200-499 83 112 131 142 176 143 149
500+ 11 9 19 15 21 31 45 51 59 52 55
Non-attributable ... 71
©
Total 2,186 2,214 2,991 3,156 2,864 3,106 3,077 3,074 3,180 3,320 4,891 ,<
aAs explained in the text, the data for 1980 are based on an extended coverage and include several hundred small establishments not previously recorded. They cannot, therefore, be compared with the data for earlier years.
[image:30.673.75.582.122.327.2]no more than an improvement in the coverage of the CIP, particularly in the case of the smaller establishments (Farley, 1975); but there is no doubt that there was also a major influx of new establishments in this period. During the war, there was a decline in the number of establishments to a low point of 2,800 in 1942, but there was a rapid increase in the immediate post-war years to a peak of 3,359 in 1952.6 Subsequently, the numbers declined to 3,074 in 1968, but re-covered again to 3,320 in 1975.
If we choose 50 persons engaged as the dividing line between small and large establishments, then the vast bulk of Irish establishments must be classified as small. In 1975, establishments with less than 50 persons engaged accounted for nearly three-quarters of all establishments.7 This proportion is considerably lower than in 1929, however, when such establishments constituted 87~ per cent of all establishments. Even in absolute terms, the number of such establishments was declining from 1958 to 1973. This decline, however, was concentrated in the very small establishments with less than 20 persons engaged, the numbers of which fell in most years from 1938 to 1968. Moreover, within the category of less than 20 employees, the numbers of those with less than 10 employees fell much more than those with 10-19 employees. From 1973 to 1975, however, there seems to have been a reversal of the decline in numbers of small establishments. In part, this might reflect the fact that total employment declined in this period, pushing more establishments into the lower size category. As we shall see from the IDA data, however, the change may be more significant than this.
While small establishments dominate numerically, their importance in total employment is quite different, as may be seen from Table 2.2. Establishments with less than 50 persons engaged, amounting to three-quarters of all establish-ments, accounted for only one-fifth of total employment in 1975. Moreover, since we shall see later in Chapter 4 their level of productivity is below average, their share in output would be lower still. At the top end of the size range, estab-lishments with 500 or more persons engaged accounted for a broadly similar share of total employment, although they represented less than two per cent of establishments numbers.
The relative importance of small establishments in terms of employment has changed considerably over time. In 1929, those with less than 50 persons engaged accounted for 34 per cent of manufacturing employment, but since then their share has declined. The decline has been greatest in the case of those with less than 20 employees, though there was a slight reversal of this trend be-tween 1968 and 1975. The employment share of those with 20-49 employees rose slightly in the era of intensive protection in the 1930s, but subsequently has ~The data for 1942 and 1952 are not shown in the table since only an aggregate figure is available.
> 1980
u" extended .~ 1929 1938 1946 1958 1963 1968 1975 coveragea
Establishment size
(in terms of No. % of .,Vo. % of No. % of No.’ % of .A~. % of No. % of No. % of .,Vo.% of numbers engaged) ’000 Total ’000 Total ’000 Total ’000 Total ’000 Total ’000 Total ’000 Total ’000 Total~,7
>
<20 11.3 17.1 15.4 15.4 14.1 12.8 15.0 10.6 14.2 8.4 13.1 7.1 15.5 7.9 26.0 11.5 .Z 20- 49 11.0 16.6 17.4 17.4 18.4 16.7 22.5 15.9 22.7 13.5 25.1 13.6 24.3 12.5 30.3 13.4
© Total 22.2 33.6 32.8 32.7 32.5 29.5 37.5 26.4 36.8 21.9 38.2 20.8 39.8 20.4 56.4 24.9
50- 99 9.0 13.7 13.8 13.8 15.2 13.8 20.6 14.5 23.1 13.7 24.6 13.4 29.0 14.9 33.3 14.7 15.3 27.7 16.5 31.9 17.3 34.8 17.9 42.2 18.6 100-199 19.5 17.7 21.7
23.0 34.8 39.6 39.5
200-499 23.9 21.7 32.4 22.8 38.8 23.1 42.1 22.9 43.1 22.1 44.6 19.7 500+ 11.8 17.9 14.2 14.2 18.9 17.2 29.6 20.9 41.8 24.9 47.2 25.7 48.1 24.7 48.6 21.4 Non-attributable ... 1.7 0.7 Total 66.1 100 100.2 100 110.0 100 141.8 100 168.2 100 183.9 100 194.8 100 226.8 100
aSee note to Table 2.1.
Source: Census of Industrial Production, for 1958, 1963, 1968, 1975 and 1980. The tigures for 1938 and 1946 are taken from Linehan (1962). The
[image:32.673.81.585.102.324.2]trended downwards. The employment share of establishments in the size ranges from 50 to 500 employees, which account for more than half of total manufactur-ing employment, has been remarkably stable since 1938. Thus the chief long-term change has been the gain in the share of establishments with more than 500 employees at the expense of those with less than 50 employees, though there is a hint of a decline in the share of the large establishments since 1968. Although the employment share of establishments with less than 50 employees has fallen sub-stantially, the absolute numbers of workers was over 80 per cent greater in 1975 than in 1929. The big increase in numbers, however, came in the 1930s and after the Second World War, and from 1958 there was only a slight rise.
It does not necessarily follow from these data, of course, that larger ments were growing more rapidly than smaller establishments. The establish-ments that appear in one size group in any year are not necessarily those that appear in the same size group at a later year. Some will have grown to a larger size range, some will have declined, some will have gone out of business alto-gether, and some new establishments will have entered. What can be said is that the outcome of these forces resulted in a strong tendency towards an increasing concentration of employment in larger establishments -- at least up to the end of the nineteen sixties.
The Size Structure Based on IDA Data
The IDA have conducted an annual survey of employment in manufacturing at the beginning of each year since 1973. A small number of service-type estab-lishments are included in the survey, but these can be identified and excluded, as is done here. The survey aims to cover all manufacturing establishments, and the industrial classification used is the same as that used by the CSO. The IDA admit, however, that their coverage of smaller establishments in the Dublin area may not be complete, because of the difficulty in identifying all such establish-ments in a large urbanised area. Prior to 1979, the data for such establishestablish-ments was based on a sample survey, which was later considered to be defective. In 1979 complete census coverage was extended to Dublin, and estimates of em-ployment were made for earlier years for those firms still surviving. Data were generally not available, however, in respect of firms not previously in the survey and which had closed by 1979. Accordingly there is probably some degree of overstatement in the trend of employment increase for small firms shown by these data.a
Total manufacturing employment recorded in the IDA survey in 1980
amounted to 240,500. This total is very close to the estimate of 243,000 for April 1980 on the Census of Population basis given in the Economic Review and Outlook, Summer 1983. The concordance between the IDA figures and the estimates on a Census of Population basis also seems to hold for changes between 1973 and 1980. The IDA data show a rise from 217,600 in 1973 to 242,500 in 1980, while the population-based data show a rise in the same period from 220,000 to 243,000.9 These increases are higher, however, than the CIP rise over the nearest similar dates available, estimated on the basis of the 1979 extended coverage, from 212.6 in the March quarter 1973 to 231.6 in the December quarter 1979. Table 2.3 sets out the size distribution of Irish manufacturing industry based on IDA data for the years 1973 and 1980. If we first compare the 1980 IDA data
with the CIP data for 1980 on the basis of the extended coverage, given in Table 2.1, it emerges that there were 637 more establishments in the former. The major difference was concentrated, however, in establishments with less than five per-sons engaged, where there were 820 more establishments in the IDA survey than in the CIP. No doubt, the bulk of these would have less than three persons engaged, which are deliberately not covered in the CIP. The IDA data in this re-gard are not comprehensive either, but small establishments (with less than 50 per’sons engaged) accounted tbr a rather higher proportion of the total number of establishments in the IDA survey as compared with the CIP -- 80.5 per cent as against 78.5 per cent. In terms of employment, however, the distributions are not all that different. In the IDA 1980 survey, the small establishments account-ed tbr 23.7 per cent of employment as comparaccount-ed with 24.9 per cent in the 1980 CIP. In the other size classes the employment shares are also very similar in the two data sets.
Looking at the changes in structure over the period 1973-80, as shown by the IDA data, the most significant change relates to the large establishment class, with 500 or more persons engaged, where employment fell both absolutely and as a percentage of the total. This decline may reflect forces special to the 1970s rather than a long-term trend. These forces include the impact of free trade on the older Irish import-substituting industries, the world depression following the oil crisis of late 1973, and factors peculiar to particular firms such as the closure of the Ferenka plant, employing about 1,500 persons, in late 1977.
As regards small industry (with less than 50 persons engaged) the data suggest some upsurge in the absolute number of such establishments, though their relative numbers continued to fall slightly. Employment in small establishments rose by 13.2 per cent from 1973 to 1980, somewhat greater than the overall rise of
1973 1980
Establishment size Establishments Employment Establishments Employment % change in
(in terms of % of ,No. % of % of No. % of employment
numbers engaged) ,No. Total (’000) Total No. Total (’000) Total 1973-80
X
Small (<50)
<5 1,241 25.7 3.0 1.4 1,438 26.0 3.3 1.4 11.7
5- 9 819 17.0 5.6 2.6 951 17.2 6.5 2.7 15.8
10-14 544 11.3 6.4 2.9 575 10.4 6.8 2.8 6.1
15-19 336 7.0 5.6 2.6 377 6.8 6.3 2.6 12.8
20-29 476 9.9 11.5 5.3 542 9.8 13.0 5.3 12.7
30-49 497 10.3 18.7 8.6 568 10.3 21.6 8.9 15.5
Z O
Total Small 3,913 81.0 50.7 23.3 4,451 80.5 57.4 23.7 13.2
Small-medium (50-199)
50- 99 411 8.5 28.9 13.3 498 9.0 34.9 14.4 20.8
100-199 275 5.7 37.4 17.2 338 6.1 46.7 19.3 25.0
Total small-medium 686 14.2 66.2 30.4 836 15.1 81.6 33.7 23.2
Medium-large (200-499) 170 3.5 51.1 23.5 180 3.3 54.0 22.2 5.6
Large (500+) 60 1.2 49.7 22.8 61 1.1 49.5 20.4 -0.3
4,829 100 217.6 100 5,528 100 242.5 100 11.4
UZ
Source: IDA Annual Employment Survey. Data relate to 1 January in the year concerned. As explained in the text, there may be some
[image:35.673.67.589.79.395.2]ll.4 per cent.l°’ll The chief gain in employment in this period was in the small-medium size range (50-199 persons), where employment rose by 23.2 per cent.
2 Comparison with Other Countries
The difficulties of making international comparisons regarding the relative importance of small industry are notorious, and the main problems have been outlined in Chapter 1. For the reasons given there, the problems are particularly acute as regards the numbers of firms or establishments. It is safe to say, however, that no matter which data classification is used, in all countries the great majority of establishments fall into the category of small -- on any reasonable definition of small. But, precisely, because there are so many small establish-ments in every country, differences in definition and coverage can seriously allkct comparisons bf the size structure of industry across countries based on numbers of establishments. Because the establishments that give rise to compar-ability problems, however, usually have low employment, international com-parisons of the size structure based on employment are less seriously affected by . the differences in definition and coverage.
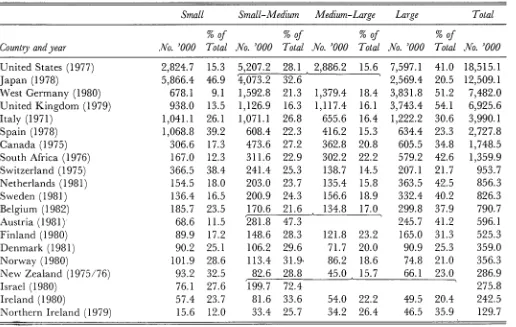
Table 2.4 gives data for a range of countries for the most recent available year on manuthcturing employment divided into the four size classes of establish-ments specified in Chapter 1: small (1-49 persons engaged), small-medium (50-199); medium-large (200-499) and large (500+). The proportion of total manulhcturing employment accounted for by small establishments varies con-siderably across countries fi’om as low as nine per cent in West Germany,1~ to as high as 47 per cent in Japan due largely to the high degree of sub-contracting arrangements in that country. Ireland with 24 per cent comes about mid-way in the range, but, nevertheless, has a considerably lower share than some of the
I°As explained earlier, there may be some overstatement in the rise in total employment, and more particularly in small industry employment, due to deficiencies in the Dublin data tbr small [irms in
1973. Excluding Dublin, however, the increases tbr the rest of the country, lbr which the data are considered to be complete, were 17.6 per cent tbr small industry as against 23.0 per cent for all manufacturing. Both these figures are higher than lbr the country as a whole, since the tigures show a rise in employment in Dublin of only 4.2 per cent in small indnstry and a fall of 7.2 per cent in all manulimmring. If as suggested by O’Farrell (1984a) the Dublin 1973 level of employment in small industry is understated, then the Dublin experience ti’om 1973-80 would be even much worse than these Hgures show.
HThe CIP data on the basis of the extended coverage available tbr 1979 and 1980 also suggest a relatively greater rise in employment in small industry, which rose between these two years by 5.8 per cent whereas overall manufacturing employment fell by 0.6 per cent.
other developed small economies like Switzerland (38 per cent), New Zealand (321/2 per cent) and Norway (29 per cent). In developing countries the small industry share would be even higher. For instance, the data in Economic Com-mission for Latin America (1981), which relate to the ’sixties and early ’seventies, show that more than half of manufacturing employment in several Latin American countries was in establishments with less than 50 persons engaged.
There are theoretical arguments and some empirical evidence supporting the view that establishment size differences between countries are strongly and posi-tively intluenced I)y the size of the domestic market (Pryor, 1972). The data in Table 2.4, however, give the impression that Ireland, though having a very small domestie market, does not have a particularly large concentration of em-ployment in small manufacturing industry. This impression is confirmed by the data in Table 2.5 which gives details of the average size of manufacturing estab-lishments lbr the countries listed in Table 2.4. Because of the serious incompar-abilities that arise in the case of the very small establishments, the averages are calculated, first excluding all establishments with less than 10 persons engaged, and then exclnding those with less than 20 persons engaged.
Small Small-Medium Medium-Large Large Total
%of %of %of %of
Country andyear ./Vo. "000 Total .No. ’000 Total No. ’000 Total No. ’000 Total No. ’000
¢3
United States (1977) 2,824.7 15.3 5,207.2 28.1 ~ 2,886.2 15.6 7,597.1 41.0 18,515.1
Japan (1978) 5,866.4 46.9 ~,073.2 32.6 ’ 2,569.4 20.5 12,509.1
West Germany (1980) 678.1 9.1 1,592.8 21.3 1,379.4 18.4 3,831.8 51.2 7,482.0 United Kingdom (1979) 938.0 13.5 1,126.9 16.3 1,117.4 16.1 3,743.4 54.1 6,925.6
Italy (1971) 1,041.1 26.1 1,071.1 26.8 655.6 16.4 1,222.2 30.6 3,990.1
Spain (1978) 1,068.8 39.2 608.4 22.3 416.2 15.3 634.4 23.3 2,727.8
Canada (1975) 306.6 17.3 473.6 27.2 362.8 20.8 605.5 34.8 1,748.5
South Africa (1976) 167.0 12.3 311.6 22.9 302.2 22.2 579.2 42.6 1,359.9
Switzerland (1975) 366.5 38.4 241.4 25..3 138.7 14.5 207.1 21.7 953.7
Netherlands (1981) 154.5 18.0 203.0 23.7 135.4 15.8 363.5 42.5 856.3
Sweden (1981) 136.4 16.5 200.9 24.3 156.6 18.9 332.4 40.2 826.3
Belgium (1982) 185.7 23.5 170.6 21.6 ~ 134.8 17.0 299.8 37.9 790.7
Austria (1981) 68.6 11.5 ’281.8 47.3 245.7 41.2 596.1
Finland (1980) 89.9 17.2 148.6 28.3 121.8 23.2 165.0 31.3 525.3
Denmark (1981) 90.2 25.1 106.2 29.6 71.7 20.0 90.9 25.3 359.0
Norway (1980) 101.9 28.6 113.4 31.9. 86.2 18.6 74.8 21.0 356.3
New Zealand (1975/76) 93.2 32.5 82.6 28.8 45.0 ~ 15.7 66.1 23.0 286.9
r
Israel (1980) 76.1 27.6 199.7 72.4 275.8
Ireland (1980) 57.4 23.7 81.6 33.6 54.0 22.2 49.5 20.4 242.5
Northern Ireland (1979) 15.6 12.0 33.4 25.7 34.2 26.4 46.5 35.9 129.7
)-> Z
©
©
[image:38.673.75.591.100.427.2],½’oHrces."
United States: (.en.~u.~ o/,lIanu/aclurers 1977, General Summary, Table 4. .Japan: Japan .S’lali.~lical ) ?arbook 1981, Table 61.
West Germany: );lali.~li.~c/se.~ .Tahrbuch 1982. Data relate to "betriebe".
United Kingdom: "’Report on the Census of Production 1979, Summary Tables", Business Monitor, PA 1002, Table 6.
haly: .lmmario .~’lali.~lico Ilaliano 1980, Table 157. Data relate to "unita locali" and exclude 536,131 units (1,311,800 workers) of"artigiane". Spain: Censo Industrial de Espafia 1978, Establiciemtos Industriales, Resumen Nacional. Data include mining.
Canada: .1 lanq/aclHs in., lnda.llrie.~ o J" (,’anada: Types of Organisalion and Size of Establishments, 1975. South .\li’ica: %’oHlls .l/}i~an X/alis/ics 1982.
Switzerland: S’lali~li~cbe~ ,-Jahrbuch 1982, p. 151.
Netherlands: .h’la/i.~lica/ )}’arbook of the .Vetherlands 1982, p. 186. Data cover only establishments with 10 or more persons engaged.
Sweden: In&l~lJi 1981. l’relimmara Branschdata. Data cover mostly only establishments with 5 or more persons engaged. ;> Bcl,,,ium: Rapp~rl .lnmu, I d’OI/;ce .Valiona/de S&m’it~ Sociale, Tables 15-16. Data include mining as well as manufacturing.
..\l>,Iria: ,~’lafi#i.~che.i llandbach 1982.
Finland: l}’arboo/, o.f \brdi~ Slali.~tic.~ 1982, Table 72. Data relate to establishments with five or more persons engaged. > Denmark: Industri b’g Energi 1983, Statistiske Effterretminger. Data relate to establishments with six or more persons engaged. 2~ Norway: l’embod, ~/ \brdie .h’/ali~li<.~ 1982, Table 72. Data relate to establishments with five or more persons engaged. ~> New Zealand: Census o J Manufacturing Series A, General Statistics Bulletin No. 1, 1974-75 and 1975-76.
Israel: Statistical Abstract of Israel 1982. Data include mining as well as manufacturing, but the mining component is very small.
h’eland: I I),\ . I mlual Emplo.rmeul .’~’uri’er. ,,~
Northern h’ela,ld: . lnal>e.~ (~/ l "niled Kin.galore Manu/acturing (Local) l "nits by Employment Size, Business Monitor, PA 1003, Table 3.
Table 2.5: Average size o]’establishmenls in manufacturing, various countries
Establishuwnts Fstablishnlents Establishments with 10 or mort, with 20 or more with 500 or more pe~:wns engaged persons engaged persons engaged
cz) (2) (3)
L!nited Stales (I.1177) .Japan (I 978)
West (;erma,w (1980) United Kingdmn 119791 haly 11971)
Spain (1978) Canada 11975) Soul h Aliica (1976) Swilzerland (1975) Netherhmds ( 1981 ) Sweden ( 1981 ) Belgium (1982) Austria (1981) Finlancl (1980) Dennmrk ( 198 I Norway (I 980)
New Zeahmd 11975 76~ Israel (198(I)
h’eland (1980)
Northe,’n h’eland (1979)
111 152 1,324
47 93a 1,231
n.a. 175 1,546 1411 210 1,599
58 99 1,364
56 89 1,201
97 133 1,305 123 164 1,194
58 96 1,204
93 137 1,652
1(11 147 1,298
87 131 1,321
126 156 1,328
92 126 954
67 101 1,096
65 98 947
59 90 918
80 131 n.a.
74 I00 812
122I, 154 1,329
aFigure relates to 1.1175. I’l 1+.
Sources: As tbr Table 2.4.
higher than in any other cotmtry listed. On the other hand, Ireland ranks lowest in terms of the proportion of its manulhcturing employment located in the large establishments (500÷). This point is reinforced by Column (3) of Table 2.5 which shows that the average size of large establishments in Ireland is by far the lowest of any of the countries. If we compare Japan or Switzerland, for instance, which have nearly as small a share of their employment in large establishments, the average size of their large establishments is about 50 per cent greater than in Ireland.
In sum, while h’ish manufacturing does not have a particularly high share of employment in small establishments or a particularly low overall average size of cstablishment, it also has a relatively low share of its employment in large estab-lishnaents and their average size is small. 14 More so than in most countries,
ployment is concentrated in middle-sized establishments (from 50 to 500 workers).
Changes over Time in Other Countries
The evidence on long-term trends over time in the relative extent of small industry in different countries is not at all clear-cut. Conflicting findings have emerged ti’om ditt~rent studies. These conflicts often depend on differences in the time periods or in the range of countries considered. They also depend on differ-ences in the size denominator used, in the dividing line between large and small, and on whether the basic entity considered is the enterprise or the establishment. These differences, together with the many incomparabilities that exist between countries in the coverage of the data, make it dill]cult to draw clear-cut conclusions.
As regards establishments, the International Labour Organisation (ILO) (1956) study lbr ten countries showed little change in the share of total employ-ment accounted tbr by firms with 10 to 50 employees15 in the thirty years or so up to 1950. The absolute numbers of employees rose in almost all countries, the only exceptions being" the UK and France where total manufacturing employment was static or declining’. Though there was a rise in the average size of establish-ment with ten or more employees in the US and in the UK, this tendency was not general: there was little change tbr the other countries, except Japan where there was a pronounced fall. At the top end of the size scale, however, almost all countries experienced a rise in the proportion of employees in establishments with 1,000 o1" more employees, the increases being particularly marked in the US, UK and Sweden.


![Table 2.5: Average size o]’establishmenls in manufacturing, various countries](https://thumb-us.123doks.com/thumbv2/123dok_us/8790582.909086/40.487.68.425.106.376/table-average-size-o-establishmenls-manufacturing-various-countries.webp)