\
:. I tI
STATISTICAL
PROCESS
CONTROL
SUCCESS FACTORS
AND
PERFOR]VIANCE
:
AN
EXPLORATORY
ANALYSIS
Jafri Mohd Rohani
Sha'ri
Mohd Yusof
Ismail
Mohamad
1.1
INTRODUCTION
Since
the
introduction
of
ISO/TS
16949Quality
Management Systems and the deadlineof
automotive manufacturing compnnissto switch
from
QS-9000 to ISO/TS 16949 by December, 2006, theuse
and correct application
of
quality planning
tools
such asStatistical
ProcessControl
(SPC),
Failure Mode
and
EffectAnalysis
(FI"CA)
and
Measurement SystemsAnalysis OISA)
have become
widespread.Among
all
these three
tools,
SPCspecifically
look
deeply
into
company's
own
manufacturingprocesses
for
continuous
quatity
improvement
and
reducing processvariability.
SPC wasfirst
introducedby
Shewhart backin
1930s andthe
Japanese companies have beenvery
successfulin
applyng
its
tools
and
techniquesin
solving quallty
relatedproblems such as reducing scrap, reducing customer complaints
and
reducing
process
variability.
Despite
the
successfulreported that organizations whose top management had voluntarily
implemented SPC would reap greater benefits. Reid (2005) argued
that SPC
implementationefforts
havenot
been successful and sustaining not becauseof
its qnderlying methodolory, but,wittt
itsorganization
and
deployment
effort
of
SPC
integratedimprovement
activities.
This
statementis
further
supported by Gruska andKymal
(2006)who
saidthat contibuting
causesof
unsuccessful
SPC
have nothing
to
do
with
the
underlyingmethodolory,
but with
the organizational aspect and deployment.Robinson
et.
al.
(2000) reported that many companies that used SPC arenot
satisfiedwith the
resultsof
SPC program withoutmanagement
invdliement.
SPC research can be divided into trvomajor
categories: tecbnical
and
methodological
aspects andorganizational and implementation aspects. Between the
two,
the organizational and implementation aspectof
SPCis
almost beingneglected
and
there
is
lack
of
attention
given
by
the
SPCresearchers.
Most
empirical
studieson
SPC
implementation aspectsso
far
are
focusedmainly
on
identifring
factors for
effective
implementation"which are called
"succ€ss factors"(Antony et. al.,
2000; Rungtusanathamet. al.
,
1999; Harris andYit,
1994;Donell
and Singhal, 1996; Rungtunasanathamet.
a1.,1997; Deleryd et.
al.,
1999a" Deleryd et.al.,
1999b, Runganasamy et.al.,
2002; Doeset.
al.,1997; Antony and Taner, 2003) that is, onlynying
to explore andidenti$
the factors. This is atlpical tlpe
in
exploratory study
stage,which
is
to
determinethe
"successfactors".
Relatively,
less progress hasbeen
madein
bringingexisting
theoretical research/practices togetherin
explaining therelationship empirically between success factors and performance that is called explanatory shrdy.
The
primary objective
of
this
study
is to
address thefollowing
research questions based on exploratory and explanatory type of study;(l)
To deterrrinethe
success factorsin
SPC implementation (exploratory studY);Deriving Success Factors -..
firm
performance (exploratory study) ;(3)
To propose the relationslip between success factors associated with quality and firm performance (explanatory studY)I.2
A
RE\rIEW
OF'
STATISTICAL
PROCESS CONTROL
succEss
FACT0RS
(DcLoRATORY
STTIDY)One key and often mentioned reason for lack
of
success and failed SPC implementation programis
lack
of
proper implementation. The implementation aspects are not only cover the technical sideof
SPC,
but,
it
must also focus
on
management aspectsas
well.Gordon et. al. (1994) argued that managers must be able to
identiff
the technological and management factors
tlrat
arelinked
to
the successof
a quality
improvementprogram.
Xie
and Goh (1999)identified
threemain
aspects asa holistic
approachfor
effectiveSPC initiatives:
The
managementside,
the
human side
and operational sideof SPC.
Mason and Antony (2001) identifiedfour
essential
areas
that
will
make SPC
progratn
successful:management
issues, engineering
skills,
statistical
skills
andteamwork
skills.
A
reviewof
literature revealed that most studies are focused mainly onidentiffing
factors that affect the successof
SPCprogram.
This study attempts tofill
the gap by examining therelationship between
the
implementation factors andquality
andfirm
perfonnance.
By
identiffing the significant critical
factors.that influence the quallty
andfirm
performance,this
studywill
enable
the
SPC practitionersto
focus onlimited
resourcesto
the SPC initiatives for the maximum benefits.1.2.1 Criftical Success Factors
Approach
has been
widely
adopted and usedin
a varietyof field
of
study todetermine
key
factorswhich
are essentialto
the
successof
any program or technique. In SPC study, Rungasamy et. al. (2002) wasamong
the
pioneer
to
usethe word
to
identiff
CSF
for
SPC implementation inUK
small and medium enterprises.A
brief
exploratory
studyof
SPC successfactors
by
differentstudies
is
presentedin
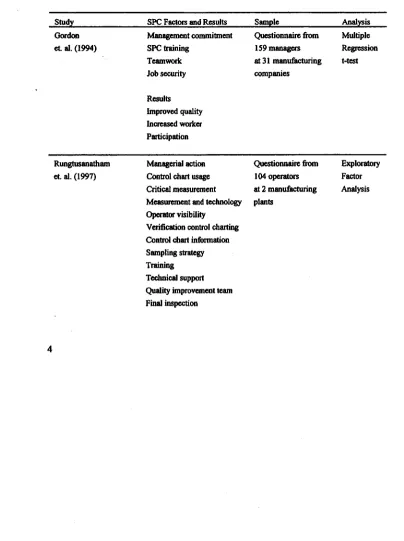
Tablel.l.
The factorsfor
other statistical basedproblem solving
methodology suchas
process capabilitystudy are also included in this study (Deleryd et. al., 1999).
Table 1.1 Exploratory study of SPC factors and results
SPC Factors and
Rcsults
Samolcfuon
ct al. (1994)Manrgcmeot commitmcnt SPC training
Tcamwork Job sccurity
Rcsnlb
Improvcd quality Inoreascd workcr Partioipation
Qrcstionnairc
from
MuttiplcI59managcrs
Rcgressionat 3l manufacturing t-t6t
companics
Rungh$anatham
€t 8t. (1997)
Managcrial rctiolr
Conhol chart usage Criticol mcasuremont Mcasurcnrcnt urd tcchnolory
OpcrAorvisibility
Vcdf cation conuol charting
Contol chart informdion
Sampling sratcgy Training Tccbnical support
Qurlity improvcorcot tcrrl|
Final inspcc'tion
Qncstionnairc
fiom
ExploratoryI04opcfalon
Factorat 2 manufrcturing Analysis
[image:4.593.82.486.257.798.2]Deriving Success Factors ...
Proccss knowledgc
Audit
Results
lmpoved quality
Rcduccd costs
Xc and
coh(199)
Managenrent oommitnent
Continuous improvcrnent
Training
Tearnrorking
Rcsisturce to changc
Inccntive SPC tools
Prcblem sotvingproccss
Prioritizing proccss
Corrcctivc action Rcsults Improved quality
None
Dcleryd er. d. (1999) Process Capability Study
lvluagancnt suppott
Kickofr
Educational
Stucturcd Approach Continuous support C;ommunication Rcsults Hard Aspccts
Improvcd capability
Derftotion rates Improvcd delivcry
Soft Aspccts
Improvcd working
Environncnt
Bcttcr producb
Fcw problcrns
Casc shrdy of9
9 Srryedish
companics
Antony
ct. d. (2000)
Managcrncnt commitncnt
Training Tcamwor*
Proccss prioritizdion
Sclcction proccss variablc Dcfinc mcasurcmcnt systcms Contnol charb
Cultural change Pilot study
Use of computcr rnd softwarc Rcsults
Undcntanding proccss Rcduction ofooats
Bcttcr communication
Improved cqability
Manufbcturing
and scrvice
None
Rungasamy ct. d. (2002)
Managerncnt commitmcnt Tcamwork
Idcntifi cation cridcal quali9
Contnol charts
Updatc proccss knowledgc
lvlcasurcencnt systems
Proccss prioritization Cultural changc
Training Pilot shrdy SPC softrarc
SPC Facilitator
Rcsults
Rcduccd busincss costs
C\rstomcr satisfaction Customcr requircrnant
Ccrtifcation
Intcrnal contol
Qgcstionnairc from
33
Reliability quality managon at smallGrigg
er d. (2004)
Deriving Success Factors ...
Quali$aaining
Prcscnce dcdioaled managcr
Top mrnagcorcnt coDmitnrcot
Rcgular usc quality circlcs Existing quality systffrs
R*ults
Continuous improvcfircnt
Kruskd-QucstionnairefromT2 Wallis
rrsponses at LJK
Food
Hypothesisorgeizations
Phynthamilkumaran and Zailani (2008)
lv{anagcrncnt commitmcnt Tcamr*ork
Statistical/Engincering skills
Rlucation
Rolc of qurlity dcpartncnt Communioation
Qucstionnaire fiom
103
r6ponscs at 8
multi-national manufrcturing
companies in Penang/
Kulim Region
Rcgr*sion
Exploratory
Factor
Analpis
Gordon et. al. (1994) was among the first researcher to study
the
SPC
implementation
issues.
They identified
specificmanagement
factors
or
activities
associatedwith
successful implementationof
SPC such as higfuer management commituent,the
stucture
of
SPC training,
the
involvement
of
workers in
decision making process and
job
security issues.Rungfusanatham
et.
al.
(1997) described the process andoutcome
of
developing
a
measurement
instrument
thatoperationalise
the 14
dimensions
rmderlying
the
SPCimplementation/practice
construct.
The results
of
their
studyprovided some
evidence
and
insigbts
into
how
the
SPCimplementation/practice
constuct
might
be
measured in
organizationral
setting.
Rungtusnathart's 14 dimensions includedinspection, update process knowledge and audit and revision. The
missing components identified
in their
14 dimensions are culture issue, pilot project and use of computer.Xie
and Goh (1999) identified three main aspects, namely, management aspects, human aspects and operational aspects to bevery crucial
for
the successful implementationof SPC.
Bird
andDale
(1994) identified three
key
factors,
namely,
capablemeasurement systems, training and management
commifuent
for
effective SPC implementation.
In
their empirical investigationof
defining and
operationalisingthe
questionsof
*what
does the implementation and practice of SPC entail[within oryarizanons]?".Deleryd et. al. (1999a;1999b) conducted process capability implementation
at
nine
Swedish organizations.They
identified factors such as management support, showpotential
of
processcapability study,
consciousdata
gathering, educational efforts,cross-functional teams,
routine
of
process
capability
studna\nareness
and
willing
to
change,pilot
projects
and
use
of
computer
can lead
to
successful implementation.Although
this researchis
focusedon
SPC implementation, the authorsfelt
that someof
the factors are really very much relevantto
any statisticalbased
quallty improvement
methodssuch
as
SPC. They
also suggested process capability successful implementation model orapproach includes factors, deployment and results.
The most comprehensive and detail studies
of
identiffing
SPC
critical
success factorsfor
SPC implementation was done byAntony et.
al.
(2001),Antony et. al.
(2000), Rungasamyet.
al.Q002) and
Antony
and Taner (2003).
Antony
identified
and discussed the key ingredients for the successful implementationof
SPC
in
both
manufacturingand
serviceorganizations.
Theyidentified
10key
ingredientswhich
are asfollows:
man4gementcommitnent and support,
processprioritisation
and
definition, selectionof
appropriate characteristics,define system
devices,selection
of
control
charts,training
and education, tea^m worlgDriving Success Factors ...
Taner (2003)
reviewed
and
compared
four
existing
SPCimplementation frameworks
and
proposed
their
conceptualframework
for
the successful introduction and applicationof
SPC programin
organization.Grigg
QO04) described and categorized the successof
SPCimplementation
will
dependupon
a
ntrmber
of
factors,
bothexternal
and internal
to
organizations. He
definedthe
external factors as the factors that organizations could obtainfrom
various outside solrrces such as available advice and infomration, externalbench
marking, network participation, customer support
and competitive prlessure experienced by the supplier. He then defined the internal factors that are essential to SPC success which includetechnicaUquality
nmnager,
quality
systems,
managementcommitnent, training, teams, self-assessment against an excellence
model,
facitity size,
technology
level and
process/productrelevance.
PhF/nthhanilkumaran
and
T*itlani
(2008)
studied
the factorsinfluencing the
successof
SPC projectsin
the
Malaysianfirms
in
the
northernregion.
Most
of
their
factors are adoptedbased
on
the
study done
by
Mason and
Antony
(2000),
but includedadditional
factors suchas
role
of
quality deparhent
communication and culture.Based
on
Table 1.1, the
authorshave
summarized the success factors are asfollows:
l.
Top managementcommifuent
2.Teanrwork
3.
SPCTraining
and Education4.
Control
charts 5.Identification
of
process/product characteristics
6.
Processprioritization
andidentification 7.
Measurement systems analysis 8.Pilot
project9.
Useof
SPC facilitators 10. Cultural change 11.Deployment. Most of these factors are adopted and adapted based
on
the
study
by
Antony et.
al.
(2001), Antony
et.
al.
(2000), Rungasarny et.al.
Q002) and Deleryd et.al.
(1999).
All
the 1l
1.2.2
Quality
andFirm Perforuance Construct
The
long temr
benefitsof
successful SPC implementations havebeen
reported
in
various
publications
such
as
increasedcommunication
among
atl
departrrents,
improved
customersatisfactions, reduced costs, reduced process
variability
andimproved
product and
processquality as
shownin
Table
l.l
@esutts). Various definition
of
definition
of
SPC
successfulimplementation based
on
literature and interviews conducted byfour
subject matter experts (SME) have been defined and derived(Antony
et.
a1.,2000; Rungtusanathamet.
al.,
1999;Donell
andSinghal,
t996;
Rungtusanathamet.
al.,
1997;Deleryd
et.
al.,1999u
1999b; Rungasarryet.
al.,
2002). Basedon
professionaljudgemental process
of
groupingsimilar
characteristics,the
SPC successful implementation has been divided intotwo
aspects: Soft aspects and hard aspects.In addition" this study
will
also try toidentiff
and categorize whichfactors
will
have a causal impact directly on the soft aspects and/orhard aspects independently
or both simultaneously.
Studies byCheng and Dawson (1998) and Brannstom-stenberg and Deleryd (1999) revealed that SPC being introduced into organizations could be attributed by
two
categoriesof
motivational factors, namely, toimprove
manufacturingand
processquality and
to
satisff
the customer demands.In
this research, thetwo
motivational studies aresimilar to
wbatwe
classified as soft and the hard aspectsof
quatity performance.1. Soft Aspects
"Soff'aspects
of successful implementation is related to hr'rmanfactors such
as
improved customer satisfactioru
improvedunderstanding
of
the
processfor
peopleat
different level
of
organization and uses perceptual data for measurement.2.HudAspects
"Hard"
aspects are concernedwith
internal measureof
qualityperfonnance such as reduction
in
scrap rate, improved yield,Duiving Succ*s Fadors ...
reduced process
variability,
cost
improvement
and
usesobjective measure.
Dow
et. al.
(1999)
defined
qualityperformance measures
comprising
forn
items,
namely, percentageof
defects,the
costof
warranty,the total cost
of
quality
andthe
defect rate relativeto
competitors.
Based on interviews conductedwith
the panelof
SMEs, thedefinition
of
quality
improvement consists
of
increasing
yreld,
defectreduction, cost improvements, less rework and scrap, and reduce
variability.
However, because of confidentiality and availabilityof
such precise dafa and highly industry specific,it will
have a drawbackforthe
company from responding to the surveys andit
will
affect low response rate. 3. Firm PerformanceQuahty performance
is
positively relatedto
firm
performance(Kaynalg
2003). The
measurement indicatorsto
measure thefimr
performance are including sales gtowth,unit
costs,profit
growth and market share (Kalnak, 2003; Adam,2000).In
summary,all
the
3
factors which representsoft
aspects, hard aspects andfirm
performance are manifestedby
12 items in
researcher's paxt 3 questionnaire.
1.3
RESEARCH DESIGN
1.3.1. Questionnaire Design
The
researchinstnrment
will
use
the
five-point
Likert
scale, representing a rangeof
perception from strongly disagree (stronglydisagree:
l)
to
shongly agree(stongly
agrce:5).
The useof
5-point
Likert
scalein
thistlpe of
quality management practices has been supportedby
many researchers @rajogo andBrown,2004;
Flynn et.al.,
1994; Sousa and Voss,2002).
Theinitial
versionof
the questionnaire
will
bepilot tested to
checkfor
thefollowing
issues:
l.
The representativeness, reliability andvalidity
of the items2.
The degree of thedifficulty
and understanding of the items by respondent3.
The total time taken to complete the whole questioner This questionnaire was presented and reviewed by the 16 membersof
manufacturing
and
industiat
engineering
deparhent
at departuentalcolloquium.
Individual consultation and meeting was held based on the feedbacks and the questionnaire was modified.The
questionnairewas
sent and reviewedby the
eight
quatityexperts from both the academic and industry to check for the above three criteria. The questionnaire was modified based on comments
from these nine experts.
Pilot
study was conducted by sending the questionnaireto
manufacturingindusty to
pre-test the instnunentand to confirm the relevancy of the questions and
to
provide clear meanings and jargons used in the industry.13.2 Sampling Design
For this
research,the
sarnplewas
selectedrandomly
from
the automotive related manufacturingfirms
listedin
theDirectory
of
StandardIndustriat
Research Instittrteof
Malaysia
(SIRM
TS16949
Certified and the
databaseof
PerusahaanAutomobile
of
National(Proton).
Many Asian firms are reluctant to participatein
research surveywithout
developing personal relationshipwith
the researchers as notedby
Carr et. al. (2000). Based on the previoussurvey
study
on
quality
managementresearch
in
Malaysia manufachuingindustry
conductedby
Ahmed and Hassan (2003)the response rate was about
l
l
percent.In
orderto
increase the responserate,
we
sent
four
questionnairesper
organization toquality related
managersand
engineerswithin
the
company. Questionnaireswere
sentto
the
managersand
engineersof
50 companies, resultingof
122 useable questionnaires or respondents. Sanrplesize
is
an important
considerationin
the
discussionof
intemal consistency and constnrction
of
satisfactory psychometicsDriving Success Factors ...
properties.
Specter (1992) recommended thatin
orderto
conduct items analysis for dimensioning factor,it will
require a sample sizeof
about 100
to
200
respondents. Therefore, basedon
theseguidelines,
our target
sampleof
122 respondents exceeds theminimum
of
100 respondents.I.4
REST]LTSAIID
DISCUSSION
1.4.1
Purification
of ftemsBefore conducting factor analysis, an item must be
pruified first in
orderto
avoid the confounding effect during the interpretationof
the conceptual
factor.
Two criteria for purification of the items are adoptedthat
are items analysis and reliabilrty.Firsq
it
is
called items analysis. Nunally (1978) developed a methodto
evaluate the assignmentof
the itemsto
scales. Hair et.al. (2005) recommended a correlation greater than +0.3 are considered to meet theminimal
level; +0.4 are considered more important and +0.5
or
greater are considered practically significant. In this studyall
the 40 itemsfor
success factors
and 12 items
for
quality
andfirm
perfonnance exhibited corrected item-total correlation exceedstle
cut-off
valueof
0.3 recommended by Nunally, and Bemstein (199a); Hair et. al. (2005). Second, items are also eliminated using internal consistentreliability.
Thereliability
of
the
items comprising each factor isexamined
using
Cronbach'sAlpha
(a)
which
computes internal consistencyreliability
among a group of items combined tofonn
asingls
scale(Nrmally,
1978; Cronbacb,1951).
Nrmally
(1978) recommended that new developed measures can be acceptedwith
Cronbach's Alpha(o) of
more than 0.6, or else, 0.7 should be thethreshold
and 0.8
or
more
is
significant andreliable.
Based onthese recommendation"
our
study
is
setting
0.7
or
higher for
minimnm
reliability
of
all
52
items.Nl
52 items
passed thisreliability test.
As a result,all
the 52 items for success factors andquality and
firm
performance were retainedfor
subsequent factoranalysis.
1.4.2
Kaiser-Meyer-Olkin (KMO)
Measure andBartlett's
TestKMO
measures the degreeof
intercorrelations among the variables and the appropriatenessof
factor analysis (Norusis, 1999).Hair
et. al. (1998) recommended the value of 0.5 or higlrer for entirematrix
or an individual variable
to
indicate the appropriatenessfor
factor analysis. Bartlett's testof
sphericity which provides theprobability
of
correlation
matrix
among
the
variables,
which
indicatessignificant correlations among at least some of the variables
(tlair
et.al.,
1998; Nontsis, 1999).KI4O
measure of sarnpling adequacy was 0.885 and resultsof
Bartlett's testof
sphericity (Chi-square:
2111.88;df =
351;p<
0.000) indicates that success factors have aclear
constnrctvalidity. For
the
quality and
firm
performanceconstnrc! the
KMO
was
0.851 and resultsof
Bartlett's test
of
sphericity (Chi-square
:
843.089;df
=
66;
p <
0.000) establish clear construct validity.1.4.3
Exploratory
Factor
Analysis (EX'A)
-
Principal
Axis
Factoring
Based
on
the
resultsof
KMO
and Bartlett's test
of
sphericitysuggested that the
intercorrelation
matix
of
success factors andquahty and
firm
performance contains enough conrmon variancefor
factor analysisto
be carriedout.
40 itemsfor
sucoess factors and 12 itemsfor
quatity andfirm
performance wereanalped
by usingEFA
applyingthe principal
anis factoring as an extractionmethod and varimax
criterion
as rotationmethod.
It
needto
be noted tbat EFA applnng the principal component as an extraction methodand varimax criterion as
rotation methoddelivered
the same factor stnrcttgefor
both SPC success factors and quality andfirm
performance.In
order
to
concludethat the factor
is
uni-dimensional, Comrey (1973) zuggested that factor loadings greater
than 0.45
are consideredfair;
greater than0.55
are consideredDeriving Success Factors ...
good;
grater
than 0.63 are considered very good and thoseof
0.71as
excellent.
Hair et.
al.
(1998) recommendedthat items with
factor loadings greater than 0.5 are considered adequate items
for
that
factor.
Thecut-offpoints
of 0.5 to delete items that cross-loadon
multiple facto(s)
were used (Ngai et.al.
2004).
Cronbach's Alpha was calculated for the extacted six success factors and threequallty and
fimr
performance. The proposed factors are said to beintemally consistent and highly reliable
if
the Cronbach's Alpha isgreater than the
cutoffpoints
0.7 (Nunally,1978).
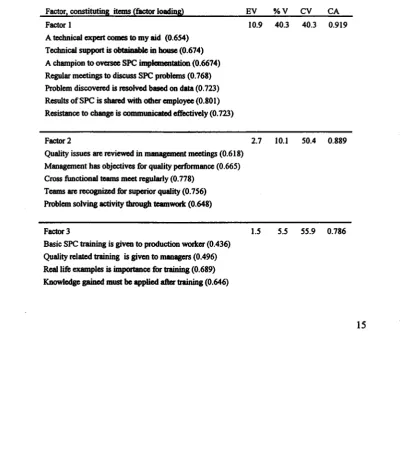
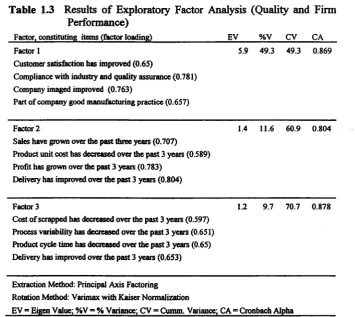
Table 1.2 and 1.3 show the resultsof
EFA which produced six-factor modelwith
27
itemsfor
SPC success factors and three-factor modelwith
12 items for quality andfirm
performance.Table 1.2 Results of Exploratory Factor Analysis (SPC success factors)
Factor. constitutinc itcds (ftcoor loodiDc)
EV
o/oYCV
CAFactor I
A bchnicsl Glpcrt com to my aid (0.654)
Tcdnicd support is obtdnrblc io hotnc (0.674)
A champion to ovcrscc SPC
itryk*atim
(0.6674)Rcgular mcctings to discuss SPC probloms (0.758)
Problcm discovcrcd is rcsohcd bucd on deta (0.723)
Rcsutts of SPC is sharcd with oftcr coplof,oc (0.801)
Rcsistancc to change is conmunicaod cfrcctivcly (0.723)
Fac'ar2
2.7 l0.l
50.4 0.889Quality issucs arc rcvicwEd in mmagcrnant mcctings (0.618)
Managcrncnt has objcctivcs for guality pcrformanoc (0.665) Cross firnctional tcarns mcct rcgulady (0.778)
Tcams rrc rccognizrd for supcrior quality (0.756)
Problcm solving E livity tuougl tcurworlc (0.648)
10.9
40.3
403
0.919Factor 3
Basic SPC training is givco to productior wo*cr (0.436)
Qudity rclatcd haining is givcn to managcrs (0.496) Real li& cxamplcs is importaocc for bainiag (0.689)
Knowldge gnircd mrst bc.ppliod aturaining (0.6a6)
1.5 5.5
55.9 0.786 [image:15.596.97.502.284.740.2]Rcfrcshcr olass is rcgularly conducted (0.588)
Factor 4
SPC is bcing inplcocntcd in othcr dcpartncnt (0.545) SPC implcmcnmion bascd on stuchucd plan (0.608) SPC proccdurcs uc bcing apptcd by tcams (0.564) A largp numbcr of pcrsonncl uscd SPC (0.723)
1.4
s.3
6t.2
0.877F.ctor 5
Top managcmcnt spcarfrcads quality ctrort (0.635)
Top managemcnt providcs visible support (0.783)
Top managanert providcs adcquatc rcsourocs (0.568)
1.3
4.7
65.9
0.84Factor 6
Sclcction of kcy proccsVproduot paramctcr (0.424)
Thc impact of sclccting thosc paramacr is knovm (0.656) Thc customcr has askcd to monitor this paramctcr (0.544) Extraction Mcthod: Principal A"tis Factoring
Rotation Mcthod: Varimax with Kaiscr Normalization
EV = Eigcn Valuc;o/o\ =o/oYariancc; CV = Gumm. Varianco; CA = Cronbach Alpba
Majority
the factor toadings exceed 0.5 recommendedby Hair
et.at.
(1998), Eigen valuerule
greaterthan
I
sqgest€d
by
Kaiser(1970).
Six -factor
modelfor
SPC success factors explains 70percent
of
the total
variance, whereby, three-factormodel for
quatity andfirm
performance explains 70.74 percentof
the totalvariance.
1.4.4 Assessment of
Reliability
andValidity
Reliability
refers to the consistency and stabilityof
a scorefrom
a measurementscale and was
evaluatedby
internal
consistency analysis using Cronbach'sAlpa
(Cronbach,l97l).
Table 1.2 anrd1.3 show the values
of
the
respectivefactors and the
overall Cronbach'sAlpha
for
the
six-factormodel
of
SPC success andl6
Deriving Success Factors ...
three-factor model
of
quality andfirm
performance.All
the valuesof Cronbach's Alpha were above the recommended
cut-offpoint
of
0.7 (Nunally,
1978).
Since the Cronbach's Alphaof
all the factorsextacted by EFA is above 0.7, all the multi-ilems scales developed for this study were judged to be reliable and intemally consistent.
Table
1.3
Resultsof
Exploratory Factor Performance)Factor. constituting itcms (frctor loading)
Analysis (Qualrty and Finn
oay cv
cAFactor I
Customcr satis&ction hrs imprwcd (0.65)
Compliancr with irdustry and quatity assurancc (0.781)
Company imagcd improvcd (0.763)
Part ofoompany good manufacturing practicc (0.657)
5.9
49.3 49.3 0.869Effir2
Salcs have grown ovcr tlc past ltr€ prs (0.707)
Product unit cost has docrcrscd ovtr thc prst 3 ycan (0.589)
Profit has grown over thc past 3 1lears (0.783) Dclivcry has improvcd ovcr thc past 3 ],cars (0.804)
t.4
It.6
60.9 0.804Factor 3
Cost ofscrappcd has dcorcrscd ovcr thc past 3 pars (0.597) Prooess variability has dccrcascd ovtr tbc past 3 ycan (0.651)
koduct cyclc timc has docrcascd ovcr thc past 3 ycars (0.65)
Dclivcry has improvcd ovcr thc past 3 ycars (0.653)
t.2 9.7
70.7 0.878Exraction Mcthod: Principal Axis Factoring
Rotcion Mcthod: Varimax with Kaiscr Normalization
EV = Eigcn Valw:,'hY - o/cYtiancc: CV
:
Cumm. Vada$c; CA = Cronbach AlphaValidity
refersto which
a construct or a setof
rneasures coffectlyrepresent
the
conceptof study.
Validity
is
differentiatedfrom
reliability
in
it
is
concernedwith
the how accurate the concept isdefined
by
the
measure(s),while,
reliability
relates
to
theconsistency
of
the
measure(s).Three most popular
tlTes
to [image:17.597.130.486.159.476.2]evaluate
validity
of
the
constructs: contentvalidity,
constructvalidity
and criterion-related validity.Content Validity
Content
validity
refersto
the
degreein
which
the
scale itemsrepresent
the
domain
of
the
constnrct.In
this
study,
all
the measurlement items were developed and constructed based on both extensive review of the litetature and detailed evaluations by the 16 membersof
Industrial and Manufacturing Engineering departrnent aswell
as9 quali$
experts consistsof
academicians, consultants and practicing managers and engineers in SPC related field..Construct Validity
Constnrct
validity
refersto
an operational concept or a theoretical constnrcts thatit
was intended or was designedto measure.
Theconstruct
validity
of
six
measurement scalesfor
SPC
successfactors
and
three
measurement scalesfor
quality
and
finn
performance was evaluated
by
using Principal Component FactorAnatysis
(tlair
et. al.,
2005)with
varima,rrotation.
All
factors loaded acceptablywell
and the results are shownin
Table 1.2 and1.3.
In
this
study,KMO
index
is
0.885 andBartlett's test
of
spehericity (approx. Chi-square
:2111.88; df
:
351, Sig.:
0.000)for
SPC success factors,while, for
quality andfinn
performanceKMO
index is 0.851 and Bartlett's test of spehericity (approx.Chi-square
:
843.089;df
:
66, Sig.=
0.000). Therefore, the constnrctvalidity
of the survey result is established.Criterion
ValidityCriterion
validity
concernswith
the extentto which
the model is related to an independent measure of the relevant criterion. This is also known as predictivevalidity
or extemalvalidity.
The criterionrelated
validity
of
the
model
was
determinedby
computingmultiple
correlation(R)
betrn'een dependent variablesof
qualityperformance
(soft
aspectand hard
aspecDand
six
independentvariables
of
SPC success factors. Themultiple
correlations (R)Deriving Success Factors ...
were 0.546 and 0.40
for
soft aspect and hard aspect respectively.Cohen (1988)
suggestedthat
a
multiple
correlation
of
0.14 representsto
a small effect size, that coefficientof
0.36 representsto a
medium
effect
size
and
those coefficients above
0.51 representsto
a
large effect
size.
Thus,this
indicatesthat
sixindependent variables
of
SPC success factors havea
reasonably (medium to high) degree of criterion-related validity.Based on the results
of
the EFA,reliability
assessment andvalidity
analyses showed that the survey instnrment has desirablepsychometric metrics properties,
which
arereliable,
empiricallytested and rigorously validated.
1.4.5 Discussion
Based on the
final
resultsof EFA
in
Table 1.2 and 1.3, six-factormodel
for
success factorsand
three-factor modelfor firm
and quahty performance wereextracted. In
orderto
interpretor
labelthem under panicular success factors, subjective judgment based
ontheory should be considered.
1.4.5.1 Six-Factor Model SPC Success X'actors
For
the six-factor model, thefollowing
SPC success factors were labelled:Factor
l:
Roles of qualitydeparhent (FCl)
The
role
of
quality deparftnent plays a critical roleto
support theimplementation
of
SPC. Therole which
includes supporting andestablishing
the
systems/methodin
placed
for
the
effectiveimplementation.
Examplesof
systemVmethods procedures areappropriate
tools,
gage repeatabilityand reproducibility,
useof
softrrare
and
hardware, select parameter
and
process,
datacollection sheet, out
of contol
action plan andothers.
Other rolewhich
should be ptayedby quality
departrnent isto provide
and create awarenessto all
employeeof
the comPany on new culturalchange
of
practicing SPC(Antony. et. al.,
2000). People facingculhual
change
and new
challenges
as
a
result
of
SPCimplementation must understand the change first. Example
of
suchchange
is
culture
of
collecting
and
analyzingd^a
the
newstatistical language
used
for
corrununicationand
new
job
assignment. Often
this
changecan
lead
to
conflict
amongemployees.
The best wayto
solvethe conflict is
through clear communication plan" motivating employees to overcome resistanceand educating employees
of
benefitsof
SPC implementation.In
summary,
the role
of
quality
departnent acts as consultant andfully
provides technical support especially when the problem arises as a result of SPC implementation.Factor 2: Teamwork (FC2)
Team
work
can
foster better
communicationto
solve
and implement complex pnocesses.It
requires input from different background
of
employee'slevel
such as
operator,supewisor
and engineerfor
problem solvingactivity. It
is good practice and ideato
have
sPC
steering committeeand
processaction tearn for
effective implementation of SPC @eleryd et. al., 1999b).Factor 3: Training GCa)
Training creates a sense
of
ownershipfor
everyone atall level
of
organization and helps the communicate the
"rlv\y''
ando'how''to
bettei pnderstand the firndarnentals, tools, and tecbniques
of
SPC.Training
is
part
of
communication techniqueto
ensure
thatemployees al all level apply and implement the SPC effectively.
Deriving Success Factors ...
Factor 4: Deplolm.ent (FC4)
One
way
to
accomplishthis
aspectis to
usepilot projects.
Thepilot
projects needto
be carefully selected andreviewd
so thatthe maximize benefits
of
implementationis
achieved.If
thepilot
projects
are
successful,the
managementis
convinced
and committed, therL there are good prospects that the implementationis successful.
Factor 5: Top management commituent (FC5)
Many
authors(Harris
andYit,
1994;Donell snd $inghal,
1996;Young and
Winistorfer,
1999) haveall
agreed and identified thatthe
management support hasproved
to
be the most
importantcritical
factor
in
SPC implementation.
Without
managementsupport and
commihent,
therewill
be no direction, nofollow
up, no review progress and update and finally the implementation issue is lost.Factor 6: Process focus (FC6)
Process
prioritization which
selectskey
processesfrom a
larger number manufacturing processeswill
assist and guide managementto focus on key area due to limited resources (Antony et. aI., 2000).
A
very
powerfrrl
approachfor
prioritizing
processesprior
to
implementing SPC was recommended by Goh et. al. (1998).1.4.5.2
Three-factor
Modelfor Quality
andFirm
Per{ormanceFor the
three-factor modelof
quality
andfirm
performance, thefollowing
factors were labelled:Factor
l:
Qualig
performance - soft aspects (SA)lnprovement in +rality
performancewill
resultin
more satisfiedcustomer
(Ahire and
Dreyfus, 2000). Besides satisffing
the customer, the quality performancewill
enhancefirm
competitiveposition (Aaker and Jacobson, 1994;
Fomell
et.al.
1996). Qualityperformance improvement
will
also lead
to
improve
process understanding (Antony et. al.,2000)
Factor 2: Quatity perforrrance - hard aspects
(HA)
continuous quahty improvement
will
resultin
reducing scrap andrework
costs(Kaynak,
2003;Antony
et. al.
2000)' as
well
as enhancedproductivity such as improved product delivery
andproduct cycle
time.
The removalof
special causefrom
common causeof
variationwill
resultin
productprformance
consistency(Antony et. al., 2003).
Factor 3: Firm performance
(FM)
KaFak
(2003) suggested a positive relationship betn'een qualityand
firm
performance. This study confirrred the items usedin
the scaleto
measgre
firm
perfonnancewhich
include sales growtlSr:nit
costs,profit
growth and market share (Kaynak' 2003; Adam and Thomas,2000).1.4.6
Lproposed relationship
betweensPC
success factons andquality
andfim
per{omance @xplanatory
Study)This
shrdy
proposedsix
sPC
suc@ssfactors
as
independentvariables and tbree factors
for
quatity and
firrr
performance asdependent
variable.
An
additional
a
total
of
214
cases from certifiedTS
16949 manufacturing companies werecollected.
At
this stage, an advanced muttivariate statistics such as Confirmatory Factor analysis (CFA) needs to be considered. CFA is a statistical technique used
to
confirm the factor stnrctureof
a setof
observedvariabtls. CFA allows the researcher to confirm that a relationship between the observed variables and underlying latent constnrct(s)
Deriving Success Factors ...
exist.
Figure
I
showsthe
relationship between suocess factors(FCl,
FCz,
FC3, FC4, FC5, FC6)
and
quatity
and
firm
performance
(SA,
HA,
FM).
The
diagram
also
shows
theunderlying
late,nt constnrct andits
respective observed variables. [image:23.594.108.477.173.489.2]For
example, factor
I
(FCl) is
representsby
seven observed variables, namelyil,i2,i3,i4,
i5, i6 and i7).Figure
l.
A
proposed relationship among latent variables(FCl,
FC2, FC3,
FC4, FC5, FC6,SA,
HA, FM)
and betrveen success factors and quality and firm performancel.s
coNclusroN
ANp
FUTTTRE RESEARCTTThis
study has determinedsix
Statistical Process Control.successfactors
that
are relevantto
Malaysian manufacturing industriesconsists
of
roles
of
quality
departnent, teamwork,
training,deplolment,
top
managiementcommitnent and
process focus. Thesesix
success factorswill
serve as independent variables thatwill
have an impact on quality andfirrr
performance. Quality andfirm
perforurancewill
serve as dependent variable which consistsof
three-factor model namelysoft aspec! hard
aspect andfirm
performance. The next stepof this
study isto
confirm theoreticalmodel
which
examine a relationship between SPC success factorsas
independentvariable and quality and
finn
performance as dependent variable by using advanced multivariate statistics suchas confinnatory factor
analysis(CFA)
and
stnrctural equationmodelling (SEluf).
RET:ERENCES
Aaker,
D.A.
and Jacobson,R.
1994.The financial
informationcontent of perceived quality, Journal of Marketing Research,
31:
l9l-201.
Adam,
E.E.
and
Thomas,
F.S.
2000. Quality
improvement approach and performance:multisite
analysiswithin
afirm,
Journal of Qualtty Manogemenr,5: 143-158.
Ahire,
S.L.
and
Dreyfirs,P.
2000.
The
impact
of
desrgnmanag,ement
and
process
managementon
qualtty:
anempirical examination,
Jourrul of Operatiow
Management, 18: 549-
575.Antony,
J.
BalbontiruA
and Taner,T. 2000.Key
ingredientsfor
the
effective implementationof
Statistical Process Control,Work StuSt, a9(6): 242-247 .
Antony, J.
and
Taner,T.
2003.A
conceptual frameworkfor
theeffective
implementation
of
statistical process
control, Busines s Process Management, 9(4): 47 3489.
Bir4
D
and Dale,B.
1994. The misuse and abuseof
SPC: a case study, InternationalJourrul of
VehicleDesign,l5(l):
99'107Duiving Success Factors ...
Bounds,
G.M.
1988. Successin
implernenting statistical processcontrol
as
a
function
of
contexfiial variables
in
20manufacturing organizatiozs, unpublished Ph.D. thesis, The
University of Tennessee, USA
Brannstrom-Stenberg,
A.
and Deleryd,M.
1999.Implementationof
Statistical
ProcessControl
and processcapability
studies: Requirements or freewill,Total
Qwlity
Management,l0(4):439-446.
Cagwin,
D.
and Bouwman,M.J.2002. The
association betweenactivity-based
costing
and
improvement
in
financialperformance, Management Accounting Research,13:1
-
39 Carr, A.S., Leong, G.K. and Sheq C. 2000.A
study of purchasingpractices in Taiwan, International
Jownal
of Operations andP r o duction Management, 2A(12): | 427
45
Cheng, P.C. and
Dawso4
S.D. 1998.A
studyof
statistical processcontrol: practice, problems, and training needs, Total Quality
Management,9(l):3-20
Cohen,
J.
1988.
Statistical Pov,er Analysisfor
the
BehavioralSciences, 2od. Edition, Hillsdale, N.J. : l,aurence Erlbaum.
Comrey,
A.
1973.A
First
Courseon Factor
Analysis, London: Academic PressCronbach,
L.J.
1951.
Coefficient
Alpha
and
the
Intemal Consistency of Tests, Psychometrica, 16: 297 -334Donell,
A.J.,
and
Singbal,S.C.
1996.^SPC tmplementation
for
improving
product
qulity,
IEEE/CPMT
International Electronics Manufacturing Technology SyrrposiumDelery4
M.
Deltin,
J
and
Klefsjo,
B.
1999a. Factorsfor
successful implementation
of
ProcessCapability
Studies,Quality Management Journal, 17
:
40-59Deleryd,
M.
Garvare,R
and
Klefsjo,
B.
1999b. Experiencesof
implementing
statistical methodsin
small
enterprises, The TQM Magazine,ll(5):
341-350Does,
R.
Shippers,W. and
Trip,
A.
1997.A
frameworkfor
implementing
of
statistical processcontol,
InternationalJournal
ofQnlity
Science,2(3): 181-198Dow,
D.
Samson D. andFor4
S. 1999- Exploding the myth; Do allquality
management practices contributeto
superior quahtyperformance?,
Productioru
and
Operations
Management,l:l-27
Fields,
D.J.
1991.A
sAdy of work environmentfactors
associatedwith
the transfer of
statistical processcontrol training
toshop
floor
application, UnpublishedPhD
thesis, MichiganState University, USA.
Flpn,
B.B.
Schroeder,RC.
and
Sakakibara,
S.
1994-
A
framework
for
quality
management research
and
an associated measurement instnrment,Journal
of
Operation Manogement,ll:-
339 -3 66Fornell,
g.
Jshnson,M.D.
Anderson,E.W.
Ch4
J- Bryant" B.E.1996. The American
customer satisfactionindex:
nature,pqpose
and findings,Journal of Marlceting,60(4): 7-18Crigg,
N.p.
2004.
An
empirical investigation
of
the
use
of
statistical process
control and
improvement rnethodologieswithin
food
and
drinks manufacturingfacilities
in
the
UK, unpublished Ph.D. thesis, Universityof
Strathclyde, GlasgowGoh,
TN.
and
Xie,
M.
1998.Prioriti"ing
processesin
initial
implementation
of
statistical process
control'
IEEE
Traruaction on Engineering Management,
aS(l):
66-71Gordon,
M.E.
Philpog J.W. Bounds,G.M.
and Long,W.S.
1994' Factors associatedwith
the succ€ssof
the implementationof
statistical process control, The
Journal of High
Technologt Management Research. 5(1):
101 -12I
Hair
Jr, J.F. Anderson, R.E. Tatham,RL.
andBlach
W'C'
1998'Multivsiate
Data
Analysis,
5d' Edition'
Prentice-Hall:Englewood Cliffs, N.J.
Hair
Jr, J.F. Anderson, R.E. Tatham,R,L.
and Black,W'C'
2005'Multivariate Data
Analysis,
6th Edition,
Prentice-Hall:Englewood Cliffs, N.J
Harris,
C.R. and
Yit
W.
1994.
Successfully
implementingStatistical
ProcessControl
in
integrat€dsteel
companies,Interfaces,24:
49'58Deriving Success Factors ...
Kaiser,
H.F.
t970.
A
Second
Generation
Little
Jiry,
P sychometrika, 35: 401 -417
Kaynak,
H.
2003.
The
relationship between
total
qualitymanagement practices and their effects on form perfonnance,
Journal
of
Operations Management,2l:
405435
Mason,
B.
andAntony, J.
2001. Statistical Process Control:An
essential ingredientfor
improving service and manufacturingquality, Measuring Business Excellence,5: 47
-
5l
Ngai, EWT.
Cheng, TCE.And Ho,
SSM. 2004.Criticat
successfactors
of
web-based supply chain management systems:An
exploratory
study, ProductionPlanning and Control,
15:622-630
Nunally, J.C.
1978. Psychometric Theory, SecondEdition,
NewYorlq
McCrraw-HillNunally, J.C. and
Bernstein,I.A.
1994, Psychometric Theory,Third Edition:
McGraw-Hill
Norusis,M.J.
1999.^SPS,S 9.0 guide to data analysis, Prentice-Hall:
Englewood Cliffs, N.J.
Prajogo,
D.I.
andBrowq A.2004.
The relationship betweenTQM
practices
and quality
performanceand the
role
of
formalTQM
programs:An
Ausffalian empirical study, Qtality
Manogement
Journal,ll(a):
3l
-
42Rohani,
J.M.
Yusof, S.M. andMohamad,I.2006.
Using structral
equation modeling
to
establish
critical
success factorsinterdependence
in
statistical
process
control implementatiofl, 2nd. International Conference onSix Sigrrq
5
-
7 June., Glasgow, U.K.Robinson,
T.L., Audibert
R.L.
and7*nd+ W.
2000. Statistical ProcessControl:
It's
a
Tool, not
a
Cult,
ManufacturingEngineering,
3:
104-l 17Rungfisanafham,
M,
Anderson,J.
and
Dooley,
K.
1997.Conceptualizing organizational implementation and practice
of
Statistical Process
Contol,
Journal
of
QualityMana geme nt,
2(l)
: 1 13 - 137Rungtusanathanl
M.
Anderson, J.and
Dooley,K.
1999. Towardsmeasuring
the
SPC
implementation/practice construct.International
Jourrwl
of
Quality
&
ReliabilityManagement, L6(4): 30 | -329
Rungasamy,
S.
Antony,J
and
Ghosh, S. 2002.Critical
success-factors
for
SPC implementationin UK
small
and mediumenterprises: some
key findings
from
a
survey' The
TQMMagazine,
M$):
217'224Reid,
R.D.
2005.TS
16949-
Wheredid
it
come from?,Swlity
Progress,3S:3l
-
38Shamsuddin,
A.
and
Masjuki
H.
2003.
Survey
and
caseinvestigations
on
applicationof
quality
management toolsand
tecbniques, International
Journal
of
Qtality
&
Reliability Management, 20(7): 7 95'826Spector,
P.
1992.
SummatedRating Scale Construction:
AnIntroduction
Sage University Paper serieson
QuantitativeApplication
in
the
Social
Sciences,series
no
07-082' Newbury Parh CA: SageSousa, R. and Voss, C.A.2002. Quallty Management Re-visited: a
reflective review and agenda
for
futrne research,Journal
of
Operations Management, 20:. 9 I - I 09Xie,
M.
and GoluT.N.
1999. Statistical Technique for Quality' 77,eTQM Magazine,
Ll(4):
238-241Youug,
T.M
and Winistorfer,P.M.
1999. SPC: Statistical ProcessControl