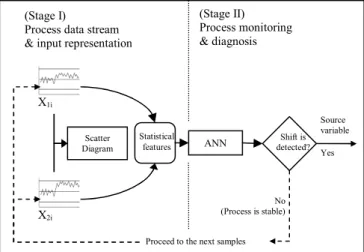
Statistical features ANN recognizer for bivariate process mean shift pattern recognition
Full text
Figure
Related documents
Simulation analysis is carried out for DVR in distribution system with voltage quality issues with different control strategies showing out source voltage with voltage quality
The risks for belonging to the worst scores (0 and 1 were combined due to small subject size) and the worst quartile were compared for standing balance test and for 6-m usual walk
Current physical health status (independently of baseline physical health) had the strongest association with work performance and absence at 3 month follow up, confirming the
Estimates of population-specific F ST were calculated using localized haplotype clusters from BEAGLE (left) or directly from SNPs (right).. Each plotted line represents one
The manage- ment practices are four irrigation techniques (furrow, sprin- kler, drip and subsurface drip (SSD)), four irrigation strate- gies (full (FI), deficit (DI),
A dose response curve for glucocorticoid-induced proximal and distal colonic cation transport in vivo was established in adrenalectomized rats.. Distal sodium absorption did
When the blinds had been removed from our panel of DNA, it was found that isolates taken from the same patient on different occasions (isolates NV16 and NV19, isolates NV12 and
