Identification of Corn Maize Borne Pathogen and
Aflatoxins Quantification
Ndayambaje Jean Bernard*, Ingabire Ange Sabine, Mutuyimana Jean Marie Vianey
Chemistry Department, University of Rwanda/College of Science and Technology, Rwanda
Copyright©2017 by authors, all rights reserved. Authors agree that this article remains permanently open access under the terms of the Creative Commons Attribution License 4.0 International License
Abstract
Mycotoxins are toxins produced by aspergillus, a type of fungus that can be found virtually everywhere and their toxicity occurs at very low concentrations. For good storage condition of the post-harvest grains, the sensitive and reliable methods for detecting mycotoxins are required for long-term sustainability of animals ingesting excessive amounts of the toxin from chronic health problem to death. The aspergillus grows rapidly in the air with high relative humidity contrast to the air with low relative humidity. In this study, the samples of maize were randomly collected in three sectors: Nyamata, Gakenke and Mahembe. Using selective media and biochemical tests, the three strains; A. flavus, capable of producing both B- and G-type aflatoxin and A. pseudotamarii which has not previously detected in our region and A. parasiticus, isolated from the collected maize and the total aflatoxin (AFT) in maize flour was evaluated by Reveal Q+; the mean concentrations of AFT were 52.3±3.93 CFU/ml for Mahembe sector, 49.5±0.98 CFU/ml for Gakenke sector and 43.7±2.15 CFU/ml for Nyamata sector. The level of AFT contamination in a, b, c sectors was higher than the maximum tolerable limit of aflatoxins recommended by the United States Food and Drug Administration guidelines for aflatoxin in animal feeds and human foods at 20 parts per billion (20 ppb).Keywords
Mycotoxins, Aflatoxins, Moisture, Maize Flour1. Introduction
Many agricultural commodities are vulnerable to fungi that produce mycotoxins. Among the mycotoxins; aflatoxins produced by Aspergillus species has assumed significance owing to their widespread occurrence and many individuals are chronically exposed to high levels of aflatoxins in their diets. These products frequently affected by aflatoxin are maize, peanuts, cotton seed, milo, and the majority of tree nuts [1]. More quantities of food are wasted every year, because they are invaded by toxic fungi and get contaminated by fungal metabolic products [2]. The aflatoxins are hepatotoxic in animals [3]and mycotoxins are associated with many chronic health risks, including the induction of cancer, immune suppression, blood and nerve defects [4].
[image:1.595.140.474.629.735.2]Maize is one of the most widely distributed food plants in the world and it’s infection by fungi can result mycotoxin contamination for the time of growing, harvesting, storage, transporting and processing stages [5]. The main fungal species, which infect the maize, are A. flavus, A. parasiticus and A. nomius; and these fungi species grow well in the range of 19-35oC to produce maximum aflatoxins at 28oC. Inefficient drying or water ingress can cause pockets of wetter grain resulting in a higher mycotoxin and substantially higher production of aflatoxins [6]. During maize growth to harvest, the temperature and humidity are conducive for the invasion of Aspergillus species, which produce aflatoxins as secondary metabolites [7].
Aflatoxins are also known to be haemotonic and mutagenic affecting blood functions and genetic differentiation respectively, for example, aflatoxin B1, a
potential antagonist to vitamin K in the body. The development of Aflatoxins depends on the infestation and growth of the Aspergillus mold in grain. High temperatures and humidity favor the infection of maize through the silks by the Aspergillus species [8].
Mycotoxins may be present during maize flour production, processing and storage and it has been observed that many humans are suffering from chronic diseases like liver damage or cancer, chronic hepatitis virus infection and kidney nowadays and this is why we are interesting in the determination of Aflatoxin in maize flour as it is consumed by huge number of Rwandans. This study was focused on identification of corn maize borne pathogen and determination of total aflatoxins in maize flour in order to know the level of contaminants in local maize, comparing to international standard value of aflatoxin.
2. Materials and Methods
The samples of maize were collected from (a, b, c) sectors of (A, B, C) districts respectively, and they were transported to the laboratory of College of Science and Technology for further analysis. After entering the QR code into the Reveal AccuScan® Pro Reader. Grind and weigh out a 10g sample followed by the addition of 100mL of deionized water to sample. Blend for 1 minutes, settle, then filter; after that add 1000μL of sample diluent to red dilution cup. Add 100μL sample extract to red dilution cup, mix up and settle down for 5 times, then transfer 100 μL to sample cup. Place a new Reveal Q+ DON strip into the sample cup. Set a timer for 3 minutes. Remove promptly at 3 minutes and interpret results using the AccuScan® Pro Reader.
2.1. Isolation and Identification of Corn Maize Borne Pathogens
Two different media were used in this study; one was differential medium (ADM), containing 0.5% ferric chloride, 1.5% tryptone, and 1.0% yeast extract. The incubation time was 5 days at 28°C with antibiotic resistance from freezer equals to 10ml of 100 x Streptomycin. The other is the selective media - Aspergillus flavus and parasiticus agar (AFPA) for the enumeration in corn maize of the mycotoxin producing fungi Aspergillus parasiticus and Aspergillus flavus with the following concentration (g/l): Peptone 10.0, Yeast Extract 20.0, Ferric ammonium Citrate 0.5, Dichloran 0.002, Agar15.0 with pH 6.3 ± 0.2 at 25°C and chloramphenicol supplement of 100mg/ml.
2.2. Preparation of Solvent and Moisture Content Determination
The extraction solvent used in the Reveal Q+ for aflatoxin test method was done according to Garner with minor
modification [9]. The ethanol/water solution consisting of 65:35 % ethanol-water using a graduated cylinder, a clean carboy with spigot was shaken vigorously until it was completely mixed, then the container was labeled stating the mixture (65/35 percent ethanol-water) and date of preparation. This solution was stored at room temperature in a tightly closed container until needed.
The ground sample of 10g has been measured and dried at 130oC during 90 minutes and after cooling them for 40 minutes, the percentage of moisture content was calculated by calculating the percentage of moisture content which equals to (weight of ground sample before drying minus weight of ground sample after drying)×100/weight of ground sample before drying and this experiment was done in three times for each sample [9].
2.3. Determination of Aflatoxins
2.3.1. Extraction Procedures
The 5g of ground sample was transferred into 25ml solvent (65/35; ethanol/water) in a mixing jar and it was covered and shaked vigorously for 3 minutes. The 5ml extract was filtered with a filter syringe into a clean sample collection tube labeled with the sample identification. After collecting the filtrate (filtered extract), the filter syringe and the ground material were disposed according to waste disposal guidelines, then the filtrate was placed aside for sample analysis; and this experiment was done in three times for each sample [10].
2.3.2. Sample Analysis
The appropriate number of red sample dilution cups and clear sample cups for each test sample were placed in the sample cup rack. Labeled cups were necessary and 500μl of sample diluents to each red sample dilution cup was added by using a single-channel pipette with a new pipette tip. A new pipette tip was used to add 100μl of sample extract into each red dilution cup with sample diluents. A 100μl of diluted sample extract was transferred into a new clear sample cup. Reveal Q+ for aflatoxin test strip was placed with the sample end down into the sample cup then 6 minutes were for incubating; at the end of the 6 minute incubation/development period, remove the test strip from the sample cup and proceed directly to reading test results [11].
2.3.3. Reading Test Results
Test strips should be read within 1 minute after completion of the 6-minute incubation period. The Reveal Q+ test strip was fully inserted into the black cartridge adapter with the sample ends first and results facing out and the cartridge was inserted with test strip upside-down into the reader. The reader’s green light glows when a cartridge was inserted in, and it was automatically began analyzing the cartridge. The AccuScan III reader was used to analyze the test strip and the test results was displayed and stored in the reader. [3]
statistic is used to describe the basic features of the data in a study. They provide simple summaries about the sample and the measures. Together with simple graphics analysis, they form the basis of virtually every quantitative analysis of data [7].
3. Results and Discussions
The microscopic methods like wet mounts, Gram stains were used for identification of strains; and culture media optimization revealed both media rely upon the formation of a bright orange-yellow reverse pigment by Aspergillus flavus and related species. Aspergillus flavus and parasiticus agar (AFPA) gives sufficient color development to enable the recognition of Aspergillus flavus colonies within 42-48 hours at 30°C.
Aspergillus flavus produced orange-yellow reverse colony pigmentation. Aspergillus niger produced colonies with a light yellow reverse but it was easily distinguished from Aspergillus flavus after further 24-48 hours incubation by the production of black conidial heads. The colonies of A. parasiticus and A. pseudotamarii were identified with the dark green along with heads having phialides and the second showed a rapid growth at 370C with more brown colonies than A.flavus.
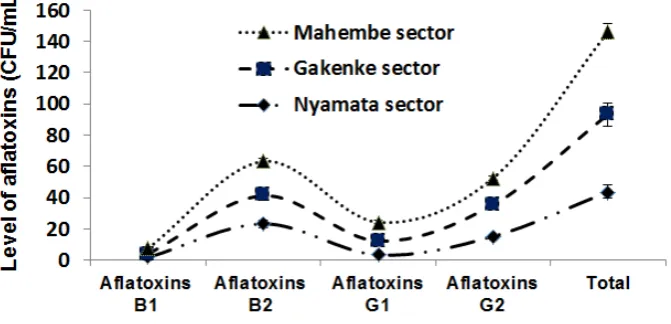
[image:3.595.317.548.83.251.2]The maize flour samples were analyzed three times for the levels of AFs by the Reveal Q+ for aflatoxins.
Figure 2. The moisture content of different sectors
The percentages of moisture content of different sectors such as Nyamata, Gakenke and Mahembe Sector showed that Mahembe sector has the lowest percentage of moisture content than the others.
The average concentration of AFT observed in Nyamata sector is very high for aflatoxin B2 and very low for aflatoxin
B1, while the aflatoxin G2 was higher than aflatoxin B1 in
Gakenke sector.
In Mahembe sector, the result of mean concentration of aflatoxin B1 is low and of aflatoxin B2 is high.
[image:3.595.138.474.421.583.2]The maize samples collected from Nyamata, Gakenke and Mahembe sectors were contaminated with aflatoxin and the mean concentrations of AFT in maize samples of these sectors were: 43.7±2.15 CFU/ml, 49.5±0.98CFU/ml and 52.3±3.93 CFU/ml for Nyamata, Gakenke and Mahembe Sectors respectively. The highest mean concentration of AFT (52.3±3.93 CFU/ml) was observed in maize samples from Mahembe sector followed by maize samples from Gakenke sector (49.5±0.98 CFU/ml) and the lowest mean concentration of AFT (43.7±2.15 CFU/ml) was observed in maize samples from Nyamata sector.
Here one colony forming unity (CFU/ml) or microgram per liter (µg/l) equals to one part per billion (ppb).
The level of AFT contamination in Nyamata, Gakenke and Mahembe sectors was higher than the maximum tolerable limit of aflatoxins recommended by The United States Food and Drug Administration and FDA has set the guidelines of aflatoxin level in animal feeds and human foods at 20 parts per billion (20 ppb).
The difference in contamination level of aflatoxins between Nyamata, Gakenke and Mahembe sectors is due to the relative humidity, moisture, temperature and storage conditions and as moisture decreases, aflatoxin production increases and Parts per billion (ppb), then aflatoxin B1 most important; highly carcinogenic and widespread occurrence in foods; (B1> G1> B2>G2) it means that aflatoxin toxins B1 is
greater than G1 respectively [12]. The general population is exposed to aflatoxins primarily by eating contaminated food and aflatoxin-producing fungi commonly that grow on maize and other grains, peanuts, tree nuts, and cottonseed meal; however, A. parasiticus is rarely found in maize. Meat, eggs, milk, and other edible products from animals that consume aflatoxin-contaminated feed also are sources of potential exposure. Although aflatoxin levels generally are higher during periods of drought, surveys by the U.S. Food and Drug Administration detected aflatoxins in fewer than half of samples collected from feedstuffs even in drought years [13]. The relative proportions and amounts of the various aflatoxins on food crops depend on the Aspergillus species present, pest infestation, growing and storage conditions, and other factors. Contamination is generally higher on crops grown in hot, humid tropical climates, but does occur in temperate climates and varies from year to year. Pre-harvest aflatoxin levels increase during droughts, and post-harvest levels increase when crops are not properly dried before storage or are not protected from insect and rodent infestations. Rapid post-harvest drying and storage in an area with a moisture content of less than 10% can eliminate most contamination [14-16]. Aflatoxins are not manufactured in commercial quantities but may be produced in small quantities for research purposes. Total annual production was reported to be less than 100 g [15,16].
Maize that contaminated at levels greater than 20 ppb may not be sold for interstate commerce. The united State of Food and Drug Administration (FDA) has established action levels for aflatoxin present in food or feed. These limits are
established by the FDA to provide an adequate margin of safety to protect human and animal health [17].
Acknowledgements
We would like to express our special thanks of gratitude to our University of Rwanda/College of Science and Technology for giving the golden opportunity to do this wonderful project, which also helped us in doing a lot of research and we came to know about so many new things on corn maize pathogens.
REFERENCES
[1] Lauren L., 2004, “Aflatoxin Contamination of Commercial maize products during an outbreak of acute Aflatoxicosis in Eastern and Central Kenya,” Nairobi Kenya.
[2] CAST, 2003, “Mycotoxins: Risks in Plant, Animal and Human Systems,” Council for Agricultural Science and Technology. Task Force Report 139. CAST: Ames, IA.
[3] IARC, 2002, “Working Group on the Evaluation of Carcinogenic Risks to Humans. Some traditional herbal medicines, some mycotoxins, naphthalene and styrene,” IARC Monogr Eval Carcinog Risks Hum., 82, pp. 1-556.
[4] Shephard, G.S., 2006, “Mycotoxins in the context of food risks and nutrition issues,” .In: Barug, D., D. Bhatnagar, H.P. Van Egmond, J.W. Van Der Kamp, W.A. Van Osenbruggen and A. Visconti (eds.), The Mycotoxin Factbook: Food and Feed Topics, pp: 21-36. Wageningen Academic Publishers, Wageningen, the Netherlands.
[5] Bradburn N., Blunden G., Coker R D. and Jewers K., 1993, “Aflatoxin contamination of maize,” Trop. Sci., 33, pp. 418-428.
[6] Magan N. and Aldred D., 2007, “Post-harvest control strategies: minimizing mycotoxins in the food chain,” Int. J. Food Microbiol, 119, pp. 131-139.
[7] Candlish A. A. G., Aidoo K. E., Smith J. E. and Pearson S. M., 2000, “A limited survey of aflatoxins and fumonisins in retail maize-based products in the UK using immunoassay,” Detection. Mycotoxin Res., 16, pp. 2-8.
[8] Lubulwa A S G. and Davis J S., 1998, “Estimating the social costs of the impacts of fungi and aflatoxins in maize and peanuts. Proceedings of the 6th International Working Conference on Stored Product Protection”.
[9] Garner R C., 1975, “Aflatoxin separation by high pressure liquid chromatography,” J. Chromatogr., 103, pp. 186-188.
[10] Thean J E., Lorenz D R., Wilson D M., Rodgers K. and Gueldner R G., 1980, “Extraction, cleanup, and quantitative determination of aflatoxins in corn,” J Assoc off Anal Chem, 63, pp. 631-633.
1246 – 1256.
[12]Mutungi C, Lamuka P, Arimi S, Gathumbi J, Onyango C., 2008, “The fate of aflatoxins during processing of maize into muthokoi—a traditional Kenyan food,” Food Control, 19, pp. 714–721.
[13]Price WD, Lovell RA, McChesney DG., 1993, “Naturally occurring toxins in feedstuffs: Center for Veterinary Medicine Perspective,” J Anim Sci, 71(9), pp. 2556-2562.
[14]IARC, 1976, “Aflatoxins. In Some Naturally Occurring Substances. IARC Monographs on the Evaluation of Carcinogenic Risk of Chemicals to Humans,” IARC, CIRC, Lyon, France, 10, pp. 51-72.
[15]IARC, 1993, “Aflatoxins. In Some Naturally Occurring
Substances: Food Items and Constituents, Heterocyclic Aromatic Amines, and Mycotoxins, IARC Monographs on the Evaluation of Carcinogenic Risk of Chemicals to Humans,” International Agency for Research on Cancer. Lyon, France, 56, pp. 245-395.
[16] IARC, 2002, “Aflatoxins. In Traditional Herbal Medicines, Some Mycotoxins, Naphthalene and Styrene. IARC Monographs on the Evaluation of Carcinogenic Risks to Humans, International Agency for Research on Cancer. L