Lateral Non-Homogeneities Characterization Using Seismic Surface
Wave
A. Madun
1, N.A. Yusoff
1and I. Jefferson
21
Faculty of Civil and Environmental Engineering, University of Tun Hussein Onn,
Malaysia,
[email protected]
,
[email protected]
2
School of Civil Engineering, University of Birmingham, Edgbaston, Birmingham, B15
2TT, United Kingdom,
[email protected]
Abstract
Seismic surface waves are well-suited for the study of the elastic profile of soils. Therefore this technique was adopted to evaluate the properties of stone columns used for ground improvement. A scaled-down model of typical stone columns in soft clay was constructed. Measurements were made on stone columns, under controlled conditions so that the properties of the materials used in the model under test were within limited ranges. The dispersive curve produced in this study demonstrated an increased phase velocity with increasing wavelength for the measurements on the clay (between columns), and decreased phase velocity with increasing wavelength for the measurements on the column. The results showed that were useful in characterization of the lateral non-homogeneities works such as vibro-stone column. These results pointed to the results can be influenced by the positioning of sensors with respect to the survey target. Benefit of this technique can be applied as a tool in quality control.
Keywords: Stone column, seismic surface wave testing, quality control.
1. Introduction
One of the main parameters to make predictions of ground movement is the ground stiffness profile (Matthews et al. 1996). Stiffness can be defined as the resistance of the body to deformation under applied force (Clayton, 2011). Traditionally, the measurement of the stiffness profile is carried out by using laboratory and in-situ, invasive, field tests. Geophysical methods, such as seismic surface wave techniques, offer a non-intrusive and non-destructive approach to measure the very small strain stiffness profiles. Moreover, seismic surface wave approaches provide a cost-effective way to assess site conditions. Uncertainty in the design stage of a stone column is associated with the design assumption used in estimating the amount of settlement.
shear tests and plate loading tests are examples of conventional field-test techniques used for quality control testing. In-situ zone tests using large-scale loading are one of the best indicators to characterize the foundations on improved ground but may only demonstrate the stiffness of the upper layers of the ground (Charles and Watts 2002). A comparison between geophysical seismic-based techniques and conventional geotechnical load-testing methods for the measurement of the ground stiffness profile was presented by Matthews et al. (1995), drawing the conclusion that geophysical testing can deliver results of significant quality, whilst avoiding any of the disadvantages associated with either laboratory or physical field tests.
The aim of this paper was to evaluate the seismic surface wave test in characterizing the lateral non-homogeneities via testing on model of stone columns. Measurements were made on scaled-down from typical stone column and under controlled conditions so that the properties of the materials used in the model under test were within limited ranges.
2. Previous Work
As reviewed by Nasseri-Moghaddam (2006), lateral heterogeneities are not usually the main consideration in applying the theories associated with surface wave analysis. The majority of surface wave applications for civil engineering have been used to characterize materials that are assumed to consist of laterally homogenous layers (Forbriger 2003). These are based upon spectral analysis of surface waves (SASW), continuous surface wave analysis (CSW) and, more recently, on multi-channel analysis of surface waves (MASW). Jefferson et al. (2008) applied SASW to qualitatively assess changes to ground properties laterally after vibro-replacement stone columns (VSC) treatment had taken place. Moxhay et al. (2001) and Redgers et al. (2008) applied the CSW technique to measure the stiffness-depth profile of dynamically stiffened ground and VSC. Their results produced a profile of average of shear wave velocity versus depth between the stiffening columns and the surrounding soil. The analysis used in such approaches assumes that the soil behaves as a layered half-space that is laterally homogeneous and isotropic. Thus, the results represent the mean velocity of the whole horizontal layer corresponding to the respective wavelength.
3. Experimental Setup
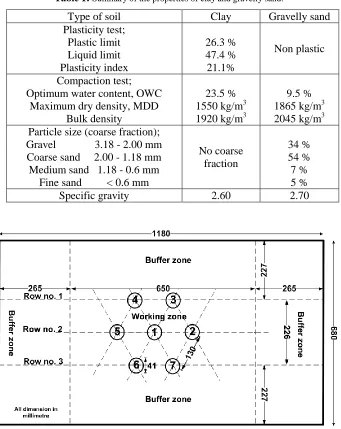
Table 1: Summary of the properties of clay and gravelly sand.
Type of soil Clay Gravelly sand Plasticity test; Plastic limit Liquid limit Plasticity index 26.3 % 47.4 % 21.1% Non plastic Compaction test; Optimum water content, OWC
Maximum dry density, MDD Bulk density
23.5 % 1550 kg/m3 1920 kg/m3
9.5 % 1865 kg/m3 2045 kg/m3 Particle size (coarse fraction);
Gravel 3.18 - 2.00 mm Coarse sand 2.00 - 1.18 mm Medium sand 1.18 - 0.6 mm
Fine sand < 0.6 mm
No coarse fraction 34 % 54 % 7 % 5 % Specific gravity 2.60 2.70
Figure 1: Final layout of stone columns (marks as 1 to 7)
The gravelly sand was mixed at the optimum water content of approximately 10 %. The gravelly sand was compacted at least 98 % of the maximum dry density of 1865 kg/ m3 (based on compaction test). The compacted gravelly sand in the PVC pipe mould was kept in a freezer for 24 hours at –4 °C. This freezing technique was also used by Sivakumar et al. (2004) to obtain reliable column densities. The freezing technique was chosen as it maintained the column diameter and column length throughout the installation the columns in the test box, whilst keeping densities effectively the same for each test
4. Stone column evaluation
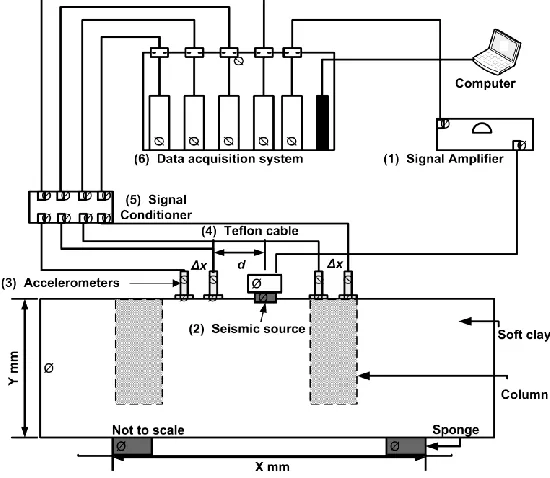
drive the electromechanical vibrator with the excitation signals. On the receiver side, sensors consisted of four piezoelectric accelerometers with a frequency range of 1 Hz to 10 kHz that were coupled to the soil surface with nails. The accelerometers were connected to an analogue signal conditioner and were then sampled by a 24-bit sigma-delta analogue-to-digital converter module with a sampling rate of 50 kHz. The data collected were stored, and processed after the completion of a data acquisition session.
Figure 2: Illustration of the seismic source located between the sensor-pair on column and clay.
5. Experimental Procedure
The array of receivers consisted of up to four piezoelectric accelerometers. The seismic source was located at the middle of sensor-pairs. The distance between the source and the first receiver, d, was set at 7 cm and receiver spacing, Δx, was 3 cm. The stepped-frequencies applied ranged from 50 Hz to 3000 Hz. The larger range of frequency offered the advantage of being able to select the useful wavelengths that fulfil the frequency/wavelength constraint. The excitation waveform consisted of a 1 second continuous wave pulse shaded with a Tukey-window to reduce spectral side-lobes and increase the dynamic range of the narrow band of interest. Using a stepped-frequency approach, the frequency range of the sinusoidal wave was varied from 50 Hz up to 3000 Hz with a step-size of 10 Hz. For each frequency step, five repetitive measurements were obtained for averaging.
6. Seismic surface wave test results
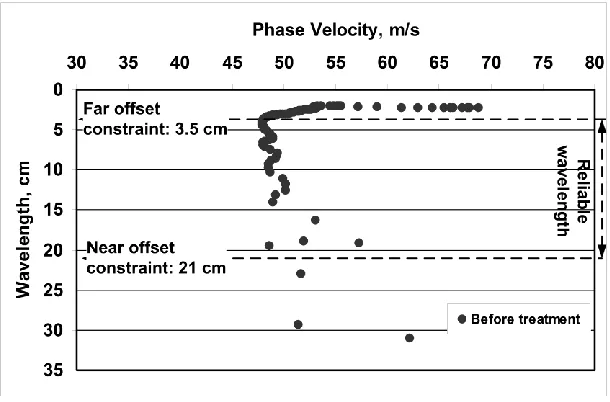
[image:5.612.154.459.279.480.2]Figure 3 shows the measured results of phase velocity dispersion curves before column installation as a control data set, where phase velocity dispersion refers to the variation of phase velocity with the wavelength of the excitation signal. The phase velocity for each wavelength should be similar due to the soil being relatively homogeneous. The measured phase velocities were relatively consistent between wavelengths of 3.5 cm and 21 cm and were only slightly dispersed for the wavelengths outside of this range. This phenomenon occurred due to the near- and far-offset constraints. It is worth noting that the distance from source to the first receiver (d) was set as 7 cm. Based upon the constraints, the reliable phase velocities were for wavelengths between 3.5 cm and 21 cm. The consistent phase velocities versus wavelength measured on the clay bed indicated a relatively homogeneous material, with an average phase velocity of 50 m/s. From the literature, the phase velocity for a shear strength of 14 kPa measured using the CSW test in the field was reported to be 54 m/s (Omar et al., 2010). The measured phase velocity in the laboratory demonstrates good agreement with result in the literature.
Figure 3: The dispersion curves before column installation as a controlled data set.
Figure 4: The dispersion curves for sensors on clay and sensors on top of the 4.1 cm column.
7. Discussion
The results demonstrated that there was an apparent relationship between wavelength and the lateral, or horizontal, span of the effective measurement region. The shape and size of the effective region of measurement in the medium in the lateral and vertical dimensions could be used to identify the sampling volume of the wavelength. To date, this observation has received little attention in the literature on the analysis of surface waves. The measured phase velocities were influenced by the volume traversed by the propagating Rayleigh wave with an elliptical particle movement, which in turn is a function of its wavelength. As a result, the measured phase velocities are directly influenced by the energy propagated by the elliptical particle motion. This is important as it suggests that the wavelength not only relates to an effective depth, but may also have a lateral span and, therefore, is associated with an effective volume.
As discussed by Abbiss (1981), Rayleigh wave energy extends to approximately one wavelength in depth, as 95% of the energy density is propagated within the one wavelength, with the rest within one-to-two wavelengths. Therefore, the amplitude of the measurable energy decreases exponentially beyond one wavelength.
For the measurement on clay between columns in Figure 5, a growing effective region will begin to include nearby columns, leading to an increase in phase velocity as the wavelength increases. The volume of the effective region in relation to the volume of column inclusion was then calculated.
[image:7.612.93.513.144.432.2](a) (b)
Figure 5: (a) The phase velocities consistent across reliable wavelengths between 3.5 cm and 21 cm due to unchanged soil properties, and (b) The phase velocities sharply decreased between wavelengths 3.5 cm and 10 cm due to the
ellipse begins to encroach into the surrounding clay.
8. Conclusion
The feasibility of using surface wave testing for the assessment of stone columns has been demonstrated. A laboratory experiment scaled from a typical stone column site was carried out using soft, remoulded clay and gravelly sand columns, both of which are materials with known physical properties and therefore allows detailed evaluation and comparison. The Rayleigh wave velocities measured for the soft, remoulded clay before column installation was 50 m/s and is in agreement with the literature. The measured phase velocities for clay had an average value of 50 m/s, and for the gravelly sand column, the average phase velocity measured was 138 m/s.
Another important finding in this study is that the Rayleigh wave phase velocity is not only dependent on the depth but also the horizontal spans of the soil properties. Thus, the depth and horizontal spans could be used to identify the effective sampling volume. As a result, the dispersive curve could be estimated via the relationship between the soil properties encapsulated by the sampling volume for each wavelength, and comparing this with the actual measured result to evaluate the quality of the stone columns under investigation.
9. Acknowledgements
The authors would like to thank the University of Tun Hussein Onn, Malaysia, and the Ministry of Higher Education, Malaysia, for their generous sponsorship of this research.
10. References
[1] Abbiss, C.P. 1981. Shear wave measurements of the elasticity of the ground. Géotechnique, 31(1): 91-104.
[2] Addo, K.O. and Robertson, P.K. 1992. Shear-wave velocity measurement of soils using Rayleigh waves. Canadian Geotechnical Journal, 29(4): 558-568.
[3] Charles, J.A. and Watts, K.S. 2002. Treated ground engineering properties and performance. Construction Industry Research and Information Association, ClRlA C572, London.
[4] Clayton, C.R.I. 2011. Stiffness at small strain: research and practice. Géotechnique, 61 (1): 5-37.
[5] Forbriger, T. 2003. Inversion of shallow-seismic wavefields: II. Inferring subsurface properties from wavefield transforms. Geophysical Journal International, 153(3): 735-752.
[6] Jefferson, I., O’Hara-Dhand, K.A. and Serridge, C.J. 2008. Assessment of the ground improvement of problematical soils. In Proc. of 3rd Int. Conf. on Site Characterization. Taipei, Taiwan April 2008, Expanded Abstracts.
[7] Matthews M.C., Hope V.S. and Clayton C.R.I. 1995. The geotechnical value of ground stiffness determined using seismic methods. Geological Society, London, Engineering Geology Special Publication, 12: 113-123.
[8] Matthews, M.C., Hope, Y.S. and Clayton, C.R.I. 1996. The use of surface waves in the determination of ground stiffness profiles. Proceedings of the Institution of Civil Engineers Geotechnical Engineering, 119: 84-95.
[9] Moxhay, A.L., Tinsley, R.D. and Sutton J.A. 2001. Monitoring of soil stiffness during ground improvement using seismic surface waves. Ground Engineering Magazine, January: 34-37.
[10] Nasseri-Moghaddam, A. 2006. Study of the effect of lateral inhomogeneties on the propagation of Rayleigh waves in an elastic medium. Unpublished PhD thesis. University of Waterloo.
[11] Omar, M.N., Abbiss, C.P., Taha, M.R. and Mohd Nayan, K.A. 2010. Prediction of long-term settlement of soft clay using the continuous surface wave method and damping measurement. In 8th International Conference in Geotechnical and Transportation Geotropika 2010, Sabah 1-3 December 2010.
comparisons on ground improvements using stiffness, seismic waves and traditional methods. In Proc. 6th International Conference on Case Histories in Geotechnical Engineering, Arlington, VA, 11-16 August 2008, Expanded Abstracts.