Journal of Chemical and Pharmaceutical Research, 2012, 4(5):2475-2482
Research Article
ISSN : 0975-7384
CODEN(USA) : JCPRC5
Semiconducting behavior and thermokinetic study of terpolymeric resin-i
derived from p-hydroxybenzaldehyde, thiourea and ethylene glycol
Amit N. Gupta
1,Vinay V. Hiwase
2, Ashok B. Kalambe
11
Institute of Science, Rashtrasant Tukdoji Maharaj Nagpur University, Nagpur, India
2
Arts, Commerce and Science College, Arvi, Wardha, India
______________________________________________________________________________
ABSTRACT
Resin abbreviated as HBTE-I was synthesized by polycondensation in presence of PPA using p-hydroxybenzaldehyde (0.1 M), thiourea (0.1 M) and ethylene glycol (0.3 M). The structure of resin was assigned by elemental analysis, IR, NMR spectroscopy. Resin was found to show semiconducting behavior in the temperature range 303 K to 468 K. The activation energy of conduction was found to be 2294.3 J mol-1. The thermokinetic parameters were determined by Freeman-Carroll (FC) and Sharp- Wentworth (SW) method in temperature range 215 - 6250C. The thermokinetic parameters calculated with aid of these methods were found to be in good agreement.
Keywords: Electrical conductivity, Semiconductor, Thermal analysis, Terpolymeric resin, Thermal stability.
______________________________________________________________________________
INTRODUCTION
The use of terpolymers in all spheres of life has been abundantly increased in recent years because of its novelty and versatility. Electrically conducting properties of terpolymers are one of the centre point of current interest in solid state physics and chemistry. Terpolymer resins are well known for their behavior as semiconductors. Semiconductors are the most important part of modern electronics, including computers, rechargeable batteries, light-emitting diodes, molecular sensors, cell phones, digital assistants, packaging devices etc.
The thermal degradation study of polymers has become a subject of recent interest. In order to synthesize polymers having numerous practical applications, there is need to investigate the effect of heat on the polymers in order to establish their thermal stability. The thermal stability of the polymer was evaluated by thermogravimetry. The study of thermal behavior of polymers in air at different temperature provides important information about its practical applicability.
In earlier communication numbers of studies on terpolymers have been reported in the literature [1-15]. In our laboratory, extensive research work has been carried out and reported on synthesis, characterization, thermal degradation, electrical conductivity of various terpolymers [16-22].
EXPERIMENTAL SECTION
Chemicals
All chemicals used as starting materials in the synthesis of terpolymer resin were of AR, or chemically pure grade. The Chemicals such as p-hydroxybenzaldehyde, thiourea, ethylene glycol, polyphosphoric acid were obtained from s.d. Fine chemicals Lid (Mumbai).
Synthesis of HBTE-I terpolymeric resin
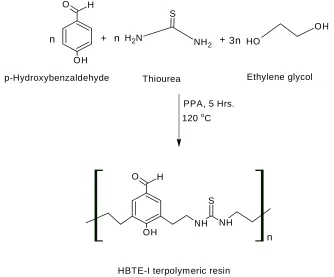
A terpolymer resin HBTE-I was synthesized by Polycondensation of p-hydroxybenzaldehyde, thiourea with ethylene glycol in the presence of polyphosphoric acid as a catalyst with molar proportion 1:1:3 of reacting monomers at 1200C for 5 hrs. To a well-stirred and ice-cooled mixture of p-hydroxybenzaldehyde (0.1 M), thiourea (0.1 M) and ethylene glycol (0.3 M), polyphosphoric acid (PPA, 20 gm) was added slowly with continuous stirring as a catalyst. The reaction mixture was left at room temperature for 30 min and heated on an oil bath at 1200C for 5 hrs. The reaction mixture was than cooled, poured on crushed ice and left over night. A brown solid was separated out. It was collected by filtration and washed with cold water and hot water several time to remove unreacted acid and monomer. Yield was found to be 77 %. The scheme of synthesis is shown in fig 1.
O H
OH
N
H2 NH
2 S
O H
OH
O H
OH
NH NH
S
n
n + n +3n
PPA, 5 Hrs.
120 oC
p-Hydroxybenzaldehyde Thiourea Ethylene glycol
[image:2.595.133.467.297.574.2]HBTE-I terpolymeric resin
Fig-1 Synthesis scheme of HBTE-I terpolymeric resin
RESULTS AND DISCUSSION
Elemental analysis
The terpolymeric resin was subjected to elemental analysis for C, H, N, S at CIMFR Unit, Nagpur, India, by Analytical functional testing Vario MICRO CHN elemental analyzer (Germany), Serial number-11083059. The elemental analysis is presented in following table 1.
Table 1 Elemental analysis of HBTE-I terpolymeric resin
Terpolymeric resin C H N S
FTIR Spectrum
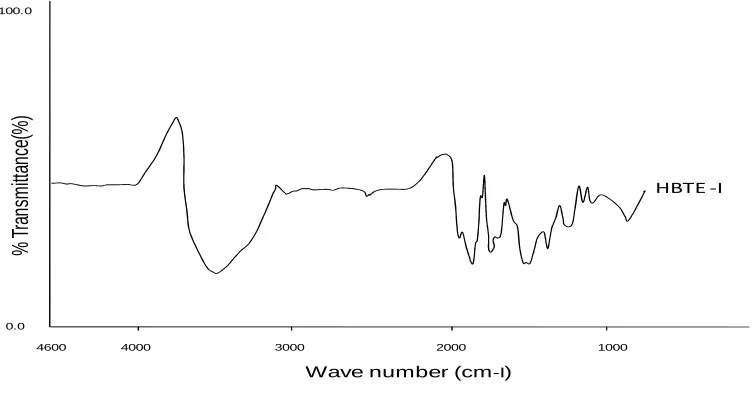
IR spectra of synthesized terpolymeric resin was recorded at Department of pharmacy, RTM Nagpur University, India, using FT-IR spectrometer Shimadzu, model no. 8101A. An infrared spectrum of terpolymeric resin was recorded in spectrophotometer in the range of 4600 – 500 cm-1. The IR-spectra of HBTE-I terpolymeric resin is presented in Fig.2 and the IR-spectrum data are presented in table 2.
A broad absorption band appeared in the region 3400-3430 cm-1 was assigned to the stretching vibrations of phenolic hydroxyl (-OH) group exhibiting intermolecular hydrogen bonding [23]. The presence of peaks at 2748, 2920 cm-1 may be due to the –C-H- stretch in the aldehyde (doublet due to Fermi resonance). A peak at 1651 cm-1 may be due to C=O band (aldehyde). The presence of peak at 1600 cm-1 due to aromatic-ring. The N-H bending and C-N stretching bands at 1560 cm-1 could also be observed [24]. A sharp medium peak at 1491 cm-1 may be ascribed to N-H bending of secondary amide group [25]. A peak appeared at 1462 cm-1 is due to methylene bridge coupled with aromatic ring. A peak appeared at 1381 cm-1 can be assigned to in plane bending vibration of phenolic –OH [26]. 1344 cm-1 may be due to aldehyde C-H bend. 1, 2, 3, 5- tetra substitution of aromatic ring was assigned due to the peaks at 1220, 1095 and 973 cm-1[27]. A strong peak appeared at 1200 cm-1 may be due to C=S stretching vibration [28-29]. The presence of peak at 830 cm-1 due to the -CH2-(wagging) [30].
%
T
ra
ns
m
itt
an
ce
(%
)
0.0 100.0
Wave number (cm-I)
4600 4000 3000 2000 1000
HBTE -I
[image:3.595.95.472.300.502.2]Fig.2. IR spectra of HBTE-I terpolymeric resin
Table 2 IR spectrum data of HBTE-I terpolymeric resin
Observed frequency (cm-1) Assignment
3435 Phenolic –OH group with intermolecular polymeric association 2748, 2920 C-H streching in aldehyde (doublet due to Fermi resonance)
1655 C=O band (aldehyde) 1603 Aromatic-ring
1560 N-H bending and C-N stretching band 1508 N-H bending – secondary amide 1462 CH2 bending bridge
1381 Phenolic –OH in plane bending 1344 Aldehydic C-H bending
1220,1095, 973 1,2,3,5 tetra substituted aromatic ring 1200 C=S stretching vibration
831 -CH2-wagging
Electrical conductivity
The resistance value of the pallet of polymer ranging from 303 K to 468 K were converted into conductivity value (σ) by taking into the account the thickness of the pallet and its diameter and evaluating thickness area parameters of the pallet of a terpolymeric resin. The temperature dependence of the electrical conductivity of the polymer has been shown in fig 3. The magnitude of activation energy depends on the number of electrons present in semiconducting material. Generally polymers containing aromatic nuclei in the backbone exhibit lower activation energy than those with aliphatic system. Thus, the lower magnitude of activation energy in HBTE-I terpolymeric resin may be due to the presence of large number of π-electrons in the polymer. This is good agreement with the most probable structure proposed for the newly synthesized resin under investigation. The values of electrical conductivity (σ) were obtained from the resistivity values (σ=1/ρ). The electrical conductivity varies exponentially with the absolute temperature according to the well know relationship
σ= σo exp.(-Ea/KT)
where, σ= Electrical conductivity at temperature T
σo = Electrical conductivity at temperature T→σ∞ i.e., constant. Ea= Activation energy of electrical conductance
K= Boltzmann constant T= Absolute temperature
The electrical activation energy (Ea) of electrical conductance calculated from the slope of the plot between log σ
versus 1/T [fig.3] and is found to be 2294.3 Jmol-1. The temperature dependence of electrical conductivity shows that conductivity increases with temperature. As the conductivity is found very low, it indicates that HBTE-I have low charge carrier intra molecular transfer. This indicates the semiconducting nature of the HBTE-I terpolymeric resin.
-0.7 -0.6 -0.5 -0.4 -0.3 -0.2 -0.1 0
0 0.0005 0.001 0.0015 0.002 0.0025 0.003 0.0035
1/T
lo
g σ
Fig.3. Wilson’s plot of HBTE-I terpolmeric resin
Thermo gravimetric analysis
The thermogram of HBTE –I terpolymeric resin was recorded at Dept. of Material Science, VNIT, Nagpur, India, using Perkin Elmer Diamond TGA/DTA analyzer. Thermokinetic parameters of HBTE-I were determined by using Freeman- Carroll and Sharp-Wentworth methods. To provide evidence regarding the degradation system of analyzed compounds, we derived the TG curves by applying an analytical method proposed by Freeman- Carroll [31] and Sharp-Wentworth [32].
The straight line equation derived by Freeman and Carroll which is in the form of
)
1
.(
...
log
)
/
1
(
.
303
.
2
log
/
log
Wr
T
R
Ea
n
Wr
dt
dw
∆
∆
−
=
∆
Where
dw/dt = rate of change of weight with time
Wr = Wc-W
Wc = Weight loss at completion of reaction W = Total weight loss up to time t
Ea = Energy of activation n = Order of reaction
Fig.4. Thermogram of HBTE-I terpolymeric resin
The plot of
Wr
dt
dw
log
/
log
∆
∆
vs
Wr
T
log
/
1
∆
∆
gives a straight line, from slope, energy of activation (Ea)
can be determined, with the help of intercept order of reaction (n) can be obtained.
Also using equation by Sharp and Wentworth
)
2
...(
...
303
.
2
log
)
1
(
)
/
(
log
RT
Ea
A
dt
d
n
=
−
−
α
β
α
Where,
dα/dt = Rate of change of fraction of weight with change in temperature
By plotting the graph between log
d
dt
n)
1
(
/
log
α
α
−
vsT
1
we obtained the straight line which give energy of
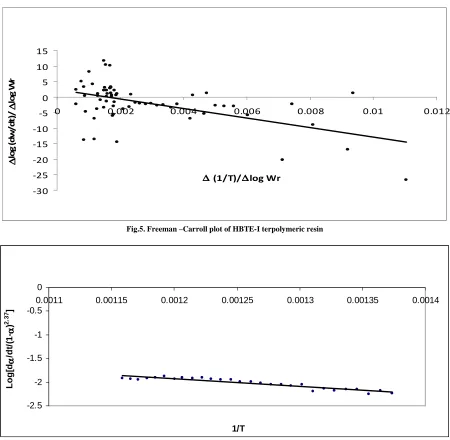
activation (Ea) from its slope and frequency factor (A) can be evaluated from intercept. The change in entropy (∆S), change in free energy (∆G) can also be calculated by further calculations. The polymeric sample was allowed to heat up to 8950C at linear heating rate of 10oC min-1. The thermogram reveals that initial weight loss up to 1250Cdue to loss of water. The decomposition of resin between 215-6250C was studied .FC and SW plots are shown in fig 5 and fig 6 respectively.
The order of decomposition obtained by FC method was found to be 2.37 which was further confirmed by SW method and thermokinetic parameters are tabulated in table 3. Thermal activation energies of degradation were found to be 29.45 KJ (FC method) and 31.96 KJ (SW method).
-30 -25 -20 -15 -10 -5 0 5 10 15
0 0.002 0.004 0.006 0.008 0.01 0.012
∆ ∆∆
∆ (1/T)/∆∆∆∆log Wr
∆∆∆∆
lo
g
(
d
w
/
d
t)
/∆∆∆∆
lo
g
W
[image:6.595.73.523.249.689.2]r
Fig.5. Freeman –Carroll plot of HBTE-I terpolymeric resin
-2.5 -2 -1.5 -1 -0.5 0
0.0011 0.00115 0.0012 0.00125 0.0013 0.00135 0.0014
1/T
L
o
g
[dαααα
/d
t/
(1
-αααα
)
2
.3
7 ]
Table 3. ThermokineticParameters of HBTE-I Terpolymeric resin
Parameters FC method SW method Thermal activation energy, Ea(KJ) 29.45 31.96 Frequency factor, A(min-1) 12.23 12.00
Apparent entropy, ∆S(J/K) -230.96 -231.31 Free energy, ∆G (KJ) 189.51 189.25 Order of degradation, (n) 2.37 2.37 FC method = Freeman-Carroll method, SW method = Sharp-Wentworth method
CONCLUSION
The results so obtained reveals following important conclusions
1) The elemental analysis and IR spectrum data are in good agreement with assigned tentative structure of HBTE-I terpolymeric resin.
2) The plot of log σ versus 1/T found linear in the given temperature range shows that Wilson’s exponential law obeyed. Hence show semiconducting behavior.
3) The electrical conduction which may be due to π electrons content due to presence of aromatic rings and unsaturation of C=O and C=S in the polymeric matrix
4) The thermal activation energy, entropy and free energy determined by Freeman-Carroll and Sharp-Wentworth methods are in good agreement.
5) The high value of energy of activation energy and low value of frequency factor of thermal degradation indicate that resin is thermally stable below 2150C.
6) The order of degradation obtained by FC method is confirmed by SW method. The fractional order (2.37) is attributed to solid state degradation.
Acknowledgement
The Authors are thankful to the Director Dr. M.T.Bharambe, Institute of Science, Nagpur. We are also grateful Dr.R.H.Limsey, Head Department of chemistry, Institute of Science, Nagpur, for providing laboratory facilities. We are thankful to CIMFR unit, Nagpur, for elemental analysis of sample and Pharmacy Department, R.T.M. Nagpur University, for FTIR spectrum.
REFERENCES
[1] W.B.Gurnule and D.P.Patle, Der Pharmacia Letter, 2011, 3(6), 250-256.
[2] S.M.yousaf, S.Taj, Z.Ahmad and F.A.Khawaja, Iranian Polymer Journal, 1998, 7(2) 79-82
[3]M.Revanasiddapp, S.Khasim, S.C.Raghavendra, C.Basavaraja,T.Suresh and S.D.Angadi, E-journal of chemistry,
2008, 5(4), 797-801.
[4] D.T.Masram, K.P.Kariya and N.S.Bhave, Archives of applied science research, 2010, 2(2), 153-161. [5] S.S.Rahangdale and W.B.Gurnule, Archives of applied science research, 2010, 2(6), 53-58.
[6] R.N.Singru, Der pharmacia letter, 2011, 3(6), 198-209. [7] R.N.Singru, Der Pharmacia lettre, 2011, 3(5), 123-127.
[8] R.N.Singru, A.B.Zade and W.B.Gurnule, E-journal of chemistry, 2009,6(S1), S171-S182. [9] R.N.Singru, J.Chem.Pharm.Res., 2012, 4(1), 46-53.
[10]R.N.Singru, V.A.Khati, W.B.Gurnule, A.B.Zade, J.R.Dontulwar, Analytical and Bioanalytical electrochemistry,
2011, 3(1), 67-86
[11] R.N.Singru, Der pharma chemica, 2011, 3(5),128-134.
[12] S.S.Rahangdale and W.B.Gurnule, Der pharma chemica, 2011, 3(4), 314-322. [13] R.N.Singru, Archives of applied science research, 2011, 3(5), 309-325. [14] D.T.Masram, E-journal of chemistry, 2009, 6(3), 830-834.
[15] S.S.Butoliya, W.B.Gurnule and A.B.Zade, E-journal of chemistry, 2010,7(3),1101-1107.
[16] V.V.Hiwase, A.B.Kalambe, K.M.Khedkar,S.D.Deosarkar, E-Journal of chemistry, 2010, 7(1), 287-294. [17] V.V.Hiwase, A.B.Kalambe,S.S.Umare,K.M.Khedkar, Acta Ciencia Indica,2007,XXXIII C(4),615-622. [18] K.P.Dharkar, S.S.Ingle,A.B.Kalambe, E-Journal of chemistry,2011,8(1),127-130.
[21] A.D.Kushwaha,V.V.Hiwase and A.B.Kalambe, Der Pharma Chemica, 2012, 4(1), 557-567. [22] S.K.Kapse, V.V.Hiwase and A.B.Kalambe, J.Chem.Pharm.Res., 2012, 4(3), 1734-1739. [23] T.K.Pal, R.B.Kharat, J.Ind.chem.Soc., 1989, 66, 283-286.
[24] H.Toiserkani, Open J.of Polym.Chem., 2011, 1, 1-9. doi;10.4236/ojpchem.2011.11001 [25] H.B.Pancholi, M.M.Patel, High Perform.Polym., 1991, 3, 25-31.
[26] W.B.Gurnule, P.K.Rahangdale, L.J.Paliwal, R.B.Kharat, React.Funct.Polym, 2003, 55, 255- 265. [27] R.K.Samal, B.K.Senapati, T.B.Behuray, J.Appl.Polym.Sci., 1966, 62, 655-660.
[28] T.K.Pal, R.B.Kharat, Angew.Makromol.Chemie, 1989,113, 55-68.
[29] M.Karunakaran, C.T.Vijayakumar, C.Magesh, T.Amudha, International Journal of Engineering Science and
Technology, 2011, 3(1), 162-176.
[30] R.M.Silverstein, F.X.Webster, Spectrometric Identification of organic compounds, John wiley and sons, Inc. Printed in New York, 6th Ed.1996, 97-139.
[31] E.S.Freeman and B.Carroll, J.Phy.Chem, 1958, 62, 394-397