Measurement of Optical Parameters and Electrical
Conductivity for Determining the Quality of Besuki
Local Honey Using Spectrophotometer
Misto1,*, Tri Mulyono2, Bowo Eko Cahyono1, Eka Agustina Wulandari1
1
Department of Physics, University of Jember, Indonesia
2
Department of Chemistry, University of Jember, Indonesia
Copyright©2019 by authors, all rights reserved. Authors agree that this article remains permanently open access under the terms of the Creative Commons Attribution License 4.0 International License
Abstract
Honey is one of the foods that have been found in the world, consisting of natural sweet liquids, derived from flowers collected by honey bees. Honey is made from a mixture of complex, airborne, and most minor components that can be susceptible to counterfeiting. The components of honey can also be used by excessive storage for the manufacturing process or with inadequate storage. Determining the quality of honey is an important factor for producers. This study determines the quality of local honey based on optical parameter values. Determination of honey quality is based on optical parameters using a spectrophotometer to measure absorbance. From this absorbance it is used to determine: color at 560 nm, diastase number at 620 nm, sugar content at 500 nm, fructose content at 518 nm, invertase at 400 nm, and HMF at 284nm. All measurements were carried out using a spectrophotometer. The results of this measurement then compare the European (EC) and Indonesian quality (SNI) quality regulations.Keywords
Honey, Spectrophotometer, Absorbance, Quality1. Introduction
Honey is one of the oldest foods ever found in the world, derived from flower nectar collected by honey bees. According to the Indonesian National Standard (SNI), honey is sweet produced by honey bees (Apis sp.), from plant nectar. According to Codex Alimentarius (2001), honey is a sweet substance produced by honey bees, which comes from flower nectar or from the secretions of plants collected by bees. Honey can undergo changes in
shape and contain certain compounds derived from the body of the bee, then be stored in the honeycomb to undergo a process of maturation.
Besuki and its surrounding area is an area famous for its plantation area where there are two national parks, Baluran and Merubetiri. The flora and fauna are quite extensive so that this area is suitable for occupying honey-producing wasps and flower-producing plants that have the potential to produce honey. The potential of this region as a producer of honey is quite large but unfortunately honey that is here is cultivated by residents individually whose production is not labeled, without which production can be identified and directly circulated to other regions (Setiyorini, 2014).
The types of honeys produced from this regional wasp are Kelengkeng honey, Kaliandra honey, Randu honey, Rambutan honey, Kopi honey, Mahogany honey, and Karet honey. Until now there has been no study of the content and quality of honey from this region so that honey products are sold cheaply to the surrounding area. However, a large amount of funds is needed to study the quality of regional honey here. There have been no studies that reveal this quality resulting in honey in this area not being raised economically at the regional or the national level (Bagus, 2013).
sugar content, fructose content, diastase number invertase, hydroxymethylfurfal (HMF) content, and electrical conductivity. Other parameters used to determine honey include moisture which is water insoluble and acid free. Nectar from different plants has different nutrient content, which can affect the natural composition of honey (Huang, 2015).
Honey color according to the mmPfund scale (Frasco, 2018) can be determined using absorption numbers at a wavelength of 560 nm, diastase numbers using a wavelength of 620 nm, the content of fructose and sucrose each using 512 nm and 500 nm wavelengths, invertase using a wavelength of 400 nm, and HMF content using wavelengths of 336 nm and 284 nm, these parameters are spectrometry (Kusuma et al., 2006). Therefore the determination of the quality of honey is enough to measure the absorbance in the wavelength regions of 620 nm, 560 nm, 518 nm, 500 nm, 400 nm, 336 nm and 284 nm (Frasco, 2018). As for electrical conductivity parameters are additional measurements.
The value of the quality parameters is then compared with the national and international draft standards to determine the quality of the honey in question. This honey quality study is very important considering that so far there has been no research on the quality study of this area.
An understanding of the parameter values of Besuki honey is important in recognizing the quality of honey from the national park area of Beru Betiri which is rich with flora and fauna. Honey with the same nectar sources from this region is not necessarily inferior to honey from other regions even though it is from the same wasp species. The quality of honey can be influenced by the background of the area of plant nectar originating. Therefore this study is very helpful for related parties such as Beru Betiri national park manager, local government and researchers from nearby universities.
This study aims to reveal the physical and chemical properties of monoflora honey through optical measurements (absorption numbers) and electrical properties including color, diastase number, sugar content, fructose content, invertase, hydroxymethylfurfal (HMF) content from Besuki honey and its surroundings so that it can become a reference in writing the nutritional content on the label, and become one of the promotional tools for honey so that honey marketing is broader and more appropriate in its utilization.
2. Materials and Methods
The material used is honey from the Besuki region and its surroundings. Chemicals for analysis of levels of HMF (hydroxymethyl-furaldehyde), antioxidants, and NaOH, the tools used were the AMV11 UV-VIS Spectrophotometer with sources in the wavelength region (190-1100) nm. The schematic diagram of spectrophotometer is shown in Fig. 1.
The color measurement of honey uses the widely used Pfund color scale which compares honey with amber glass slices and measurements are combined in standard materials. The determination of honey color using the Pfund scale according to the USDA classification is shown in Table 1. The Pfund scale is derived from the use of a color scale measured based on the honey distance the slices are moved to make a match, and expressed in millimeters (mm). The color of honey can be determined on the Pfund scale using a spectrophotometer by measuring the absorption rate of pure honey samples at a wavelength of 635 nm and multiplying by a factor of 371.39 and minus 38.70, or using equations (Biochrom, 2008).
mmPfund = -38,70 + 371,39 A635 nm (1)
Detector Sample
Exit Slit Dispersion
Device Entrance
Slit Source
[image:2.595.130.468.519.699.2]Monochromator
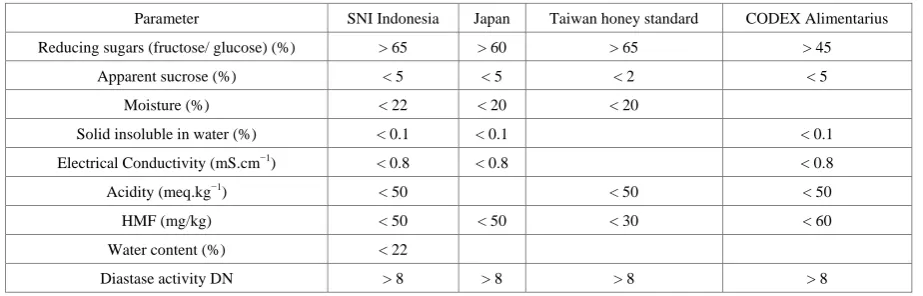
Table 1. The values of several Honey parameters based on four different standards
Parameter SNI Indonesia Japan Taiwan honey standard CODEX Alimentarius
Reducing sugars (fructose/ glucose) (%) > 65 > 60 > 65 > 45
Apparent sucrose (%) < 5 < 5 < 2 < 5
Moisture (%) < 22 < 20 < 20
Solid insoluble in water (%) < 0.1 < 0.1 < 0.1
Electrical Conductivity (mS.cm−1) < 0.8 < 0.8 < 0.8
Acidity (meq.kg−1) < 50 < 50 < 50
HMF (mg/kg) < 50 < 50 < 30 < 60
Water content (%) < 22
Diastase activity DN > 8 > 8 > 8 > 8
2.1. Diastase Number (DN)
DN is defined as the total gram of starch hydrolyzed in 1 hour at 37 ° C per 1 gram of honey. DN is contained by honey along with sucrose, fructose, glucose, protein and minerals. This enzyme helps convert starch into maltose given by bees when honey is formed. In honey, diastase activity is very sensitive to changes in temperature during storage, therefore it is necessary to control the temperature of storage and processing time. Decrease in diastase from honey is an important quality indicator, although naturally the variable in honey depends on the source of interest.
International Standards (SNI Indonesia, Japan Standard, Taiwan Standard, and Codex) have determined the lower limit for diastase activity; no less than 8 DN units. The DN value is based on the reference definition of diastase numbers from the International Honey Commission following the equation as: (Frasco, 2018)
DN = (28.2 x changes in absorbance at 620nm after 10 minutes) + 2.64 (2)
2.2. Sugar Content (Glukosa and Fructose)
Analysis of individual sugars can produce valuable information about the source and origin of flowers. For sugar, this depends on the original interest and therefore can be useful for coordination with training (Frasco, 2018). The glucose content was analyzed using glucose oxidase and 4-aminofenazon, and measured A500 (ab-sorbansi at a wavelength of 500nm). The fructose content was analyzed using the fructose method reacted with tryp-tamine in HCl, at 60 ° C, with completion in 60 minutes. This test is read on absorbance at a wave length of 518 nm (A518) and shows very low interference from other sugars (Frasco, 2018).
2.3. Invertase
To get the invertase value, this enzyme is also susceptible to heating and storage factors so it can be used also as an indicator of quality. It was analyzed using the p-nitrophenyl-D-glucopyranoside substrate, with a
measurement of absorbance of A400 (at a wavelength of 400 nm) (Frasco, 2018).
2.4. Hydroxymethylfultural (HMF) Content in Honey
The hydroxymethylfultural content in honey solution for HMF determination can be done using UV-Vis spectrophotometer with the White method involves measuring the absorbance of the honey solution at a wavelength of 284 nm previously clarified by a reference solution in which HMF chromophore was destroyed by bisulfite. The HMF content of honey is then calculated using the following equation (Frasco, 2018).
( 284 336)
m
A A M 1000 100
HMF content (mg/kg, honey)=
W A
− × × ×
(3) W = weight in gram of the honey sample and
M = molecular weight of HMF
Am = Molar absorptivity of HMF at 284 nm
2.5. Water Content
Variations in water content in honey are influenced by botanical origin, natural conditions, storage conditions, and processing methods (Bognadov, 2008). Humidity affects honey properties such as viscosity, crystallization, dissolution, color, and aroma (Tiwari, 2013). To get the content of the content in honey samples, the method is as follows. The sample is weighed as much as 1-2 grams and put in a weighing bottle that has known weight. The sample was put into the oven at a temperature of 105-110o C for 2 hours. After that the sample is cooled in the desiccator for 10 minutes then weighed and put into the oven again for 1 hour. The sample was cooled in the desiccator for 10 minutes then weighed again. Repeated heating in the oven and weighing to a constant weight (successive weighing difference of 0.2 mg) then calculated the water content, using the following equation:
initial weight-final weight water content = 100 %
initial weight ×
2.6. Electrical Conductivity
Electrical conductivity was determined at 20.0 C in solutions for deionized water with specific electrical conductivity (σ) <1 µS / cm using a method in the following:
Electrical conductivity is a parameter that is mainly used to measure mineral levels, which may be an indication of environmental, geographical and botanical pollution of the origin of honey (Yanada, 2014). Sensory properties of honey, such as color and taste, are very closely related to mineral content which is important in commercializing honey. The electrical properties (conductivity) of the sample depend on the presence of ions, proteins and organic acids in honey. Determination of these parameters is based on the measure of electrical resistivity ρ, which is measured by measuring the resistance R and is the opposite of electrical conductivity σ, Yadata (2014)
L R
A ρ
= (4) Electrical conductivity σ can be determined by equation
1
σ ρ
= (5) L and A are the length and cross-sectional area of the sample container
3. Results and Discussions
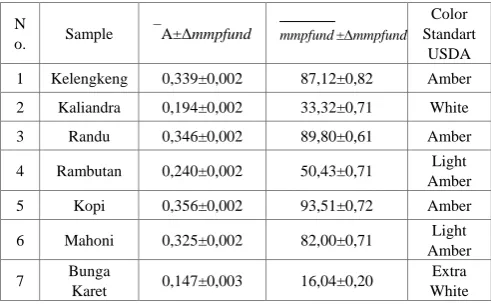
[image:4.595.51.297.525.677.2]The sample of honey is fresh honey from flower nectar from Besuki region, East Java. The results of honey color measurements are based on the mmPfund scale through measurements of absorbance at 635 nm wavelength and through the formulation of colors obtained as shown in Table 2.
Table 2. Conversion values of absorbance (A) to mm pfund for five types of local honey at λ= 635nmnm
N
o. Sample A±Δmmpfund
Color Standart
USDA
1 Kelengkeng 0,339±0,002 87,12±0,82 Amber
2 Kaliandra 0,194±0,002 33,32±0,71 White
3 Randu 0,346±0,002 89,80±0,61 Amber
4 Rambutan 0,240±0,002 50,43±0,71 Light
Amber
5 Kopi 0,356±0,002 93,51±0,72 Amber
6 Mahoni 0,325±0,002 82,00±0,71 Light
Amber
7 Bunga
Karet 0,147±0,003 16,04±0,20
Extra White
Bright honey contains more sugar than dark honey, because it contains many phenolic components compared to bright honey (Eleazu et al., 2013). According to Anklam (2001), dark honey tends to contain more minerals than light ones, colors, ranging from transparent white to water to dark colors, honey, and honey are important components for consumers, but honey is often judged by color. Usually, honey with darker color is light colored. Light-colored honey generally has an unpleasant taste. Color can also be a quality indicator because honey becomes darker with longer storage and higher temperatures. In addition, the color of honey is influenced by nectar which is the source of honey, the length of storage and processing or heating (Eleazu et al., 2013).
The color of honey generally ranges from light yellow, dark yellow or black Bogdanov et al. (2008). In the honey samples studied, the colors ranged from light amber to Karet flower honey to amber for Kelengkeng honey and Kopi honey. The highest Pfund value studied was Kopi honey (93.51 ± 0.72) and the lowest was Karet flower honey (16.04 ± 0.20). The Pfund values of Kelengkeng, Randu, and Kopi honey were (87.12 ± 0.82), (89.80 ± 0.61) and (93.50 ± 0.72 respectively).
There were no significant color differences between all the types of honey studied: color differences can be attributed to the source of flowers of native nectar plants, mineral content, and high exposure to temperature or light (El-Metwally, 2015). Color classification of honey is very important for useful commercial activities.
The results of the analysis of karet honey water content were (22.60 ± 1.49)%. The honey water content value is not in accordance with SNI 3545: 2013 honey quality requirements, which is a maximum of 22%. The high water content in almost all honey (> 20%), allows honey to undergo fermentation. This situation is in accordance with the opinion of Bogdanov (2009) which states that honey containing water content higher than 20% will easily experience fermentation. The high water content in Kopi honey is probably due to the harvesting time done in the morning (Evahelda, 2017). In the morning, the environmental conditions of the air are still very cold which is characterized by the presence of dew. This condition will affect the honey water content, because honey has hygroscopic properties. When the honeycomb begins to be cut, it has been in contact with the surrounding air environment. This condition lasts during the process of squeezing, filtering to bottling, so that the honey can draw moisture from the surrounding air to reach equilibrium.
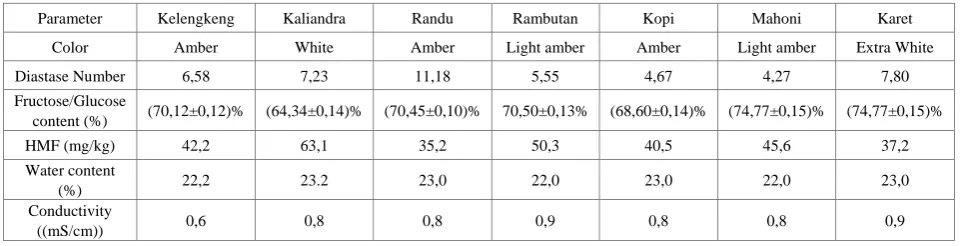
Table 3. Color and The physicochemical parameters of honey
Parameter Kelengkeng Kaliandra Randu Rambutan Kopi Mahoni Karet
Color Amber White Amber Light amber Amber Light amber Extra White
Diastase Number 6,58 7,23 11,18 5,55 4,67 4,27 7,80
Fructose/Glucose
content (%) (70,12±0,12)% (64,34±0,14)% (70,45±0,10)% 70,50±0,13% (68,60±0,14)% (74,77±0,15)% (74,77±0,15)%
HMF (mg/kg) 42,2 63,1 35,2 50,3 40,5 45,6 37,2
Water content
(%) 22,2 23.2 23,0 22,0 23,0 22,0 23,0
Conductivity
((mS/cm)) 0,6 0,8 0,8 0,9 0,8 0,8 0,9
The results of the content analysis showed that the HMF contents of Kaliandra honey and Rambutan honey were 63, 1 and 50.3 in mg / kg, respectively (Table 3). Based on Indonesian National Standard (SNI) 3545: 2013, the maximum HMF level in honey is 50 mg / kg. According to Al-Diab and Jarkas (2015), honey harvested naturally contains HMF even in relatively small amounts, namely 0.06 to 0.2 mg / 100 g honey. Freshly harvested honey usually has HMF content below 1 mg / kg but can continue to increase if the ambient temperature reaches 20° C. HMF content of honey is an indicator of the freshness and heating process carried out on honey, as well as the length of storage. The longer the storage, the HMF content will increase. This is due to the decomposition of glucose, fructose, and other monosaccharides which have six C atoms in an acidic atmosphere, and are accelerated with the help of heat. This reaction will then produce formic acid and levulinate (Anjana et al., 2014).
The main components of honey are sugar and water. The dominant types of sugar are glucose and fructose around 60–80%, 10–20% water, and other components such as organic acids, minerals, vitamins, proteins, enzymes, volatile components, and flavonoids. The total sugar in all honey is above 60% (Table 1). Based on the Indonesian National Standard (SNI) 3545: 2013, reducing sugar levels (calculated as glucose) is at least 65%. The high sugar content will cause honey to become concentrated or thick, so that honey has hygroscopic properties. Hygroscopic properties of honey are determined by fructose. This is because fructose is more soluble than glucose (Evahelda, 2017). High sugar content will also affect the taste and shelf life of honey. The sweet taste in honey is determined by the carbohydrate ratio it contains. Honey which has a higher fructose content generally has a sweeter taste. The shelf life of honey is influenced by sugar content. Honey sugar content causes honey to have osmotic properties, which can inhibit bacterial growth. In addition, honey which has a higher sugar content will be darker in color because it contains higher phenolic content compared to brightly colored ones (Eleazu et al., 2013).
Electrical conductivity is the main parameter for knowing mineral content, which can be an indication of environmental pollution, geographical origin and botanical honey (Tiwari, 2013). The mineral content is also
associated with sensory properties such as color and taste, which are important for the commercialization of honey. Electrical conductivity is related to the presence of ions, organic acids, and proteins in honey. Determination of these parameters is based on a measure of electrical resistance, which is the opposite of electrical conductivity. The electrical conductivity of honey samples is recommended by the Codex Alimentarius Committee, SNI Indonesia, and Japan Standart, a maximum value of 800 mS/cm (Sancho, 2008). From the seven types of observed honey, it was only kelengkeng honey which has an electrical conductivity less than 0.8 mS / cm.
4. Conclusions
Determination of honey quality based on optical parameters (absorbance) using a spectrophotometer to measure absorbance has been carried out. From this absorbance measurement it is used to determine: color at 635 nm wavelength, diastase number at 620 nm wavelength, sugar content at 500 nm wavelength, fructose content at 518 nm wavelength, invertase at 400 nm wavelength, and HMF at length 284nm wave. All measurements were carried out using a spectrophotometer. Determination of honey quality is obtained from the physical parameters of honey then compared to the quality standards set by the Indonesian National Standard and other Standards.
Acknowledgements
The authors thank the DRPM DIKTI Republic of Indonesia for financial support, under the scheme of Penelitian Strategis Nasional, Contract Number: 1821/UN25.3.1/LT/2019.
REFERENCES
Al-Diab, D. dan Jarkas, B. Effect of storage and thermal [1]
Latakia markets. Journal of Entomology and Zoology Studies 3(3): 328–334, 2015.
Anklam, E., & Radovic, B. Suitable analytical methods for [2]
determining the origin of European honey. American Laboratory, May, 60–64, 2001.
Biochrom. 2013. Measurement of Honey Quality. [Serial [3]
Online]. www.biochrom.co.uk. [02 Januari 2017].
Bognadov, S. 2008. Antibacterial Substances in Honey. [4]
Labensmittel Wissenchaft Und Technologie 30: 748-754
British Honey Company. 2016. Pfund Colour Scale. [Serial [5]
Online]. http://britishhoney.com/pfund-colour-scale/. [02 Januari 2017].
Daniel Frasco, Analysis of Honey Color and HMF Content [6]
using a Genesys UV-Visible Spectrophotometer, Thermo Fisher Scientific, Madison, WI, USA, 2018
Desissa Yadata (2014) Detection of the Electrical [7]
Conductivity and Acidity of Honey from Different Areas of Tepi, Food Science and Technology 2(5): 59-63, 2014,
Disbun-Jatim (2014) Lebah Madu RTSM Menuai Hasil - [8]
Dinas Perkebunan Prov. Jatim, Dinas Perkebunan Jawa Timur, http://www.disbun.jatimprov.go.id/berita.php?id=6 7.
Een Setiyorini (2014) Prospek Pengusahaan Ternak Lebah [9]
Madu di Desa Tempurejo Kecamatan Tempurejo Kabupaten Jember, UNEJ Repository, http://repository.une j.ac.id/.
E. Evahelda, F. Pratama, N. Malahayati, Budi Santoso, [10]
(2017) Sifat Fisik dan Kimia Madu dari Nektar Pohon Karet di Kabupaten Bangka Tengah, Indonesia, AGRITECH, Vol. 37, No. 4, November 2017, Hal. 363-368 DOI: http://doi.org/10.22146.
Eleazu, C. O.. Determination of the physico-chemical [11]
composition, microbial quality and free radical scavenging activities of some commercially sold honey samples in
Aba. Nigeria: ‘The effect of varying colours’. ISSN: 0976-9633., 2013.
EL-Metwally, A.A.E.,. Factors Affecting the Physical and [12]
Chemical Characteristics of Egyptian Beehoney. Ph. D. Thesis, Fac. Agric. Cairo Univ., 320p., 2015.
Fatmawati, N., Mustapit, Sofia, Faktor-Faktor Yang [13]
Mendasari Masyarakar Sekitar Taman Nasional Meru Betiri Dalam Mengeksploitasi Rafflesia Zollingeriana Kds, JSEP, Vol. 11, No.2. Juli 2018.
Gairola, A., Tiwari, P, and Tiwari, J. K.. Physico-chemical [14]
Properties of Apis cerana-indica F. Honey from Uttarkashi District of Uttarakhand, India. Journal Global Biosci 20-25, 2013.
Gowda, G. 2011. Management of Indian Bee Colonies. [15]
Department of Apiculture, UAS.
Huang, Z. 2015. Honey Bee Nutrition. Online available [16]
from http://www.extention.org/pages/28844/honey-bee-nut rition. 07 April 2016.
Liputan 6 (2019) Melihat Proses Budidaya Lebah Madu di [17]
Jember, Online available from https://www.liputan6.com/n ews/read/3891115/melihat-proses-budidaya-lebah-madu-di-jember.
M. Sancho, S. Muniategui, J. Huidobro, J Simal. [18]
Correlation between the electrical conductivity of honey in humid and in dry matter, Faculdad de Farmacia, Departamento de Quimica Analitica., 2008.
Purnamasari, N. dan Hilda, A. Pembandingan Fisikokimia [19]
Madu Pahit (Aktivitas Enzim Diastase, Gula Pereduksi, Keasaman, Cemaran Abu dan Arsen) dengan Madu Murni. Jurnal Farmasi. Universitas Islam Bandung, Bandung, 2015.
USDA Agricultural Marketing Service. United States [20]