Application of Nanopore of Solid Membrane for
Recognition of
fluorescent Pseudomonas
H. C. Joshi
1,*, K. P. Singh
1, Abhishek Tomar
2, Prashant Singh
31Membrane Biophysics and Nanobiosensor Research Laboratory, College of Basic Sciences and Humanities, G. B. Pant University of Agriculture and Technology, India
2Department of Electronics & Communication Engineering, G. B. Pant University of Agriculture & Technology, Pantnagar, India 3Department of Biotechnology, Bhimtal Campus, Kumaun University, India
Copyright©2017 by authors, all rights reserved. Authors agree that this article remains permanently open access under the terms of the Creative Commons Attribution License 4.0 International License
Abstract
The uses of biosensors for sensitive and specific detection of various analytes are of great importance, and its success is often dictated by the nature of the detection element (the specific ligand) and the choice of target analytes. The conventional agriculture caused considerable impacts on soils and waters. It is important to change certain agricultural managements to environmental cleaner techniques. The sustainable agriculture has pointed many approaches and techniques to reduce environmental impact. One of those strategies is the utilization of the soil microbiota to induce plant growth, control of plant diseases and biodegradation of xenobiotic compounds. Studies on the relationship between roots and microbiota are essential to achieve agricultural applications. These studies indicate that one of the most abundant microorganisms in the rhizosphere (area around the roots) is fluorescent Pseudomonas spp. They have been considered as an alternative to agrochemicals for controlling plant diseases and increasing plant development. In the present study gold coated polycarbonate membrane of pore size 100 nm was used. The coated membrane carries carboxylic, thiol and hydroxyl groups. Carboxylic groups are being activated by treating the coated nanoporous membrane with the NHS-EDC linker for the binding of antibodies against the pathogen (fluorescent Pseudomonas) to be detected. After the activation of the membrane, antibodies (which are generated against the fluorescent Pseudomonas)were immobilized over the membrane in the humid chamber. After leaving it for an hour, unbound antibodies were washed by Phosphate buffer Saline. The remaining sites on membrane were then blocked by the Bovine serum albumin. The membrane was then subjected for the detection of pathogen by the electrochemical immunosensor by observing the change in the impedance value. The characterization of such membrane was done by Fourier Transform Infrared Spectroscopy (FT-IR), Scanning Electron Microscopy (SEM), Energy Dispersive Spectroscopy (EDS) and Thermo gravimetric Analyzer (TGA).
Keywords
Antibody-Antigen (Ab-Ag), Gold (Au), Nanoporous Polycarbonate Track Etched (PCTE) Membrane, Fourier Transform Infrared Spectroscopy (FT-IR), Scanning Electron Microscopy (SEM), Energy Dispersive Spectroscopy (EDX/EDS)1. Introduction
The detection of biomolecules is a key to the prevention and identification of problems related to health and safety. Legislation is particularly tough in areas such as the food industry, where failure to detect an infection may have terrible consequences. In spite of the real need for obtaining analytical results from the shortest time possible, traditional and standard biomolecule detection.Thus, conventional techniques are not suitable for fast and direct analysis of bacteria without pre-enrichment. The analytical devices must have the specificity to distinguish between different bacteria, the adaptability to detect different analytes, the sensitivity to detect bacteria on-line and directly in real samples without pre-enrichment. Time and sensitivity of analysis are the most important limitations on the usefulness of microbiological testing. Effective screening of food samples requires a rapid, selective and highly sensitive analytical device. The presence of even a single pathogenic organism in the body or food may be an infectious dose. The device must also be simple and inexpensive to design and manufacture. These requirements are satisfied using biosensor technology [1].
diagnostics, food analysis, bioprocess and environmental monitoring [2].
Biosensors may be divided into four basic groups, depending on the method of signal transduction: optical, mass, electrochemical and thermal sensors [3]. In addition, biosensors can be classified into two broad categories: for direct detection of the target analyte and label-based sensors. Direct detection biosensors are designed in such a way that the biospecific reaction is directly determined in real time by measuring the physical changes induced by the formation of the complex. Label-based biosensors are those in which a preliminary biochemical reaction takes place and the products of that reaction are then detected by a sensor. Electrochemical biosensors have some advantages over other analytical systems in that they can operate in turbid media, offer comparable instrumental sensitivity, and more amenable to miniaturization. Modern electroanalytical techniques have very low detection limits (typically10-9 M) that can be achieved using small volumes (1± 20 mL) of samples [4]. Furthermore, the continuous response of an electrode system allows for on-line control. The equipment required for electrochemical analysis are simple and cheap compared to most other analytical techniques. Microbial Current studies focusing on electrochemical based transduction methods aim to achieve a more robust, easy to use, portable, and inexpensive analytical system.
Impedimetric biosensor follows either impedance (Z) or its components resistance (R) and capacitance (C). Microbial metabolism usually results in an increase in both conductance and capacitance, causing a decrease in impedance. Therefore, the concepts of impedance, conductance, capacitance and resistance are only different ways of monitoring the test system and are all inter-related [5]. The relationship between impedance (Z), resistance (R), capacitance (C), and frequency (f) for a resistor and a capacitor in series is expressed as follows: Z2=R2+ 1/(2pfC)2. Impedance usually is measured by a bridge circuit. Often a reference module is included to measure and exclude non-specific changes in the test module. The reference module serves as a control for temperature changes, evaporation, changes in amounts of dissolved gases, and degradation of culture medium during incubation. The impedance method was accepted by the Association of Official Analytical Chemists, Intl. (AOAC) as a first action method [6]. This method is well suited for detection of bacteria in clinical specimens, to monitor quality and detect specific food pathogens, also for industrial microbial process control, and for sanitation microbiology. This technique has been used for estimating microbial biomass, for detecting microbial metabolism and for detecting the concentration and physiological state of bacteria. Current instruments usually detect active metabolizing bacteria when 106–107 bacteria per ml are present in the culture media [7].
The procedure and method used to immobilize the recognition element either directly on the electrode surface or on other solid supports is a crucial step in the development
of an electrochemical immunosensor. Traditionally, electrochemical immunosensor were obtained by immobilizing the recognition element (either antibody or antigen) directly on the surface of the working electrode. To achieve a better presentation of the recognition element to the target analyte, the use of ordered layers on the surface of the electrode has been introduced. Another approach that has been recently proposed for the immobilization of recognition elements on the electrode surface involves the use of different polymeric matrices such as polysulfone (PSU) polymer, polycarbonate membrane (PCTE) and chitosan (CS). These matrices form porous networks with high mechanical strength that allow the reagents to reach the electrode [8]. Moreover, the presence of reactive amino and hydroxyl functional groups is well suited for biomolecule immobilization. For the improvement in performance of electrochemical biosensor, nanomaterials like carbon nanotubes, gold nanoparticles, and graphene is being used.
Many biosensors are affinity-based, meaning they use an immobilized capture probe that binds the molecule being sensed – the target or analyte – selectively, thus transferring the challenge of detecting a target in solution into detecting a change at a localized surface. This change can then be measured in a variety of ways. Electrical biosensors rely solely on the measurement of currents and/or voltages to detect binding [9]. Nowadays Immunosensor are widely used for the detection of bacterial, viral, microbial growth and biomolecule. During December 2006, fifteen fast food restaurants in the Philadelphia area were temporarily closed as a result of the biological pathogen Escherichia coli
(commonly known as E. coli) found in food products. Princeton University’s Dining Services was confirmed to have exposed more than a dozen students to Salmonella in May 2008.
Recent years have seen continued growth of the interdisciplinary field of biosensors due to an increased interest between basic and applied sciences researchers for development of novel electronic devices that can be utilized for a variety of applications including human health care and environmental monitoring [10]. The most promising applications of biosensors are situations where low cost, small instrument size, and speed of analysis are crucial, but cutting-edge accuracy and detection limits are not. Point-of-care diagnostics – a measurement and diagnosis at a bedside, in an ambulance, or during a clinic visit – are a promising application [11].
containing holes and pores) and it can be solid or liquid. The nano-pore has been extensively used to study the transport of ions, polymers (e.g., DNA, RNA), and proteins at molecular level and inter-and intra-cellular signaling mechanisms [12].
In 1953, polycarbonate was discovered by Dr. H. Schnell at Bayer AG, Germany, and by D. W. Fox at General Electric Company, USA working independently. In the late 1950’s polycarbonate began to be used in commercial applications. Polycarbonate was initially used for electronic applications such as distributor and fuse boxes, displays and plug connections and subsequently for glazing for greenhouses and public buildings. Soon polycarbonate’s outstanding combination of beneficial characteristics made it the material of choice for many other applications.
Another polymeric membrane that is polycarbonate track etch (PCTE) membranes are ideally suited for using in blood assays as well as high-purity or general filtration. Each PCTE membrane is produced through a two-step, proprietary manufacturing process that employs high quality standards. This unique process allows for increased control over the polycarbonate film membrane’s pore size and density, which also ensures that the physical properties of each PCTE membrane will fit your specifications precisely. The resulting PCTE membrane is a thin, translucent and microporous polycarbonate film with a smooth, flat surface. All particles larger than the pore size are captured on its surface.
Recent advances in nanoscience have made it possible to precisely control the morphology as well as physical and chemical properties of the pores in nanoporous materials that make them more attractive for regulating and sensing transport at the molecular level. Adiga 2009 studied the nanoporous membranes for biomedical applications. Various in vivo and in vitro membrane applications, including biosensing, biosorting, immunoisolation, and drug delivery are discussed along with the use of surface modification techniques to improve the function of nanoporous membranes.
Xia Lin et al., 2010 reviewed various methods for synthesis of conducting polymer nanostructures and their applications in sensing materials, focusing on hard-template, soft-template and other methods and the formation mechanism of conducting polymer nanostructures by these methods. Conducting polymer nanostructures, such as nanotubes, nanowires, and nanoparticles, as sensing platforms for various applications are also summarized.
Environmental concerns have led to the need of sustainable use of natural resources. The conventional agriculture caused considerable impacts on soils and waters. It is important to change certain agricultural managements to environmental cleaner techniques. The sustainable agriculture has pointed many approaches and techniques to reduce environmental impact. One of those strategies is the utilization of the soil microbiota to induce plant growth, control of plant diseases and biodegradation of xenobiotic compounds. Studies on the relationship between roots and
microbiota are essential to achieve viable agricultural applications. These studies indicate that one of the most abundant microorganisms in the rhizosphere (area around the roots) is fluorescent Pseudomonas spp. They have been considered as an alternative to agrochemicals for controlling plant diseases and increasing plant development. This review addresses the main findings on fluorescent Pseudomonas. There are many significant aspects of fluorescent Pseudomonas, including: (i) rhizosphere as a microhabitat; (ii) taxonomic, genetic and ecological aspects of fluorescent Pseudomonas in the rhizosphere; (iii) mechanisms of Plant Growth Promoting and Biological Control and (iv) commercial use of PGPR in agriculture (Botelho et al., 2006).
Several studies on bacterial populations within the root environment of plants have shown that the fluorescent Pseudomonas constitute a major group of rhizobacteria. Certain isolates of these fluorescent Pseudomonas, mainly P. fluorescens and P. putida strains, can stimulate the growth of several crops and thereby significantly increase their yield. These bacteria were termed plant growth-promoting rhizobacteria (PGPR) by Kloepper et al. (1980). [15]
Their beneficial effect is mainly exerted by antagonism of deleterious soil bacteria and phytopathogenic fungi (Kloepper et al., 1988; Lambert and Joos, 1989; Weller, 1988) [16]. In most cases, this biocontrol effect has been attributed to the production of antibiotics and/or siderophores in the rhizosphere of the
Pseudomonas-colonized roots (Leong, 1986; Tomashow et al., 1990). Under certain conditions, suppression of plant pathogens is also brought about by in situ generation of hydrogen cyanide (Voisard et al., 1989) [17]. A major hurdle for the development of commercial PGPR inocula remains their inconsistent performance in field trials. This has been attributed to a multitude of environmental variables introduced under field conditions, which were not accounted for in the initial screenings (Kloepper et al., 1989; Lambert and Joos, 1989) [13]. This inconsistent performance is also due to the low competitiveness of the bacteria with endogenous rhizosphere microorganisms resulting in a poor colonization of the roots (Kloepper and Schroth, 1981; Kloepper et al., 1989; Schroth and Hancock, 1982) [14].
experiment.
In view of historic and latest application of different kind of membranes, the present work is designed to fabricate nanoporous polymeric membrane made polycarbonate. The surface of membrane was modified by using a new technique i.e. immobilization of gold nano layer over the surface by sputtering technique followed by functionalization of gold surface by attachment the thiol group followed by antigen-antibody complex. The surface modified membrane was further characterized by Fourier Transform Infra-Red (FTIR) spectroscopy, Scanning electron microscopy (SEM), Energy Dispersive Spectroscopy (EDS), Thermo gravimetric/Differential Thermal Analysis (TG/DTA) etc.
2. Material and Methods
2.1. Reagents
The solvents and chemicals were of laboratory and analytical grade and were procured from Himedia, SRL, and Molychem. Sodium Chloride (Himedia), Potassium Chloride (SRL), Potassium dihydrogen phosphate (Himedia), Sodium hydrogen phosphate (Himedia) was used for preparing PBS. Phosphate-buffered saline (pH 7.2) was prepared by mixing NaCl (0.8 gm), KCl (0.02 gm), KH2PO4 (0.024 gm), NaHPO4 (0.144gm) in 100 ml Double Distilled Water. The antibody used was provided by Dr-Rajesh Kumar, Department of Microbiology, College of Basis Sciences and Humanities, Pantnagar.
The antibody and corresponding antigen used was the
fluorescent Pseudomonas (Z9 strain)were obtained from the Gene Pool of Department of Microbiology and the non-corresponding antigen (Pseudomonas (KNP2 (C2)) was used for checking the cross reactivity.
2.2. Instruments
The Gold coating on the PCTE membrane by instrument used is of Joel, make JFC 1600 Auto fine coater at Membrane Biophysics & Nanobiosensor Lab. further confirmation of coating was done by the SEM. The scanning electron microscopy study was done by using SEM (Model JEOL JSM 840 Scanning Electron Microscope) and the micrograph were recorded for all the different samples of the membrane including simple uncoated polymer membrane, membrane coated with gold nanolayer. The LEO 438VP SEM equipped with an Energy Dispersive Spectroscopy (EDS) System (BRUKER) that detects the X-rays emitted from a sample during electron imaging was used for the elemental analysis. Thermo Gravimetric Analysis (TGA) of Gold coated PCTE membrane was carried out under N2 flow using Thermo Gravimetric Analyzer Q50 .The FT-IR analysis was done by Nicolet 6600 (Thermo scientific) by sealed liquid cells methods.
2.3. Modification and Characterization of PCTE Membrane
The Surface modification of nanoporous Polycarbonate
track etched (PCTE) membrane (100nm) was done step wise. The Surface modification of membrane was done step wise. Surface modification through gold coating was done with the help of Ion -Sputtering method. The Ion sputtering instrument used is of Joel, make JFC 1600 Auto fine coater. The chamber was connected with a vacuum pumps, that vacuum is created inside the chamber and a D.C. Voltage of 12 KV is applied to the instrument for a period of 12-15 minutes. After completion of sputtering vacuum was released slowly, thereafter chamber was open to collect the gold coated membranes; the gold coated membrane was treated with a 0.05 M solution of dithiodipropionic acid in 100% ethanol to attach the thiol group at active sites of immobilized gold nanolayer. The dithiodipropionic acid used is of analytical grade and was purchased from (Acros, United States) which was characterized by SEM, EDX, and TGA. The Gold coated functionalized membrane is now used for the Ag-Ab interaction studies by use of EDX, FT-IR spectroscopy& recording of electrochemical data.
2.4. Antibody Immobilization
For the dilution of antigen and its corresponding and non-corresponding antibody, we used Phosphate Buffer Saline. For 10X dilution we took 1 micro liter of Antibody/antigen and dilute it in 9 micro liter of PBS buffer. Then we got 10 microliter of diluted antibody/antigen. Finally the membrane were washed with PBS and the attachment of Ab onto the Gold modified surface of PCTE membrane was confirmed by FT-IR spectroscopy which confirms the attachment of antibody onto the Gold coated surface by peak analysis.
Electrochemical measurements were carried out at room temperature in a cell with two Ag-Cl electrodes (with a surface area is 1 cm2) and a working volume of 30 ml divided in two by the membrane. As a supporting electrolyte, PBS-Ag solution (pH 7.2) was used with intensive stirring. The change in the membrane electro-impedance, induced by interaction with Antigen, was recorded as a function of time. Membrane electro conductivity measurements were performed by applying a DC-voltage (1.5 V) generated by a small battery to the electrodes. The output signal was detected using digital multimeter.
2.5. Fabrication of Electrochemical Nanobiosensor
used for the measurement of solid membrane potential recorded with various applied values of potential at 25oC ±0.5 for selection of optimum potential. The optimum potential was selected by circuit diagram as shown in figure
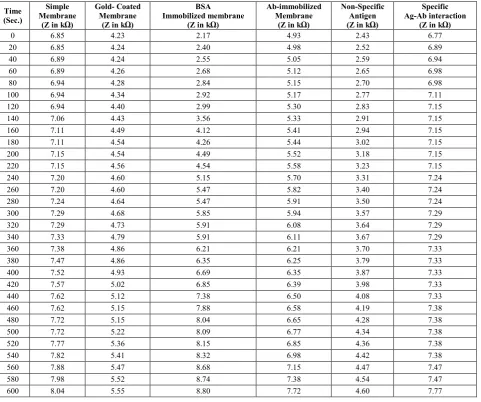
[image:5.595.162.449.134.313.2]1.The values of impedance across different membranes at different times of intervals are given in table 1. It is evident from the table 1; & table 2; that the values of impedance (in kilo-ohm) changes with time.
Figure 1. Circuit Diagram of Electrochemical Biosensor
Table 1. The values of impedance across different membranes at different times of intervals
Time (Sec.)
Simple Membrane
(Z in kΩ)
Gold- Coated Membrane
(Z in kΩ)
BSA Immobilized membrane
(Z in kΩ)
Ab-immobilized Membrane
(Z in kΩ)
Non-Specific Antigen (Z in kΩ)
Specific Ag-Ab interaction
(Z in kΩ)
0 6.85 4.23 2.17 4.93 2.43 6.77
20 6.85 4.24 2.40 4.98 2.52 6.89
40 6.89 4.24 2.55 5.05 2.59 6.94
60 6.89 4.26 2.68 5.12 2.65 6.98
80 6.94 4.28 2.84 5.15 2.70 6.98
100 6.94 4.34 2.92 5.17 2.77 7.11
120 6.94 4.40 2.99 5.30 2.83 7.15
140 7.06 4.43 3.56 5.33 2.91 7.15
160 7.11 4.49 4.12 5.41 2.94 7.15
180 7.11 4.54 4.26 5.44 3.02 7.15
200 7.15 4.54 4.49 5.52 3.18 7.15
220 7.15 4.56 4.54 5.58 3.23 7.15
240 7.20 4.60 5.15 5.70 3.31 7.24
260 7.20 4.60 5.47 5.82 3.40 7.24
280 7.24 4.64 5.47 5.91 3.50 7.24
300 7.29 4.68 5.85 5.94 3.57 7.29
320 7.29 4.73 5.91 6.08 3.64 7.29
340 7.33 4.79 5.91 6.11 3.67 7.29
360 7.38 4.86 6.21 6.21 3.70 7.33
380 7.47 4.86 6.35 6.25 3.79 7.33
400 7.52 4.93 6.69 6.35 3.87 7.33
420 7.57 5.02 6.85 6.39 3.98 7.33
440 7.62 5.12 7.38 6.50 4.08 7.33
460 7.62 5.15 7.88 6.58 4.19 7.38
480 7.72 5.15 8.04 6.65 4.28 7.38
500 7.72 5.22 8.09 6.77 4.34 7.38
520 7.77 5.36 8.15 6.85 4.36 7.38
540 7.82 5.41 8.32 6.98 4.42 7.38
560 7.88 5.47 8.68 7.15 4.47 7.47
580 7.98 5.52 8.74 7.38 4.54 7.47
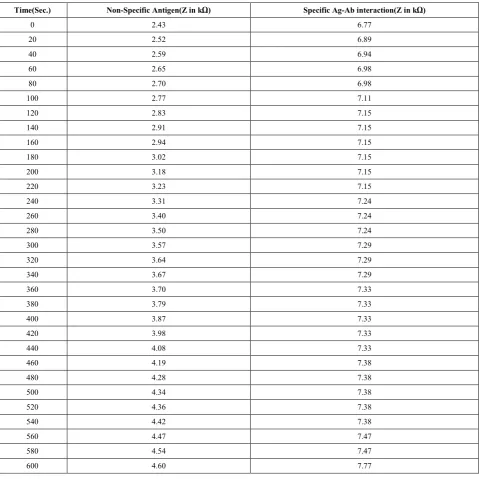
[image:5.595.68.550.349.751.2]Table 2. The values of impedance across immobilized (with specific antigen and non-specific antigen) at different times of intervals.
Time(Sec.) Non-Specific Antigen(Z in kΩ) Specific Ag-Ab interaction(Z in kΩ)
0 2.43 6.77
20 2.52 6.89
40 2.59 6.94
60 2.65 6.98
80 2.70 6.98
100 2.77 7.11
120 2.83 7.15
140 2.91 7.15
160 2.94 7.15
180 3.02 7.15
200 3.18 7.15
220 3.23 7.15
240 3.31 7.24
260 3.40 7.24
280 3.50 7.24
300 3.57 7.29
320 3.64 7.29
340 3.67 7.29
360 3.70 7.33
380 3.79 7.33
400 3.87 7.33
420 3.98 7.33
440 4.08 7.33
460 4.19 7.38
480 4.28 7.38
500 4.34 7.38
520 4.36 7.38
540 4.42 7.38
560 4.47 7.47
580 4.54 7.47
600 4.60 7.77
3. Results and Discussion
3.1. Characterization of Modified Membrane
3.1.1. Scanning Electron Microscopy (SEM)
In Scanning electron microscopy the prepared samples of the membranes were fixed on brass stubs using carbon tape and then coated with a thin layer of gold using ion sputter technique. Gold coating is done to prevent morphological and surface changing. SEM was operated at a voltage of about 15 KV and after impinging of focus of beam electron on the sample surface, in this we were more concerned about signals emitted as the secondary electron. Highly magnified images of the surface of samples were detected, recorded and
surface of membrane which may help in ion transport, diffusion and immobilization of various attachment on the surface of membranes. It is evident from the figure 2(a); that the pores are uniformly distributed all along the surface and micrograph at 2500 KX magnification the 100 nm pores are well ordered after gold coating. Figure 2(b); depicts the thiolated membrane surface at 1500 KX magnification and the pores after thiolation and gold coating remains of the order of 90-95 nm which is sufficient passage for ion movement across the membrane.
Figure 2. (a). SEM Micrograph of gold nanolayer coated PCTE membrane (b). SEM micrograph of immobilized gold nanolayer coated PCTE membrane attached with thiol group at active gold sites
3.1.2. Energy Dispersive Spectroscopy (EDX/EDS)
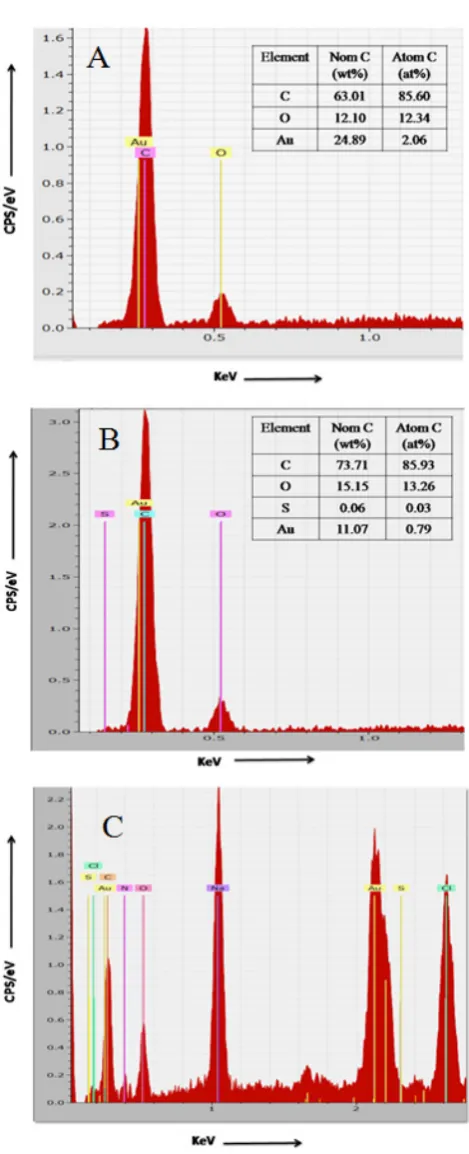
The Membrane modified with gold (Au) was further exposed to EDS/EDX to know the change in elemental composition on the Membrane and checked whether any change in composition occurs or not. It indicates the attachment of linker and antibody. The image thus obtained & given below (Figure 3(a)) show the presence of gold (Au) which confirm that the membrane contains gold (Au) attached to its surface. The % presence of normal concentration and atomic concentration is given accordingly.
[image:7.595.313.548.69.647.2] [image:7.595.61.302.206.548.2]The membrane was further treated with dithiodipropionic acid for attachment of thiol group which acts as linker. This was done as stated above in the sub heading of methodology; the results are visualized in the image below (Figure 3(b) which shows the presence of other elements sulphur, gold and oxygen (S, Au, and o).
When thiol group acts as linker, this was done as stated above in the sub heading of methodology; the results are visualized in the image below (Figure 3(c) which shows the presence of other elements (S, Au, O, N, Cl, Na, and C). This presence ensures the attachment of antibody indicated by the presence of Nitrogen, Sulphur. These are the constituents of amino terminal and disulphide bridging in antibodies. 3.1.3. Thermo Gravimetric Analysis (TGA)
These instruments can quantify loss of water, loss of solvent, loss of plasticizer, decarboxylation, pyrolysis, oxidation, decomposition, weight % filler, amount of metallic catalytic residue remaining on carbon nanotubes, and weight % ash.
[image:8.595.314.551.78.260.2]All these quantifiable applications are usually done upon heating, but there are some experiments where information may be obtained upon cooling, TGA thermal curve is displayed from left to right. (Figure 4) The descending TGA thermal curve indicates a weight loss occurred. When we used PCTE membrane; we observed the stability of membrane at the certain temperature which ranges from 100-200oC after this rapid decrease in mass with respect to increase the temperature from 350-450oC this is because decarboxylation, pyrolysis, oxidation, decomposition, weight % filler etc. Increases the stability of membrane is because of modification of surface by gold coating which provides some stability to the membrane. Most TGA experiments use an inert sample purge gas. This is done so the sample only reacts to temperature during decomposition. When the sample is heated in an inert atmosphere this is called pyrolysis. Pyrolysis is the chemical decomposition of organic materials by heating in the absence of oxygen or any other reagents. There are times when we want to use a reactive sample purge gas, such as Oxygen. When using oxygen as a purge gas we want to switch gases from nitrogen to oxygen during the experiment. This is a common technique to identify the percent carbon in a material.
Figure 4. TG/DTA graph of gold coated thiolated membrane
3.2. Fourier Transform Infrared Spectroscopy (FTIR) Analysis
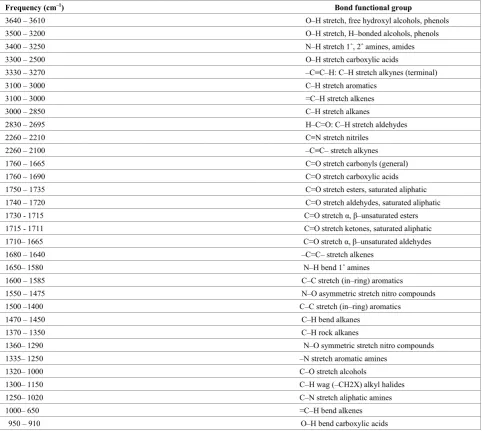
Characteristic IR Absorption
Frequency (cm–1) Bond functional group
3640 – 3610 O–H stretch, free hydroxyl alcohols, phenols 3500 – 3200 O–H stretch, H–bonded alcohols, phenols 3400 – 3250 N–H stretch 1˚,2˚ amines, amides 3300 – 2500 O–H stretch carboxylic acids
3330 – 3270 –C≡C–H: C–H stretch alkynes (terminal) 3100 – 3000 C–H stretch aromatics
3100 – 3000 =C–H stretch alkenes 3000 – 2850 C–H stretch alkanes
2830 – 2695 H–C=O: C–H stretch aldehydes 2260 – 2210 C≡N stretch nitriles
2260 – 2100 –C≡C– stretch alkynes 1760 – 1665 C=O stretch carbonyls (general) 1760 – 1690 C=O stretch carboxylic acids 1750 – 1735 C=O stretch esters, saturated aliphatic 1740 – 1720 C=O stretch aldehydes, saturated aliphatic 1730 - 1715 C=O stretch α,β–unsaturated esters 1715 - 1711 C=O stretch ketones, saturated aliphatic 1710– 1665 C=O stretch α,β–unsaturated aldehydes 1680 – 1640 –C=C– stretch alkenes
1650– 1580 N–H bend 1˚ amines 1600 – 1585 C–C stretch (in–ring) aromatics 1550 – 1475 N–O asymmetric stretch nitro compounds 1500 –1400 C–C stretch (in–ring) aromatics
1470 – 1450 C–H bend alkanes 1370 – 1350 C–H rock alkanes
1360– 1290 N–O symmetric stretch nitro compounds 1335– 1250 –N stretch aromatic amines
1320– 1000 C–O stretch alcohols
1300– 1150 C–H wag (–CH2X) alkyl halides 1250– 1020 C–N stretch aliphatic amines 1000– 650 =C–H bend alkenes 950 – 910 O–H bend carboxylic acids
Figure 5(a) shows the FTIR spectra of PCTE membrane. The peak observed at 2900 cm-1 was due to the presence of C–H stretching, 1750–1735 cm-1 was due to the presence of C=O stretching, 1000-650 cm-1 was due to the presence of =C-H bending, 950-910 cm-1 was due to the presence of O-H bending (recorded by a self-modified sample holder. The sample (membrane) was fitted into a hole of membrane size in the sample holder. After placing membrane between the light filters of the instrument, IR rays interact with the sample and yield various types of stretching, bending and vibrations. The spectrum of the sample was observed and recorded on PC using OMNIC software)
The Figure 5(b) depicts the FTIR spectrum of gold nanolayer coated Ag-Ab immobilized membrane. The peak observed at 2900 -3000 cm-1 was due to the presence C-H
[image:9.595.64.547.97.528.2]Figure 5. (a) FTIR spectra of PCTE membrane (b) FTIR spectra of GOLD coated membrane (c) FTIR spectra of GOLD coated membrane immobilized with NHS-EDC (d) FTIR spectrum of gold nanolayer coated Ag-Ab immobilized PCTE membrane
Figure 6. (a) Values of impedance (KΩ) with respect to time (Sec.) for different sample of membrane (b) Values of impedance (KΩ) with respect to time (Sec.) for non-specific antigen and specific Ag-Ab interaction
3.3. Fabrication of Membrane Based Electrochemical Biosensor
Different sets of membranes; simple membrane, gold-coated membrane, gold-coated thiolated, antibody immobilized membrane, gold-coated thiolated membrane immobilized with corresponding Ag-Ab and gold coated membrane immobilized with non-corresponding Ag-Ab were fitted in the experimental setup and measurements were taken one by one followed by measurements after BSA
blocking. These different membranes were used on the gold surface of glass cell.
The electronic circuit is shown in figure 1. Measurement system consists Digital multimeter, DC power supply (1.5 V), resistor (1 kΩ) and Phosphate Buffer Saline (PBS) was used as a buffer in L-shaped glass cell.
[image:10.595.82.534.439.601.2]impedance increases rapidly reach an approximate value with time and attain almost steady state after 600 seconds. This data reveals that early diffusion occurs rapidly across the membrane which attains steady state after 600 seconds under the applied potential. This electroanalytical technique has very low detection limits (typically 10-9 M) that can be achieved using small volumes (1± 20 mL) of samples
4. Conclusions
The objective of the experiments undertaken for the present was to develop inexpensive technology for detection of antigen- antibody interaction with help of synthetic polymeric membrane. The surface of PCTE membrane was modified by gold, this confirmed by SEM, EDS/EDX, TGA and FTIR. The impedance corresponding to each step of membrane modification was observed and it was showed that there was sharp increase in the measured impedance from surface modification to detection. Also there was multiple fold increase in signal due to tagging of gold nanoparticles to antigen. This impedance variation as a measure of antigen detection is in its preliminary stage and a lot of basic and applied work is still required to optimize the sensitivity and selectivity of the designed biosensor. The Membrane modified with gold (Au) was further exposed to EDS/EDX to know the change in elemental composition on the Membrane and checked whether any change in composition occurs or not. It indicates the attachment of linker and antibody. Elemental EDX microanalysis of the PCTE gold coated thiolated membrane shows the presence of elements (S, Au, O, N, Cl, Na, C). This presence ensures the attachment of antibody indicated by the presence of Nitrogen, Sulphur. These are the constituents of amino terminal and disulphide bridging in antibodies. When we used PCTE membrane for thermo-gravimetric analysis we observed the stability of membrane at the certain temperature which ranges from 100-200oC after this rapid decrease in mass with respect to increase the temperature from 350-450oC this is because decarboxylation, pyrolysis, oxidation, decomposition, weight % filler etc. Increases the stability of membrane is because of modification of surface by gold coating which provides some stability to the membrane.
Concluding the work it is emphasized that a number of membrane used for Conduct metric measurement. Although our current research is still in a preliminary stage, it is suggested that the proposed technique will provide a significant easy procedure for the preparation of Nanobiosensor system with the desired selectivity and sensitivity for many classes of substances.
Acknowledgements
The present investigation was carried out in the “Membrane Biophysics and Nano-biosensor Research
Laboratory” of Biophysics Unit of College of Basic Sciences and Humanities at G. B. Pant University of Agriculture and Technology, Pantnagar, 263145. Uttarakhand, India. This work was partly performed at the Material Evaluation Laboratory of CSIR-CBRI, Roorkee (IIT Roorkee).
REFERENCES
[1] Ivnitski Dmitri, Abdel-Hamid Ihab, Atanasov Plamen, Wilkins Ebtisam, and Stricker Stephen 1999, Application of Electrochemical Biosensors for Detection of Food Pathogenic Bacteria, Electroanalysis 12: 317-325.
[2] Goodridge L, Griffiths M. Reporter 2002. Bacteriophage assays as a means to detect foodborne pathogenic bacteria.
Food Res Int;35:863–70.
[3] Goepel W, Heiduschka P1995. Interface analysis in biosensor design. Biosens Bioelectron 10:853–83.
[4] S.H. Jenkins, W.R. Heineman, H.B. Halsall 1988, Electroanalytical Methods of Biological Materials. Anal. Biochemistry. 168: 292
[5] Silley, P., Forsythe, S., 1996. Impedance microbiology: a rapid change for microbiologists. J. Appl. Bacteriol. 80: 233–243. [6] Gibson, D.M., Coombs, P., Pimbley, D.W., 1992. Automated
conductance method for the detection of Salmonella in foods: collaborative study. J. Assoc. Off. Anal. Chem. 75,293–297. [7] W K Hadley D M Yajko 1985. Antimicrobial synergism
against Mycobacterium avium complex strains isolated from patients with acquired immune deficiency syndrome. Anti. Microb. Agent chemo.
[8] S. Liu, Q. Lin, X. Zhang, X. He, X. Xing, W. Lian, J. Huang 2011, Portable Biosensing of Food Toxicants and Environmental Pollutants Sensor Actuat B 156: 71.
[9] Thevenot DR, Toth K, Durst RA, Wilson GS. Biosens. Bioelectron. 2001; 16:121.
[10]A.K. Wanekaya, W. (hen, A. Mulchandani, Recent bio sensing developments in environmental security, J. Environ. Monit. 10 (2008) 703-712.
[11]Wang J. Biosens. Bioelectron. 2006; 21:1887.
[12]Kasianowicz J, Henrickson S, Misakian Metal(2002)Abstract Book for the 9th Li. Suiqiong, A. Simonian, B.A. (hin, Sensors for Agriculture and the Food Industry, The Electrochemical Society Interface Winter, 2010.
[13]Kloepper, J W, Lifshitz, R and Zablotowicz, R M 1989 Free living bacterial inocula for enhancing crop productivity. Trends Biotechnol. 7, 39–44.
[14]Kloepper, J W and Schroth, M N 1981 Plant growth-promoting rhizobacteria and plant growth under gnotobiotic conditions. Phytopathology 71, 642–644. [15]Kloepper, J W, Schroth, M N and Miller, T D 1980 Effects of
Phytopathology 70, 1078–1082.
[16]Lambert, B and Joos, H 1989 Fundamental aspects of rhizobacterial plant growth promotion research. Trends Biotechnol. 7, 215–219.
[17]Voisard, C, Keel, C, Haas, D and Défago, G 1989 Cyanide production by Pseudomonas fluorescens helps suppress black root rot of tobacco under gnotobiotic conditions. EMBO J. 8, 351–358.
[18]DeFeitas, J R and Germida, J J 1990 Plant growth promoting rhizobacteria for winter wheat. Can. J. Microbiol. 36, 265–272 [19]Kleeberger, A, Castorph, H and Klingmüller, W 1983 The rhizosphere microflora of wheat and barley with special reference to gram-negative bacteria. Arch. Microbiol. 136,
306–311.
[20]Lambert, B, Leyns, F, VanRooyen, L, Gosselé, F, Papon, Y and Swings, J 1987 Rhizobacteria of maize and their antifungal activities. Appl. Environ. Microbiol. 53, 1866– 1871.
[21]Miller, H J, Henken, G and VanVeen, J A 1989 Variation and composition of bacterial populations in the rhizospheres of maize, wheat and grass cultivars. Can. J. Microbiol. 35, 656– 660.