A Study to Examine the
Affordability of Irish Housing
Prepared by Indecon International Consultants
on behalf of the National Competitiveness Council
1
Chairman’s Foreword 2
Executive Summary 3
Chapter 1 Introduction and Background 11
1.1 Introduction 11
1.2 Background and Scope 11
1.3 Methodology for Study 11
1.4 Report Structure 12
1.5 Acknowledgements and Disclaimer 12
Chapter 2 Structure and Recent Trends in Irish Residential Property 13
2.1 Introduction 13
2.2 Evolution of Irish Residential Property Prices 13
2.3 Evolution of Irish Residential Rents 15
2.4 Household Formation Trends 16
2.5 Policy and Other Developments 18
2.6 Summary of Findings 19
Chapter 3 Existing Methodological Approaches 21
3.1 Introduction 21
3.2 House Price-to-income Ratio 21
3.3 Mortgage Repayment Burden 26
3.4 Rental Payment Burden 31
3.5 Price to Rent Ratio 34
3.6 User Cost of Capital Approach 36
3.7 Income Affordability Thresholds 37
3.8 Other Methodological Issues 38
3.9 Summary of Findings 39
Chapter 4 NCC Affordability Metrics 41
4.1 Introduction 41
4.2 Index Methodology and Construction 41
4.3 NCC Mortgage Affordability Index (MAI) 46
4.4 NCC Rent Affordability Index 51
4.5 Overall Comment on Affordability of Irish Housing 52
Chapter 5 Case Studies 54
Chapter 6 Conclusions 60
6.1 Key Findings 60
6.2 Issues for Consideration 61
2
Chairman’s Foreword
Against a backdrop of rising house prices and increasing rents, there has,
understandably, been much discussion about the affordability, or otherwise, of Irish residential property. To try and bring some clarity to the myriad of data sources available, the Council decided to commission some research to develop bespoke measures of affordability. This report, undertaken on behalf of the Council by Indecon International Economic Consultants, represents the outcome of this exercise.
Essentially, affordability refers to the proportion of household income that is spent on either purchasing or renting accommodation. Affordability is a complex issue, and any assessment of whether property is affordable or not is somewhat subjective. Affordability might best be thought of as a continuum – at one end property is easily affordable, at the other end it is definitely not affordable. Individual choices and preferences also come into play – decisions about location and distance from work, for example, impact upon transport costs, and may permit higher or lower proportions of income to be spent on meeting housing needs.
What is clear is that affordability matters for the individual household, for society as a whole, and for national competitiveness. For the individual, or household, buying a house is their single biggest lifetime purchase, while the cost of owning or renting a home takes a large share of household income. From a societal perspective, a stable and functioning housing market that meets the needs of all of the people living in Ireland is an essential contributor to social cohesion.
From the Council’s viewpoint, affordability of housing is a key component of competitiveness. It impacts upon the attractiveness of Ireland as a location for investment and directly impacts on enterprise costs through wage effects, and indirectly determines the price of Irish goods and services. The cost of housing influences labour mobility and contributes to an economy’s ability to adjust to adverse shocks. In short, a well-functioning housing and construction sector is critical to the overall health of society and the economy. Housing is an essential part of any society, but also one that has been the source of economic vulnerabilities and crises. The primary challenge, at present, is to deliver housing supply sufficient to meet demand at a price level that is affordable, accessible and sustainable. It is also important that we deliver quality homes. While there is an immediate pressure for intervention in the residential property market, there are no obvious quick fixes. Therefore, it is essential a long-term approach be taken to ensuring a sustainable housing market. A coherent and determined approach across a range of policy areas is required in order to improve housing affordability. In this regard, we feel this report is particularly timely given the ongoing development of an Action Plan for Housing, and we hope it serves as a useful input to the work of the new Department of Housing, Planning and Local Government.
On behalf of the Council, I would like to thank the team from Indecon who have produced this report. It represents a valuable contribution to the ongoing development of housing policy in Ireland. I would also like to thank the members and advisors of the Council for their contributions to producing this report. On behalf of the Council, I would also like to acknowledge the excellent work of the Executive in helping to formulate our approach to this work and for their overall research and analysis in this key area for Irish
competitiveness.
Professor Peter Clinch
3
Executive Summary
Introduction and Background
Housing is an essential part of any society, but also one that has been the source of economic vulnerabilities and crises. Housing construction is also an important component of investment, and in many countries households tend to hold wealth in the form of their homes rather than in financial assets.
The affordability of housing is also a component of competitiveness and potentially could impact on the attractiveness of Ireland as a location for investment and can indirectly impact on industries’ costs and influence the competitiveness of Irish goods and services. Adequate housing can also facilitate labour mobility within an economy and help economies adjust to adverse shocks. In short, a well-functioning housing and construction sector is critical to the overall health of society and the economy. The primary objective of this study is to assess the affordability of residential property in Ireland in an international context.
Structure and Recent Trends in Irish Residential Property
Since the housing boom in 2006/2007, Irish house prices fell dramatically and are still far below pre-crisis levels. The figure below displays house prices for Ireland from 2004 to 2016. While in recent years positive growth has been seen, the scale of reduction in house prices since 2007 is still apparent. The estimates of the peak to trough fall in prices range from 50 per cent to 66 per cent, while the recent recovery in house prices ranged from 9 per cent to 34 per cent. 2015 saw relatively slower or flat growth in house prices, although further observations will be necessary to identify if this is a continuing trend.
Irish House Prices (Q1 2005= 100), 2005-2016
Source: Central Statistics Office
Following a sharp fall at the onset of the recession, Irish rents are now close to or above the previous peak witnessed in 2008. The estimated peak to trough reduction in rents ranges from 21 per cent to 28 per cent,
50 60 70 80 90 100 110 120 130 140 Q 1 2 005 Q 3 2 00 5 Q 1 2 006 Q 3 2 00 6 Q 1 2 007 Q 3 2 00 7 Q 1 2 008 Q 3 2 00 8 Q 1 2 009 Q 3 2 00 9 Q 1 2 010 Q 3 2 01 0 Q 1 2 011 Q 3 2 01 1 Q 1 2 012 Q 3 2 01 2 Q 1 2 013 Q 3 2 01 3 Q 1 2 014 Q 3 2 01 4 Q 1 2 015 Q 3 2 01 5 Q 1 2 016 In de x, Q 1 20 05 =1 00
4
highlighting the dramatic market correction that occurred at the height of the crisis. Rent levels
subsequently levelled off, and remained stable until mid-2012. More recently, the rental market has seen strong growth. In 2015 the annual growth rate in rental prices was 6-8 per cent, though early indications suggest that the rate of growth may be even higher in 2016.
Over a longer time period, there have been a number of changes in the way Irish households have formed. While Ireland remains the least urbanised country in Northern or Western Europe, net-migration to the Dublin region remains an on-going trend. The CSO predicts that Dublin will experience net inward migration of 92,000 by 2031.
Historically, Ireland has had high rates of homeownership, though this is changing. In 1991 Ireland’s homeownership rate peaked at 80 per cent of households, with private rental accommodation accounting for only 8 per cent of houses. By comparison, in 2011 homeownership had fallen to 71 per cent while private rental accommodation had risen to 19 per cent. Ireland is increasingly characterised by smaller households as young people leave the family home at a younger age, a change which could be increasing the propensity to rent. Further, with a shift in the labour market away from having a ‘job for life’, a more flexible form of tenure such as renting might increasingly suit more households.
Policy and Other Developments
There have been a number of policy developments in recent years relevant to housing affordability. In January 2015 the Central Bank of Ireland applied limits to mortgage lending by regulated financial services providers in the Irish market, restricting loan-to-value and loan-to-income multiples for both primary dwelling houses and buy-to-let mortgages. The objective of these measures is to reduce the risk of bank credit and house price spirals from developing in the future.
A series of reforms to the private rental sector in Ireland were introduced in 2015 with the principal aim of providing greater rent certainty. The rent review period has been increased from one to two years, and will oblige landlords to provide more evidence that rent increases are in line with the local market rate. Further, a deposit protection scheme has been created by the Private Residential Tenancies Board. Finally,
landlords who intend to terminate a tenancy in order for a family member to use it will have to supply a ‘statutory declaration’ to that effect.
A number of other changes which impact on housing affordability have been introduced. The Housing Assistance Payment limits have been increased. Further, a tax relief measure was introduced to allow landlords who lease to tenants in receipt of social housing supports to avail of 100 per cent mortgage interest relief. On the supply side, the Government’s Social Housing Strategy 2020 commits to provide 35,000 new social housing units, while recent planning legislation has been passed to incentivise the use of vacant sites. This legislation also aims to incentivise mixed tenure developments and improve social housing. NAMA has become a major holder of debts related to land and houses, and has indicated that it could fund up to 20,000 homes over the next five years.
Existing Measures of Irish Housing Affordability
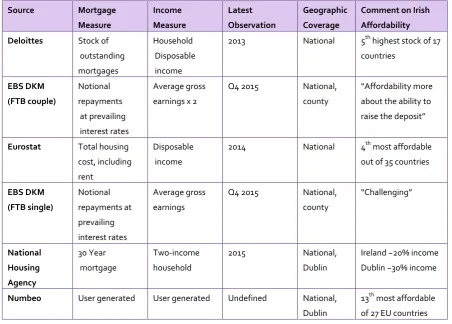
5 Summary of Existing Published Affordability Measures1
Measure Type Sources Comment on Affordability
House Price-to-income Ratio Deloittes, Demographia, Global Property Guide, MyHome.ie/ Davys, Numbeo, OECD
Ireland currently compares well in terms of house price-to-income measures of affordability; affordability is more pressured in Dublin. US cities appear to be far more affordable than Europe. Mortgage Repayment Burden Deloitte, EBS/DKM,
Eurostat,
National Housing Agency, Numbeo
Irish mortgage repayment costs appear to be ‘affordable’ when compared internationally or against recent experience. Increasingly, the cost of saving for a deposit is the barrier to homeownership. Rent Repayment Burden ERSI, National Association of Building
Cooperatives, OECD
Rent-to-income levels are close to 2005-2015 average, but affordability in the rental market is worsening.
Price to Rent Ratio Daft, Numbeo, OECD Ireland’s price-to-rent and yield
measures appear close to international and long-run Irish averages.
User Cost of Capital Approach ESRI, Central Bank Shifts in the cost of homeownership and renting are very sensitive to expectations of future house price changes.
Source: Indecon
House Price-to-Income Ratio
One of the most widely used measures of house price affordability is the ratio of house prices to income. A high price-to-income ratio could indicate a vulnerability of a housing market to a sharp correction brought about by a rise in interest rates or otherwise. The major weakness of this measure is that it does not directly measure affordability for households who buy houses with mortgage finance. Further, there is a positive correlation between the size of the metropolitan region and the level of the house price-to-income index, with larger metropolitan regions typically having higher price-to-income ratios.
A number of existing measures based on house price-to-income ratios which include Ireland are published by Deloittes, Demographia, the Global Property Guide, Myhome.ie/Davys, Numbeo and the OECD. The most up to date results for each of these indices shows that Ireland currently compares well to most other countries in terms of house price-to-income measures of affordability, but that affordability is more pressured in Dublin.
6
Mortgage Repayment Burden
An important aspect of household affordability relates to the cost of meeting mortgage payments. The standard approach is to estimate mortgage repayment to income ratios. The most obvious strength of this measure is that it directly captures affordability for those who are about to/considering buying, but who require mortgage finance to do so, which is the focus of much housing policy. A weakness of this approach to measuring affordability is that it will exclude the decision making processes that went into purchasing a home prior to mortgage payments. This includes the ability to raise a deposit in order to enter the property market. Finally, the susceptibility of a purchaser to changes in interest rates is not captured explicitly in this measure.
There are several existing published measures which calculate the mortgage repayment burden. These include the Deloitte Index of Affordability of Own Housing, the EBS/DKM Irish Housing Affordability Index, Eurostat, the National Housing Agency and the Numbeo Property Price Index. According to these
measures, Irish mortgages appear to be ‘affordable’ when compared internationally or against recent experience. One of these studies highlighted that increasingly it is the ‘deposit barrier’ which is now the most significant obstacle to homeownership.
Rental Payment Burden
As 20 per cent of households are in the private rental sector, an analysis of the affordability environment for this cohort is necessary. The standard approach to measurement is the estimation of rent-to-income ratios. A strength of this metric is that new and existing renters can be easily compared, in contrast with the mortgage market. A weakness of this approach is its inability to account for differences in rental markets, such as regulations relating to future rent adjustment.
Measures of rent affordability are less available than for the previous two measures. The ESRI has published research on this issue, while the National Association of Building Cooperatives has conducted survey work. Further, a rent-to-income index is calculated by the OECD. The results suggest that as of 2015, rent-to-income levels were close to their 2005-2015 average, but that affordability in the rental market is worsening.
Price-to-Rent Ratio
The price-to-rent metric is often used to reflect the relative cost of owning versus renting. Intuitively, when house prices are too high relative to rents, potential home buyers will choose instead to rent. The main criticism of this is that the price of a house is not the same as the annual cost of owning, so it does not follow from rising/falling prices of houses that ownership is necessarily becoming more
expensive/affordable. The inverse of this measure, the price-to-rent ratio, can be interpreted as the gross rental yield for investing in housing.
There are three existing measures published by Daft, Numbeo and the OECD. They show that Ireland is close to average price-to-rent and yield measures, whether compared internationally or compared to Ireland’s long-run average. Daft warns that small properties in Dublin seem to have very high yields (i.e. rent compared to prices).
User Cost of Capital Approach
7
annual cost of renting. A mortgage-to-rent ratio is a simplified version of the user-cost model, ignoring many other costs/benefits of ownership which would likely influence the decision to buy or rent.
A number of recent Irish studies calculate the user cost of capital and compare it with prevailing rents. The Central Bank in 2013 estimated that while the user cost of housing was below rents almost continually since 1980, user cost surpassed market rents in 2009. The ESRI in 2014 estimated that user cost surpassed market rent in 2008, though that the gap had subsequently narrowed. The results of these studies are largely dependent on the future price expectations of homeowners. Their estimates suggest that the user cost of housing was in fact negative for much of the 2001-2008 period, with expected capital appreciation exceeding actual housing costs.
NCC affordability metrics
While the term ‘housing affordability’ has been in widespread use for three decades, as a concept it is difficult to define. An inherent problem is that to define affordability is to invoke some benchmark against which housing is or is not affordable. Affordability can be thought of as a continuum – at one end it is easily affordable, at the other end it is definitely not affordable. But at which point in the middle can it be said that housing has gone from being affordable to not affordable? The approach for dealing with this issue in this study is to report relative affordability both over time, and across comparable regions. In addition, the reporting of affordability metrics will allow the reader to decide him or herself as to what constitutes affordability and what does not.
It will also be important to separate out differences in the quality of dwellings between regions in order to allow a like-for-like comparison. Differences in dwelling quality/type can arise for a number of reasons, including historic household formation norms, climate, age of the housing stock, geographic/topographic characteristics and societal preferences. It is also important that consistent household profiles are reported and compared across countries and regions. Finally, finding affordable accommodation is more difficult in capitals and large cities. The corollary of this is that an assessment of affordability should focus on a comparison of cities and city-regions, rather than countries.
Taking these factors into account, the following definition of housing affordability is employed for the purposes of this study:
Housing affordability is measured by examining the proportion of household income that is spent to meet own housing need whether purchasing a home or renting. Two overall indices are calculated, namely the NCC Mortgage Affordability Index (MAI), and the NCC Rent Affordability Index (RAI).
The calculation and results of these two indices are now discussed.
NCC Mortgage Affordability Index (MAI)
The rationale for the Mortgage Affordability Index (MAI) is to capture the cost of a newly purchased dwelling to a household earning the average household income for that region. The index as calculated is based on a standardised housing unit and takes account of differences in Mortgage Cost.
8
ratio than Dublin, while six show a lower price-to-income ratio. The mortgage multiplier calculates the first year repayment costs of a notional 20-year mortgage, and is reported as a percentage of the amount borrowed. It shows that the cost of mortgage finance in Ireland in 2015 was the highest of all countries surveyed. A higher cost of mortgage finance reduces the affordability of a new purchase.
The overall NCC Mortgage Multiplier Index is reported below, based on a notional mortgage with a 60 per cent LTV2. The MAI (below) shows that while five international regions had a higher price-to-income ratio
than Dublin, the higher cost of mortgage finance in Ireland meant that only two regions (Amsterdam and London) had a higher calculated MAI. The major outliers were London, where a new mortgage would cost over 40 per cent of income, and Atlanta, where a similar sized property would only take up less than 10 per cent of income. There are six international cities for which the MAI is higher than for Cork and Galway, and five where it is lower. For Limerick, Waterford and the Rest of Ireland, only Atlanta showed a lower MAI.
Mortgage Affordability Index (MAI) for Comparator Regions (60% Loan-to-Value), 2015
Source: Indecon
NCC Rent Affordability Index (RAI)
The rationale for the Rent Affordability Index is to capture the cost of rent to a household with the average household income for that region. It is calculated assuming a standard rental unit of 70 square meters, regardless of the type of housing (e.g., apartment or a house), and assumes a two-person household, each on 80 per cent of average disposable income.
The RAI shows that a total of three of the international regions had a higher ranking than Dublin in terms of rent as a percentage of income, while eight had a lower ranking. For Galway, four of the international regions had a higher ranking, while seven had a lower ranking, while for Cork, one additional city (Brussels) had a higher ranking. Finally, for Limerick and Waterford, only one region internationally had a lower RAI, while for the Rest of Ireland, two international regions had a lower RAI.
2 A similar table based on an 85 per cent loan-to-value is shown in the main body of the report.
9
Rent Affordability Index (RAI) for Comparator Regions, 2015
Source: Indecon
Conclusions
The metrics produced in this report suggest a number of issues which merit further consideration in determining any policy response to the issue of housing affordability and housing supply. However, it is beyond the scope of this report to provide recommendations regarding the overall policy regarding housing supply or demand. The issues for further consideration are as follows:
Affordability issues are more acute in cities: The proportion of income spent on mortgages or rent is generally higher in cities than in regions of lower population density. Any measures to address affordability nationally must have a particular focus on the main urban regions.
Rising cost of renting: Many Irish regions fare less well in terms of rent affordability than in terms of mortgage affordability. Further, given that many in the rental sector now have to save significant deposits if they are to buy a house, the affordability concerns for this cohort are particularly great. Any measures to address affordability should consider the rental market in particular.
Mortgage interest rates: The results of this study emphasise the importance of the mortgage finance market in determining the overall affordability of house purchase. Ensuring a competitive mortgage finance market will be important in terms of improving the affordability of Irish housing.
Sustainability of house prices: The objective of this study was to assess housing affordability, both from the perspective of mortgage finance affordability and rent affordability. A separate issue concerns the ‘sustainability’ of residential property price levels. For example, it might be argued that if house prices pass a certain threshold relative to income, then these prices might only stay at this level or rise further if there is a significant increase in income. However, a number of international cities as reported in this study have higher price-to-income ratios than Irish regions. This would suggest that current Irish affordability levels could persist in the medium to long run, regardless as to whether they are considered affordable or not.
Difference in affordability between Europe and US: The Demographia Index cited in this study reports that residential property is generally far less affordable in European cities than in many US cities. The
10
11
Chapter 1 Introduction and Background
1.1 Introduction
This report is submitted to the National Competitiveness Council and the Department of Jobs, Enterprise and Innovation by Indecon International Economic Consultants. The primary objective of this report is to assess the affordability of residential property in Ireland, and to place Irish affordability levels in an international context.
1.2 Background and Scope
High, or rapidly increasing, housing costs can impact negatively on the ability of our citizens to afford housing. This also can affect Ireland’s competitiveness in a number of ways. It can place upward pressure on wages; may create labour market impediments if employees are discouraged from migrating to areas where their skills are best suited; can deter immigration of skilled workers from abroad; and can create macroeconomic imbalances. A perception of housing non-affordability alone may also impact on the competitive assessment by investors of different locations.
Irish residential prices have increased by 35 per cent from March 2013 to February 2016, while Dublin residential prices have increased by 52 per cent from August 2012 to April 2016. Although an increase in house prices is to be expected as the economy recovers from the financial crisis and confidence is restored in the housing market, issues around the long-term affordability of housing and rent now require
consideration.
Any view on whether housing in Ireland is or is not affordable is a complex issue. This report has the goal of assessing measures of the relative affordability of residential property in Ireland over time and in an international context. Issues regarding the provision, financing and demand for local authority/voluntary housing is out of the scope of this assessment.
1.3 Methodology for Study
12
Phases of Methodological Approach/Work Programme
Phase 1: Project inception
Phase 2: Review of previous research
Phase 3: Decisions on appropriate
Phase 4: Construction of comparative indices
Phase 5: Conclusions & recommendations 1.1: Project inception
meeting and finalisation of scope, approach & timeline
2.1: Review of previous national & international research
3.1: Decision on affordability indices to be applied
4.1 Detail the conclusions based on assessment
5.1:
Recommendations on how metrics can inform policy 1.2: Collation of
existing national & international research & data
2.2 Comparative analysis of potential affordability indices
3.2: Choice of comparator countries/regions, types of property, types of buyer/renter
4.2 Development of case studies
5.2: Complete & submit draft final report
1.3: Project administration
2.3: Progress update meeting &
presentation of interim findings
3.3: Calculation of affordability indices
4.3 Progress update & interim report
5.3 Feedback on draft final report & submission of final report
1.4 Report Structure
The remainder of this report is structured as follows:
Chapter 2 reviews recent trends in Irish residential property prices, whether purchase or rental prices. It then sets out longer-term trends in household formation in Ireland, and how these were affected by the sharp fluctuations in prices that occurred since 2000. Finally, it sets out some recent policy changes in Ireland that are likely to affect affordability;
Chapter 3 reviews the variety of available methods used to assess the affordability of housing, and compares them based on their methodological approach and data sources. The section then goes on to assess the extent to which these existing measures indicate whether or not housing is currently affordable in Ireland;
Chapter 4 sets out the rationale for the choice of indices to be employed, the choice of comparator regions, and the measure of household income used. Further, it discusses particular methodological issues and data sources which are employed in the construction of the indices;
Chapter 5 sets out five case studies which illustrate issues regarding affordability which are not captured in the calculated indices; and
Chapter 6 concludes and sets out some issues for further consideration.
1.5 Acknowledgements and Disclaimer
13
Chapter 2 Structure and Recent Trends in Irish Residential
Property
2.1 Introduction
Housing is an essential part of any society, but also one that has been the source of economic vulnerabilities and crises3. Food, clothing and shelter are traditionally thought of as basic needs of mankind, so the
provision of housing satisfies an essential need. Housing construction is also an important component of investment, and in many countries households tend to hold wealth in the form of their homes rather than in financial assets. Housing also plays other key roles; for instance, mortgage markets are important in the transmission of monetary policy.
The affordability of housing is a component of competitiveness and potentially could impact on the attractiveness of Ireland as a location for investment and can indirectly impact on industries costs and influence the competitiveness of Irish goods and services. Adequate housing can also facilitate labour mobility within an economy and help economies adjust to adverse shocks. In short, a well-functioning housing and construction sector is critical to the overall health of society and the economy.
Access to, and affordability of, housing is a matter of intense public interest. In this section, we review recent trends in Irish residential property prices, whether purchase prices (Section 2.2) or rental prices (Section 2.3). In Section 2.4 we set out some longer-term trends in household formation in Ireland, and how these were affected by the very sharp fluctuations in prices that occurred in Ireland since the turn of the millennium. In Section 2.5 we set out some recent salient policy changes in Ireland that affect the mortgage and rental markets, particularly the new Central Bank mortgage limits and the changes in tenants’ rights primarily through the Residential Tenancies (Amendment) Act 2015. Section 2.6 concludes with a summary of findings.
2.2 Evolution of Irish Residential Property Prices
Since the height of the housing boom in 2006-2007, Irish house prices fell dramatically and are still far below pre-crisis levels. Figure 2.1 displays three house price indices for Ireland from 2005 to 2015. While in recent years positive growth has been seen, the scale of reduction in house prices since 2007 is still
apparent.
The CSO4 and MyHome5 indices were closely correlated until the end of the property bear market in
mid-2012. They subsequently diverged, with the MyHome Index indicating continued price reductions and a more subdued subsequent recovery. The estimates of the peak to trough fall in residential property prices were 50 per cent (CSO), 65 per cent (MyHome) and 66 per cent (Daft). The recent increase in house prices ranged from 9 per cent (MyHome) to 34 per cent (CSO) during several years of very low or zero inflation. The Daft index has been rising at a greater rate than the MyHome index and surpassed it in 2014. The CSO’s index for Dublin and national house prices excluding Dublin are displayed to highlight the divergent trends between the capital and the rest of Ireland. The four quarters of 2015 saw relatively slower
3 Zhu, M., Housing Markets, Financial Stability and the Economy, IMF, June 2014
4 The CSO index of house prices measures changes of actual prices paid for residential property sold in Ireland and uses a hedonic regression to take account of any changes in the mix of properties sold between different periods.
14
[image:16.595.88.409.152.359.2]or flat growth across all of the indices shown, although further observations will be necessary to identify whether this is a continuing trend.
Figure 2.1: Irish House Price Indices (Q1 2005=100), 2005-2015
Source: CSO, Daft.ie, MyHome.ie
Variations in affordability within Ireland are also important as these can impede internal mobility of workers between different locations within the country. This can have significant effects on Ireland’s ability to meet industry skills needs, given varying labour market conditions in different parts of the country. As can be seen from Figure 2.2, there is a clear correlation between household income and house prices by county, as well as a clear relationship between house prices and the number of transactions. Every additional €1,000 in average household income in a region is associated with the average house price being €37,000 higher. However, a simple correlation does not imply causation, or the direction of that causation. The graph shows that Dublin in particular is typified by high prices, which could ‘lock out’ potential new employees who might have the right skills-match for Dublin-based firms.
There are two principal features regarding past internal migration within Ireland. The first is the importance of net migration to the Dublin region. In 1961, when the population of the State was at its lowest level (2.8 million), Dublin accounted for just over a quarter of the total population while the share of the Mid-East region was 6.7 per cent. By 2006 Dublin had increased its share to 28 per cent while the Mid-East represented 11.2 per cent of the total. All other regions lost population share over the same 45-year period6. However, despite this growth, Ireland remains the least urbanised country in Northern or Western
Europe with an urbanisation rate of 63 per cent, compared to a typical 75-90 per cent rate in other
countries7. This might suggest that Ireland will become increasingly urban with continued growth in Dublin
and other urban areas. The CSO’s regional population forecasts, for example, predict that the Greater Dublin Area will experience net-migration of 92,000 from the rest of Ireland over the 2011-2031 period.
6 CSO, Regional Population Projections 2011-2026
7 United Nations, World Urbanization Prospects: The 2014 Revision, 2014
50 60 70 80 90 100 110 120 130 140 Q 1 2 005 Q 3 2 00 5 Q 1 2 006 Q 3 2 00 6 Q 1 2 007 Q 3 2 00 7 Q 1 2 008 Q 3 2 00 8 Q 1 2 009 Q 3 2 00 9 Q 1 2 010 Q 3 2 01 0 Q 1 2 011 Q 3 2 01 1 Q 1 2 012 Q 3 2 01 2 Q 1 2 013 Q 3 2 01 3 Q 1 2 014 Q 3 2 01 4 Q 1 2 015 Q 3 2 01 5 In de x, Q 1 20 05 =1 00
15
Figure 2.2: Average Household Income, House Price and Transactions by County, 2015
Source: Indecon analysis of Residential Property Price Register
2.3 Evolution of Irish Residential Rents
Following a sharp fall at the onset of the recession, Irish rents are now close to or above the previous peak witnessed in 2008. Figure 2.3 shows the three published indices of Irish residential rents over the period 2002–2015. While the three indices differ in the extent to which they measure the decline and rise in rents, they all follow a similar trend. While the CSO8 measure of rents closely followed Daft’s Rental Index9 prior to the 2007 market peak, the two series saw a divergence during the recession and subsequent recovery. The PRTB index is only available from 200710.
The estimated peak to trough reduction in rents ranges from 21 per cent (CSO) and 28 per cent (Daft.ie), highlighting the dramatic market correction that occurred at the height of the crisis. All three indices levelled off in 2010, and remained relatively stable until mid-2012. In more recent quarters the rental market has seen strong growth across each of the indices examined. The CSO rental index has surpassed pre-crisis levels and is seeing continued growth. The Daft and PRTB Indices have tracked each other more closely relative to the CSO index, and are both still below pre-crisis levels, but rising. In 2015 the indices measured an annual growth rate in rental prices of 6-8 per cent, at a time of near zero consumer price inflation. Indecon have presented PRTB index data for Dublin and outside of Dublin to indicate the divergent rental patterns of the capital and the rest of Ireland, with Dublin growing faster than its comparator.
The asking price premium (i.e. the difference between actual and asking prices) can be calculated by comparing PRTB data and Daft.ie data over the period. While variable across locations, the average asking
8 The CSO track actual rent paid by private sector tenants as part of the Consumer Price Index (CPI). 9 DAFT analyse asking prices for rents.
10 The PRTB track actual rent paid based on their register of tenancies.
€16,000 €18,000 €20,000 €22,000 €24,000 €26,000 €28,000 €30,000 €32,000 €34,000 €36,000
€50,000 €100,000 €150,000 €200,000 €250,000 €300,000 €350,000 €400,000
A
ver
ag
e I
nco
m
e
Average House Price
Dublin
Limerick Cork
Waterford
16
premium for a sample of seven locations analysed was 3.3 per cent11. The highest estimated asking
[image:18.595.87.413.216.437.2]premium was 6.8 per cent in Dublin 4, while the lowest was just under 0 per cent in Galway City. Given the lack of uniformity and the short timescale, it is difficult to put any strong interpretation on this. It may be due to existing renters having developed the trust of the landlord, thereby enjoying a lower rent than a new perspective tenant. This may reflect asymmetry of information in the rental market – the renter knows on first viewing the most important characteristics of the property (size, location, condition etc.), while the landlord has less information on the reliability of the tenant.
Figure 2.3: Irish Rental Market Indices (Q3 2007=100), 2002–2015
Source: Indecon analysis of CSO CPI Data, Daft.ie Rental Index, Private Residences Tenancy Board Rental Index
2.4 Household Formation Trends
Household tenure in Ireland has undergone large changes over the past two decades, and especially over the crisis period. Historically, Ireland has had high rates of homeownership12. In 1991 Ireland’s
homeownership rate peaked at 80 per cent of households, with private rental accommodation accounting for only 8 per cent of houses13. By comparison, in 2011 homeownership had fallen to 71 per cent while private rental accommodation had risen to 19 per cent. Social housing has remained relatively constant at one-tenth of houses. This recent trend towards renting is more pronounced in urban areas, especially Dublin, where almost one third of houses are rented. In the EU28, homeownership has been relatively static over the past decade, whereas the Euro Area-18 has seen a reduction from 71 per cent to 66 per cent. Some countries have seen a trend towards more homeownership, for example France, the Netherlands, and the Czech Republic14.
11 Cork City, Dublin 1, Dublin 2, Dublin 4, Galway City, Limerick City, Waterford City were all analysed due to the availability of data from the PRTB and Daft.ie over the 2007 to 2015 period.
12 Norris, M., Varieties of Home Ownership: Ireland’s Transition from a Socialised to a Marketised Policy Regime, 2013 13 National Economic and Social Council, Homeownership and Rental: What Road is Ireland On?, 2014
14 Eurostat, Survey of Income and Living Conditions 60 70 80 90 100 110 120 Q 1 2 002 Q 3 2 00 2 Q 1 2 003 Q 3 2 00 3 Q 1 2 004 Q 3 2 00 4 Q 1 2 005 Q 3 2 00 5 Q 1 2 006 Q 3 2 00 6 Q 1 2 007 Q 3 2 00 7 Q 1 2 008 Q 3 2 00 8 Q 1 2 009 Q 3 2 00 9 Q 1 2 010 Q 3 2 01 0 Q 1 2 011 Q 3 2 01 1 Q 1 2 012 Q 3 2 01 2 Q 1 2 013 Q 3 2 01 3 Q 1 2 014 Q 3 2 01 4 Q 1 2 015 Q 3 2 01 5 In de x, Q 3 20 07 =1 00
17
Recent changes in tenure are the result of long-term and short-term pressures. Longer term, the housing market behaviour of young people in Ireland until recently was similar to behaviour observed in Southern Europe where extended co-residence of parents with their adult children make for considerably larger household sizes15. Ireland is now moving towards a more ‘North-Western’ behaviour characterised by smaller households as young people leave the family home at a younger age, a change which is likely to increase demand for smaller properties and a greater propensity to rent16.
In the shorter term, the property market crash has shifted the cost of, and perceptions of the merits of, renting versus homeownership, as well as to the feasibility of securing funds to purchase properties. The shift towards greater share of renting in the years prior to 2005 was gradual, with approximately the same proportion of owners and renters in the early 2000s17. The share of renters began to rise after 2005, and
rapidly after 2008, especially among the younger age cohorts. Since then, rising rents and the recovery in house prices may have switched this preference again due to the combined effect of mortgages being relatively cheap, and rising house prices fuelling an expectation of further capital gains. Supply-side considerations may have also played a role here, for example the security of tenure has historically tended to disfavour rent in Ireland (see policy section below).
[image:19.595.332.513.442.622.2] [image:19.595.97.279.442.632.2]The net impact of these long-term and short-term pressures on the structure of housing tenure is unclear. Figure 2.4 shows the short-term demographic trend over the last six years, and suggests growth in small family units of 1-2 persons until 2013 which indicates a continuation of the trend towards a more Northern-European style of tenure. The number of ‘small’ household units of 1-2 persons rose significantly in the 2009-2013 period, though most of this increase took place in Dublin. There is evidence that this growth has now stopped, possibly as a result of inadequate supply of housing for new renters or purchasers.
Figure 2.4:Number of Households Classified by Average Household Size, 2009-2015
Source: Indecon analysis of CSO QNHS Data
15 Iacovou, M., Young People in Europe: Two Models of Household Formation, 1998
16, Iacovou, M. and Skew, A.J., Household Composition across the New Europe: Where do the New Member States Fit In? , 2011 17 Byrne, D. et al, Household Formation and Tenure Choice, ESRI Research Note, 2014
740 760 780 800 820 840 860 880 900
2009 2010 2011 2012 2013 2014 2015
Ho
us
eh
old
s (
00
0'
s)
National
1-2 person households 3+ households
200 205 210 215 220 225 230 235 240 245 250 255
2009 2010 2011 2012 2013 2014 2015 Dublin
18
2.5
Policy and Other Developments
2.5.1 Introduction
There have been a number of policy developments in recent years relevant to house purchase and rent affordability. This section surveys those policy announcements that may be impactful in terms of influencing housing affordability over the next number of years.
2.5.2 Central Bank Mortgage Limits
In January 2015 the Central Bank of Ireland introduced new regulations to apply limits to mortgage lending by regulated financial services providers in the Irish market18. These measures introduce limits for loan-to-value and loan-to-income ratios for both primary dwelling houses and buy to let mortgages. The objective of these regulations is to reduce the risk of bank credit and house price spirals from developing in the future. In particular:
Loan-to-value (LTV) for principal dwelling houses (PDH): The first limit is on the size of mortgages as a percentage of the value of the house that can be taken out on purchases of principal dwelling houses. This sets a limit of an 80 per cent LTV for non-first-time buyers, and a 90 per cent limit for first-time buyers on the first €220,000 of the property value, and 80 per cent on any excess. A credit institution is allowed to breach these limits for up to 15 per cent of all such loans.
Loan-to-value (LTV) for Buy to Let mortgages (BTLs): BTL mortgages are subject to a limit of 70 per cent LTV. A credit institution is allowed to breach this limit for up to 10 per cent of all such loans.
Loan-to-income (LTI) for PDH mortgages: PDH mortgage loans are also subject to a limit of 3.5 times loan to gross income. A credit institution is allowed to breach this limit for up to 20 per cent of all such loans.
According to the Central Bank, the introduction of the rules is likely to impact on house affordability in a number of ways19. While an account of the impact of these rules is outside the scope of the study, they may
have slowed house prices; and reduced the rate of house turnover as it will take longer for households to accumulate the necessary deposit. This may impact on a shift towards rental accommodation. The Central Bank has recently indicated that these rules would be subject to review, the first of which will take place in November 2016, though the Bank has strongly defended their introduction.
2.5.3 Residential Tenancies (Amendment) Act 2015
Traditionally, tenant protection laws in Ireland were less than in some other countries20. A series of reforms to the private rental sector in Ireland were introduced in 2015 with the principal aim of providing greater rent certainty. This legislation introduced, inter alia, the following measures:
The rent review period has been increased from one to two years, and will oblige landlords to provide more evidence that rent increases are in line with the local market rate.
Provides a legal obligation on landlords to notify tenants as to how to dispute rent increases.
Creates a deposit protection scheme where deposits are lodged with the Private Residential Tenancies Board (PRTB).
18 Central Bank, Press release: Central Bank announces new regulations on residential mortgage lending, 27 January 2015 19 Frisell, L., Some reflections on the potential effects of the Central Bank of Ireland’s mortgage regulations, Address to Financial Stability Department, Sveriges Riksbank, by Lars Frisell, Advisor to the Governor, 22 March 2016
19
Landlords who intend to sell their property or terminate a tenancy in order for a family member to use it will have to supply a ‘statutory declaration’ to that effect, and could be liable for a fine if it does not materialise.
2.5.3 Other Measures
The Housing Assistance Payment (HAP) is a form of social housing support for people who have a long-term housing need. The Housing Assistance Payment limits are being increased in Cork, Galway, Kildare and Meath where flexibility allows for a 20 per cent payment above rent supplement thresholds. For families in emergency accommodation in Dublin City, HAP payments will be allowed for 50 per cent above rent supplement levels. Further, a tax relief measure was introduced in the 2016 Finance Act to allow landlords who lease to tenants in receipt of social housing supports such as rent supplement or the HAP, to avail of 100 per cent mortgage interest relief on their borrowings where they commit to accommodating tenants in receipt of the above payments for a minimum period of three years.
On the supply side of the residential housing market, the Government set out its policy to address issues in the housing market in its Construction 2020 strategy. It commits to the delivery of a strategic, evidence-based approach to housing supply, to detect emerging imbalances and take the steps to correct them at an early stage. The Government’s Social Housing Strategy 2020 was launched in November 2014, and
commits inter alia to provide 35,000 new social housing units.
Recent planning legislation has been passed in 2015 to address housing supply issues, with focus on, inter alia, incentivising the use of vacant sites. The Urban Regeneration and Housing Act 2015 gives local authorities the right to impose levies on vacant sites, with the goal of reducing land-hoarding21. This
legislation also aims to incentivise mixed tenure developments and improve social housing.
The National Asset Management Agency (NAMA) has become a major holder of debts related to large amounts of land and houses in Ireland and particularly in the Greater Dublin Area. NAMA is legally obliged to fund commercially viable projects that will maximise the return to Irish taxpayer; however the
organisation has indicated that it could fund the delivery of up to 20,000 residential units over the next five years, subject to this commercial feasibility22.
2.6 Summary of Findings
In this section, we reviewed recent trends in residential property purchase prices and rents, set out some longer-term trends in household formation in Ireland, and discussed recent salient policy changes in Ireland that affect the mortgage and rental markets. The key findings are as follows:
Housing is essential in any society, but also one that has been the source of economic vulnerabilities and crises. A well-functioning housing sector is critical to the overall health and competitiveness of the economy as well as impacting on the quality of life.
Since the height of the housing boom in 2006/2007, Irish house prices fell dramatically and are still far below pre-crisis levels. The estimates of the peak to trough fall in residential property prices range from 50 per cent to 66 per cent. The recent increase in house prices ranged from 9 per cent to 34 per cent. The four quarters of 2015 saw relatively slower or flat growth in house prices.
20
There is a correlation between household income and house prices by county, as well as a clear relationship between house prices and the number of transactions. Dublin is typified by particularly high prices.
Following a sharp fall since the onset of the recession, Irish rents are now at the previous peak witnessed in 2008. The estimated peak to trough reduction in rents ranged from 21 per cent to 28 per cent. More recently, the rental market has seen strong growth, with an estimated annual growth rate in rents of 6-8 per cent in 2015.
Household tenure in Ireland has undergone large changes over the past two decades, and especially over the crisis period. Historically, Ireland has had high rates of homeownership, though a recent trend towards a greater propensity to rent is emerging in urban areas.
The housing market behaviour of young people in Ireland until recently was similar to that of Southern Europe. Ireland is now increasingly characterised by smaller households as young people leave the family home at a younger age.
21
Chapter 3 Existing Methodological Approaches
3.1 Introduction
There are a variety of methods to assess the affordability of housing. Measures that are generally used are based on a series of ratios designed to provide an indication of affordability at a point in time and are concentrated around one of four variables, variously defined. These are income (I), mortgage payments (M), house prices (P) and rental payments (R). The derived indices can be grouped as follows:
P/I: House Price-to-Income ratio;
M/I: Mortgage repayment burden in the form of a mortgage-to-income ratio. A related measure is a deposit-to-income ratio;
R/I: Rental payment burden in the form of a rent-to-income ratio;
P/R: Price-to-rent ratio or its inverse, the landlord’s yield on investment (i.e. Rent-to-price ratio); and
M/R: User cost of capital (UCC) is a broader approach used, which includes mortgage-to-rent indices. The only combination of the four variables set out above for which no significant literature exists is the ratio of mortgage-to-price (M/P), which is closely linked to the properties Loan-to-Value (LTV) ratio. The indices as calculated above can be used to compare on an international/inter-city basis (for example, affordability in Ireland compared to Belgium) or on intertemporal basis (how affordable is Limerick in 2015 compared to its historical average).
In this section we review each of the five approaches above taking account of a number of studies and published indices. Each of these indices has potential theoretical advantages and disadvantages, so we compare them based on the different methodological approaches and data sources. Finally, we report on the extent to which these measures indicate that housing is or is not currently affordable in Ireland. The list provided is not exhaustive, though gives an assessment of the current affordability of Irish housing based on the existing evidence.
3.2 House Price-to-income Ratio
3.2.1 Basis for Measure
One of the most widely used measures of house price affordability is the ratio of house prices to income. There are various ways the different components of these indices could be constructed:
House Prices: House prices can be expressed as a median or an average, or be expressed as a square footage or based on a standard property type(s); and
Income: Income can be measured at the level of the individual family/individual or at a national level through GNP. In terms of the former, it can be calculated gross or net of tax, median or average, or be based on average earnings or earnings linked to a particular skill/household type.
22
when viewed alongside more direct measures of affordability such as mortgage payments to income or rental payments to income.
3.2.2 Existing Published Measures
A number of existing published measures based on house price-to-income ratios which include Ireland are discussed below, as published by Deloittes, Demographia, the Global Property Guide, Myhome.ie/Davys, Numbeo and the OECD. This section discusses the methodology and scope of each index, and summarises the outcomes.
Deloittes Property Index
The annual Deloitte Property Index provides an overview of European Residential Markets and in 2015 released its fourth edition. In order to assess the affordability of housing, Deloittes measure the ratio of the gross annual salary to a standardised new dwelling (70 sq. m). They assessed Irish housing to be ‘relatively affordable’ with a ratio of around 5, along with the Netherlands, Spain, Sweden, and Austria. The most affordable housing on this basis can be found in Belgium with a ratio of just 3.2 years to buy a new dwelling, followed by Germany and Denmark. According to Deloittes, the affordability of housing seems to be correlated with the economic level of a country.
[image:24.595.91.408.440.636.2]Figure 3.1 shows that, the higher the GDP per capita of a country, generally the more affordable housing is. ‘Less affordable’ houses as assessed by Deloittes were in Italy, the Czech Republic, Poland, Hungary and France, with index values of 6-8, while the least affordable housing is in Russia, the UK, and Israel.
Figure 3.1: Deloittes Index of Affordability of Own Housing and the Economic Level
Source: National Statistical Authorities, Eurostat, Deloitte calculations
Demographia International Housing Affordability Survey
The Demographia International Housing Affordability Survey has been published since 2005, and as well as Ireland includes Australia, Canada, New Zealand, UK and the US. More recently it has been expanded to include Hong Kong and Singapore. It studies 378 metropolitan markets in all, of which 87 have a population greater than one million and are considered major markets. This index is calculated based on the median
Belgium Germany
Denmark Netherlands
Spain Ireland
Portugal
Austria
Italy
Czech Republic
Poland
Hungary France
Russia UK
Israel
30 50 70 90 110 130 150
0 2 4 6 8 10 12 14
G
D
P
per
ca
pi
ta
(PPP)
, E
U
27
=1
00
23
house price divided by gross annual median household income. This is calculated both for national markets and for major metropolitan areas. These price-to-income ratios are then classified as being affordable
(median multiple ≤ 3), moderately affordable (3.1-4.0), seriously unaffordable (4.1-5.0), and severely unaffordable (>5). The 2016 study is based on data from Q3 2015. For Ireland, the study considered all metropolitan markets with over 50,000 population, being Cork, Dublin, Galway, Limerick and Waterford. The Study calculates median house prices using from the Residential Property Price Register of the Property Services Regulatory Authority23.
Demographia’s index has historically been similar among the surveyed nations, with median house prices from 2.0 to 3.0 times median household incomes24. Housing affordability remained generally within this range until the late 1980s or late 1990s in each of these nations. According to Demographia, in recent decades, housing affordability has deteriorated across Australia, New Zealand and the UK, virtually without regard to market size or demand. Declines in housing affordability were also registered in some markets of the US and Canada.
According to Demographia, Ireland had a seriously unaffordable major market (Dublin) with a price/income ratio of 4.5 in 2015. Ireland’s overall ratio is an “affordable” 2.8, the best country in the survey for the third year in a row. With the exception of Cork (3.3), all of the other markets were rated affordable, with ratios of 3.0 or less (Galway, Limerick and Waterford). Limerick, with a ratio of 1.8, had the best housing
affordability among all of the surveyed metropolitan regions, while Waterford was second with 2.1. In fact, Demographia say that while a value below 2.0 is affordable, it is so low that it may indicate depressed economic conditions.
Global Property Guide25
The house price-to-income ratio calculated by the Global Property Guide is the ratio of the cost of a typical upscale housing unit of 100 square metres, compared to the country’s GDP per capita. The ratios published by the Global Property Guide are based on proprietary data, but uses the IMFs GDP per capita figures. The figures suggest that, at a multiple of 10.6, Ireland’s house price-to-income ratio was the fifth most
affordable of the 36 countries ranked. Recalculating this based on GNP for Ireland given the distorting effect of MNC profits in the case of Ireland raises Ireland ranking, though Ireland still is the eight most affordable country of the 36 countries ranked. Global Property Guide argue that the ratio will be higher in low income countries than high income countries.
MyHome.ie/Davys
The MyHome.ie/Davys quarterly property report publishes average asking prices relative to average wages per head employed. In 2013 they reported an index at five times average wages per head, similar to UK multiples as reported by the Nationwide and Halifax. This compares with the extreme valuations achieved during the boom, close to 8-9 times average wages, well in excess of those in the UK. They further break this down regionally, noting the relatively high price-to-income ratios in Dublin (5.9) and the mid-East, comprising Meath, Kildare and Wicklow (4.9). Relative to incomes, they say that house prices look most affordable in the midlands (2.8) and mid-west regions (3.4).
23 A summary of the output is shown in the appendix.
24 Numbeo
Numbeo is a user-generated indexing site and tracks the price-to-income ratio for countries and major cities. While user-generated data will not have the accuracy of a properly produced statistical survey, the scope and depth of the data gives this approach some merit. The Numbeo Price-to-income Ratio is calculated as the ratio of median apartment prices to median familial disposable income, expressed as years of income. The Numbeo formula assumes net disposable family income as defined as 1.5 times average net salary, that the average apartment has 90 square meters, and that its price per square meter is the average price per square meter of the city centre and outside of city centre. The current (2016) price-to-income ratio calculated for Dublin is reported as 9.92, ranking Dublin as the 41st least affordable out of the 67 European cities listed, which had a median price-to-income ratio of 10.37. Generally speaking, US cities fared best in this comparison, typically coming out as the most affordable cities in the world.
OECD
[image:26.595.83.411.390.605.2]The OECD produces a Price-to-Income index, which can be expressed as a percentage of the long-run average. Figure 3.2 shows the most recent OECD data. The house-price-to-income ratio in Ireland is very close (3 per cent above) its long-run average defined as the average of the ratio from 1987 to Q2 2015, having been 63 per cent ahead of the long-run average at the height of the boom.
Figure 3.2: OECD House Price-to-Income Ratio Relative to Long-run Average26, 2015
Source: OECD
3.2.3 Comparison of outcomes
The most up to date results for each of the indices discussed above are illustrated in Table 3.1 below. It shows that Ireland currently compares well to most other countries in terms of house price-to-income measures of affordability, but that affordability is more pressured in Dublin.
25
The three most comparable of the indices suggest that Ireland has a price-to-income ratio of 2.8
(Demographia) and 5.0 (Deloittes and MyHome/Davys). There are two main differences which explain this divergence. First, the Demographia index is based on median household income, while Deloittes and MyHome/Davys are based on wages per head. Second, the Demographia index uses median house prices at a national level which, by design, removes the skewing effect of high prices in Dublin to result in a relatively low national ratio. When looked at by region (e.g. Dublin) the reported ratios are similar. Overall, the Deloittes Index categorises Irish house prices as relatively affordable. The Demographia index places Ireland in the ‘affordable’ category, though notes Dublin is ‘seriously unaffordable’. The
Myhome/Davys measure compares Ireland with the UK, and finds that as of 2014 they were very similar in terms of affordability, though the spread between London (highly unaffordable) and the rest of the UK is far wider than that witnessed between Dublin and the rest of Ireland. In terms of the other measures, the OECD price-to-income index suggests that Ireland is currently slightly above its long run average, while the GDP-based Global Property Guide puts Ireland as 8th and 5th cheapest respectively depending on whether GNP or GDP is used as a measure of income. Finally, Numbeo ranks Dublin as more affordable than the typical EU city.
[image:27.595.69.520.411.687.2]Table 3.1 summarises the list of existing published price-to-income ratio measures which include Ireland, how they are calculated, when the last observation is from and what their geographic coverage is. The existing international price-to-income ratios generally suggest that Irish housing remains affordable when compared to the ratios calculated for other countries, although prices in Dublin are increasingly less affordable.
Table 3.1: Summary of Existing Published Residential Price-to-Income Ratios
Source Property
Measure
Income Measure
Latest Observation
Geographic Coverage
Comment on Irish Affordability Deloittes Standardised 70
sq. mts dwelling
Gross Annual Salaries
2014 Ireland “Relatively
affordable” Demographia Median sale
price
Median Household income
Q3 2015 Ireland &
major city-regions
Ireland “affordable”, Dublin “seriously unaffordable” Global
Property Guide
Standardised 100 sq. mts dwelling
GDP per capita Undefined Ireland Fifth most
affordable of 36 countries ranked MyHome.ie/
Davys
Median asking price, 3-bed semi-d house
Wages per head Q4 2015 Ireland &
regions
Similar to UK levels of affordability
Numbeo 90 square
meters apartment
1.5 times Average net salary
2016 Dublin More affordable than
median ratio for 67 EU cities
OECD Average sales
price
Income Q2 2015 Ireland Index in line with
long-run average
26
3.3 Mortgage Repayment Burden
3.3.1 Basis for Measure
An important aspect of household affordability relates to the cost of meeting mortgage payments. The most basic approach is to estimate mortgage repayment to income ratios. These can be constructed using various measurements of both mortgage repayment, and income.
Mortgage Repayment: Mortgage repayments can be estimated by using median or average mortgage repayments from both new and existing mortgages. Repayments can also be calculated based on a fixed or variable interest rate mortgage taking into account the monetary authorities’ baseline rates; and
Income: Income can be measured at the level of the individual family/individual or at a national level through GDP/GNP. In terms of the former, it can be calculated gross or net of tax, median or average, or be based on average earnings or earnings linked to a particular skill/household type.
The most obvious strength of this measure is that it directly captures affordability for those who are about to/considering buying, particularly for the first time, which is the focus of much housing policy. A weakness of this approach to measuring affordability is that it will exclude the decision making processes that went into purchasing a home prior to mortgage payments. This includes the ability to raise a deposit in order to enter the property market. This exclusion will mean the results will not accurately measure the affordability of a deposit, which is especially relevant to Ireland since the introduction of new Central Bank deposit rules. Cash purchases are also implicitly excluded from this metric. Finally, the susceptibility of an existing purchaser to a subsequent increase in interest rates is not captured explicitly in this measure.
3.3.2 Existing Published Measures
There are several existing published measures which calculate the mortgage repayment burden. These are, namely, the Deloitte Index of Affordability of Own Housing, the EBS/DKM Irish Housing Affordability Index, the National Housing Agency and the Numbeo Property Price Index, each of which are discussed below in terms of their scope, methodological approaches and recent outcomes.
Deloitte Index of Affordability of Own Housing
As well as a price-to-income ratio, the annual Deloittes Overview of European Residential Markets reports the stock of residential debt as a proportion of household disposable income. Out of the 17 countries examined during 2013, Ireland was found to have the fifth highest level of mortgage to household
disposable income ratio. A high showing for Ireland was to be expected given the large stock of mortgages built up over the course of the boom. The Netherlands was judged the most indebted market, while Russia had the lowest level of mortgages. However, this index does not measure the affordability of this mortgage debt per se, just its cumulative scale.
EBS/DKM Irish Housing Affordability Index
27
The EBS/DKM index shows that a first time buyer couple would have spent approximately 20 per cent of their income in 2015 on a new mortgage. The figures from 2007-2015 are shown below. Nationally, 19.2 per cent of net income for an average-earnings working couple is required to afford a mortgage at average prices and interest rates. The 2015 estimate of affordability represents an improvement on 2014, mostly because of a fall in assumed interest rates, which is based on the standard variable mortgage rates as reported by mortgage lenders to the Central Bank (3.7 per cent as of December 2015). There was also a modest rise in income (0.5%), though this was more than offset by an increase in house prices of 6.6 per cent.
They also report the affordability for a single first time buyer on average earnings which shows that 38.2 per cent of income would be required. This is above the threshold of 30 per cent commonly used in the
literature as indicating unaffordability (see Section 3.7) though well down from the 51 per cent reported for December 2007. The report comments that affordability for single first time buyers continues to be challenging. The report concludes that housing affordability has become more about the ability to raise the deposit than the ability to fund mortgage repayments (see Section 3.3.4 below).
[image:29.595.82.404.399.627.2]Geographically, Dublin and Wicklow were assessed as the most unaffordable counties based on the EBS/DKM index, with 21.7 per cent of net income required, while Longford, Leitrim and Roscommon were the most affordable. Generally, there is a clear negative relationship between affordability and buying a house in, or near, a major metropolitan region.
Figure 3.3:Housing Affordability Trends for First-Time Buyers, 2007-2015
Source: EBS/DKM
Eurostat
Eurostat compiles a more general measure, namely the share of housing costs in disposable income, which refers to the expenditure on housing compared to the household’s income. Housing costs (including utilities) are calculated after deduction of housing allowances. This is based on data from the SILC survey. The figures show that expenditure on housing in Ireland is currently amongst the lowest in the EU.
10% 15% 20% 25% 30%
D
ec
-07
D
ec
-08
D
ec
-09
D
ec
-1
0
D
ec
-1
1
D
ec
-1
2
D
ec
-1
3
D
ec
-1
4
D
ec
-1
5
Per
cen
ta
ge
of
in
co
m
e