ii
POWER QUALITY ANALYSIS AND MITIGATION
UDECHUKWU CHUKWUEMEKA CHARLES
A project report submitted in partial fulfillment of the requirement for the award of the
Degree of Master of Electrical Engineering
Faculty of Electrical and Electronic Engineering Universiti Tun Hussein Onn Malaysia
ABSTRACT
vii
ABSTRAK
ix
CONTENTS
TITLE
DECLARATION iii
DEDICATION iv
ACKNOWLEDGEMENT v
ABSTRACT vi
ABSTRAK vii
CONTENTS ix
LIST OF TABLES xiii
LIST OF FIGURES xiv
LIST OF SYMBOLS AND ABBREVIATIONS xix
LIST OF APPENDICES xx
CHAPTER 1 INTRODUCTION 1.1 Project Background 1
1.2 Objectives 3
1.3 Background of study 3
1.4 Problem Statements 4
1.5 Scope of Study 5
CHAPTER 2 LITERATURE REVIEW 2.1 Power Quality 6
2.2 Voltage Dips (Sag) 8
2.3 Voltage Swell 9
2.5 Voltage Source Converters (VSC) 10
2.6 Dynamic Voltage Restorer (DVR) 10
2.7 Distribution Static Compensator (D-STATCOM) 12
2.8 Previous Research 13
CHAPTER 3 METHODOLOGY 3.1 Overview of Project Methodology 15
3.2 Sinusoidal PWM-Based Control 15
3.3 Test System 17
3.4 Theory on Motor Starting Circuits 18
3.4.1 Direct-On-Line (DOL) Starting 18
3.4.2 Star-Delta Starting 19
3.4.3 Autotransformer Starting 21
3.5 Dynamic Voltage Restorer 22
3.6 Distribution Static Compensator 23
3.7 Test Cases 24
3.7.1 Test System A 24
3.7.2 Test System B 26
3.7.3 Motor Starting Circuit Simulations by PSCAD Software 28
3.7.3.1 Direct-On-Line Starting 28
3.7 3.2 Star-Delta Starting 30
3.7.3.3 Autotransformer Starting 32
3.7.4 Motor Starting Circuits with Faults applied to the System. 34
3.7.4.1 The Direct-On-Line Starting Circuit with Fault 34
3.7.4.2 The Star-Delta Motor Starting Circuit with Fault applied 36
xi
CHAPTER 4 RESULTS AND DATA ANALYSIS
4.1 Introduction 41
4.2 Case 1: Motor Starting Circuits 42
4.2.1 Direct-On-Line Starting 42
4.2.2 Star-Delta Starting 45
4.2.3 Autotransformer Starting 49
4.3 Case 2: Occurence/Application of a Fault 52
4.3.1 Single Line to Ground Fault 52
4.3.1.1 Test System A 52
4.3.1.2 Test System B 55 4.3.1.3 Direct-On-Line Starting Circuit (With a Single Line to Ground Fault) 58
4.3.1.4 Star-Delta Motor Starting Circuit (With a Single Line to Ground Fault) 61 4.3.1.5 Autotransformer Starting Circuit (With a Single Line to Ground Fault) 65
4.3.2 Double Line to Ground Fault 72
4.3.2.1 Test System A 72
4.3.2.2 Test System B 75
4.3.2.3 Direct-On-Line Motor Starting (With a Double Line to Ground Fault) 78
4.3.2.4 Star-Delta Motor Starting (With a Double Line to Ground Fault) 83
4.3.2.5 Autotransformer Motor Starting (With a Double Line to Ground Fault: Phase B and C to Ground) 90
CHAPTER 5 CONCLUSION AND RECOMMENDATION 5.1 Conclusion 98
REFERENCES 100
xiii
LIST OF TABLES
TABLE NO. TITLE
LIST OF FIGURES
2.1 Voltage Dip (Sag) waveform 8
2.2 Voltage Swell waveform 9
2.3 Basic Configuration of a DVR 11
2.4 Configuration of a D-STATCOM 12
3.1 Control Scheme for the Test System implemented in PSCAD/EMTDC to carry out DVR and D-STATCOM simulation. 16
3.2 Direct-On-Line Circuit connection 19
3.3 Star-Delta Connection using contactors 20
3.4 Autotransformer Connection for the Motor Starting 22
3.5 Diagram of the DVR designed using the PSCAD/EMTDC. 23
3.6 Diagram of the D-STATCOM designed using PSCAD/EMTDC. 24
3.7(a) Test System A Implemented in PSCAD/EMTDC without the DVR 25
3.7(b) Test System A showing the control scheme implemented in PSCAD/EMTDC with the DVR connected to carry out the mitigation simulation. 26
3.8(a) Test System B implemented in PSCAD/EMTDC without the D-STATCOM. 27
3.8(b) Test System B showing the control scheme implemented in PSCAD/EMTDC with the D-STATCOM connected to carry out the mitigation simulation. 28
3.9(a) A model of the Direct-On-Line Starter Circuit designed using the PSCAD/EMTDC software. 29
xv
in connection. 30
3.10(a) Star-Delta Starter Circuit model designed using PSCAD/EMTDC. 31
3.10(b) The Star-Delta Starter Circuit model with the DVR connected. 31
3.10(c) The Star-Delta Starter Circuit model with the D-STATCOM connected. 32
3.11(a) The Autotransformer Starting Circuit model implemented in PSCAD/EMTDC. 33
3.11(b) The Autotransformer Starter Circuit model with the DVR connected. 33
3.11(c) The Autotransformer Starter Circuit model with the D-STATCOM connected. 34
3.12(a) The model of the Direct-On-Line Motor Starting Circuit with fault applied to the System implemented in PSCAD/EMTDC. 35
3.12(b) The Direct-On-Line Motor Starting Circuit with the DVR connected for mitigation. 35
3.12(c) The Direct-On-Line Motor Starting Circuit with the D-STATCOM connected for mitigation. 36
3.13(a) A Star-Delta Motor Starting Circuit with fault applied to the system implemented in PSCAD/EMTDC. 37
3.13(b) The Star-Delta Motor Starting Circuit with the DVR connected for mitigation. 37
3.13(c) The Star-Delta Motor Starting Circuit with the D-STATCOM connected for mitigation. 38
3.14(a) An Autotransformer Motor Starting Circuit with fault applied to the system implemented in PSCAD/EMTDC. 39
3.14(b) The Autotransformer Motor Starting Circuit with the DVR connected for mitigation. 39
3.14(c) The Autotransformer Motor Starting Circuit with the D-STATCOM connected for mitigation. 40
4.1(a) Voltage drop (sag) at Phase A 42
4.1(b) The Phase A voltage with the DVR connected 43
device. 43
4.2(b) The RMS voltage with the DVR connected and operating. 44
4.2(c) The RMS voltage with the D-STATCOM connected and operating. 45
4.3(a) Voltage Sag at the Phase B at the motor terminal. 46
4.3(b) Phase B voltage with the DVR connected. 46
4.3(c) Phase B voltage with the D-STATCOM connected. 47
4.4(a) RMS voltage at the motor point, without any mitigation device. 47
4.4(b) The RMS voltage with the DVR connected and operating. 48
4.4(c) The RMS voltage with the D-STATCOM connected and operating. 48
4.5(a) Voltage Sag at the Phase A terminal to the motor. 49
4.5(b) The Phase A voltage with the DVR connected. 50
4.5(c) The Phase A voltage with the D-STATCOM connected. 50
4.6(a) RMS voltage at the motor point, without any mitigation device. 51
4.6(b) The RMS voltage with the DVR connected and operating. 51
4.6(c) The RMS voltage with the D-STATCOM connected and operating. 52
4.7(a) Phase A voltage without the DVR in connection. 53
4.7(b) Phase A voltage with the DVR operating. 53
4.8(a) RMS Voltage Drop 54
4.8(b) RMS voltage with the DVR operating. 54
4.9 Phase voltage supplied by the DVR 55
4.10(a) Phase A voltage without the D-STATCOM. 56
4.10(b) Phase A voltage the D-STATCOM operating. 56
4.11(a) RMS voltage drop 57
4.11(b) RMS voltage with the D-STATCOM operating 57
4.12(a) Phase A voltage without any mitigation device. 58
4.12(b) Phase A voltage with the DVR operating 58
4.12(c) Phase A voltage with the D-STATCOM operating. 59
4.13(a) RMS voltage without any mitigation device 59
xvii
4.13(c) RMS voltage with the D-STATCOM operating. 60
4.14(a) Phase A voltage without any mitigation device. 61
4.14(b) Phase A voltage with the DVR operating. 61
4.14(c) Phase A voltage with the D-STATCOM in operation. 62
4.15(a) Phase B voltage without any mitigation device 62
4.15(b) Phase B voltage with the DVR in operation 63
4.15(c) Phase B voltage with the D-STATCOM in operation 63
4.16(a) RMS voltage without any mitigation device 64
4.16(b) RMS voltage with the DVR in operation 64
4.16(c) RMS voltage with the D-STATCOM in operation 65
4.17(a) Voltage Interruption 65
4.17(b) Phase A voltage with the DVR in operation 66
4.17(c) Phase A voltage with the D-STATCOM in operation 66
4.18(a) Phase B voltage 67
4.18(b) Phase B voltage with the DVR in operation 67
4.18(c) Phase B voltage with the D-STATCOM in operation 68
4.19(a) Phase C voltage 68
4.19(b) Phase C voltage with the DVR in operation 69
4.19(c) Phase C voltage with the D-STATCOM in operation 69
4.20(a) RMS voltage without any mitigation device 70
4.20(b) RMS voltage with the DVR in operation 70
4.20(c) RMS voltage with the D-STATCOM in operation 70
4.21(a) Phase A voltage without the DVR 72
4.21(b) Phase A voltage with the DVR in operation 73
4.22(a) Phase B voltage without the DVR 73
4.22(b) Phase B voltage with the DVR in operation 74
4.23(a) RMS voltage 74
4.23(b) RMS voltage with the DVR in operation 75
4.24(a) Phase A voltage without the D-STATCOM 75
4.24(b) Phase A voltage with the D-STATCOM in operation 76
4.25(a) Phase B voltage without the D-STATCOM 76
4.25(b) Phase B voltage with the D-STATCOM in operation 77
4.26(a) RMS voltage without the D-STATCOM 77
4.27(a) Phase A voltage without any mitigation device 78
4.27(b) Phase A voltage with the DVR in operation 79
4.27(c) Phase A voltage with the D-STATCOM in operation 79
4.28(a) Phase B voltage without any mitigation device 80
4.28(b) Phase B voltage with the DVR in operation 81
4.28(c) Phase B voltage with the D-STATCOM in operation 81
4.29(a) RMS voltage without any mitigation device 82
4.29(b) RMS voltage with the DVR in operation 82
4.29(c) RMS voltage with the D-STATCOM in operation 83
4.30(a) Phase A voltage, without any mitigation device 83
4.30(b) Phase A voltage with the DVR in operation 84
4.30(c) Phase A voltage with the D-STATCOM in operation 84
4.31(a) Phase B voltage, without any mitigation device 85
4.31(b) Phase B voltage with the DVR in operation 85
4.31(c) Phase B voltage with the D-STATCOM in operation 86
4.32(a) Phase C voltage ,without any mitigation device 86
4.32(b) Phase C voltage with the DVR in operation 87
4.32(c) Phase C voltage with the D-STATCOM in operation 87
4.33(a) RMS voltage, without any mitigation device 88
4.33(b) RMS voltage with the DVR in operation 89
4.33(c) RMS voltage with the D-STATCOM in operation 89
4.34(a) Phase A voltage ,without any mitigation device 90
4.34(b) Phase A voltage with the DVR in operation 91
4.34(c) Phase A voltage with the D-STATCOM in operation 91
4.35(a) Phase B voltage without any mitigation device 92
4.35(b) Phase B voltage with the DVR in operation 92
4.35(c) Phase B voltage with the D-STATCOM in operation 93
4.36(a) Phase C voltage without any mitigation device 93
4.36(b) Phase C voltage with the DVR in operation 94
4.36(c) Phase C voltage with the D-STATCOM in operation 95
4.37(a) RMS voltage, without any mitigation device 95
4.37(b) RMS voltage with the DVR in operation 96
xix
LIST OF SYMBOLS AND ABBREVIATIONS
A - Ampere
AC - Alternating Current D.O.L - Direct-On-Line
EMTDC - Electromagnetic Transient Programme with DC Analysis Hp/hp - Horsepower
IM - Induction Motor
PSCAD - Power System Computer Aided Design Pu - per unit
RMS - Root Mean Square kV - kilovolt
LIST OF APPENDICES
1
CHAPTER 1
INTRODUCTION
1.1 Project Background
Both electric utilities and end users of electrical power are becoming increasingly concerned about the quality of electric power. The term power quality has become one of the most prolific buzzword in the power industry[18] . The issue in electricity power sector delivery is not confined to only energy efficiency and environment but more importantly on quality and continuity of supply or power quality and supply quality. Electrical Power quality is the degree of any deviation from the nominal values of the voltage magnitude and frequency. Power quality may also be defined as the degree to which both the utilization and delivery of electric power affects the performance of electrical equipment[2] . From a customer perspective, a power quality problem is defined as any power problem manifested in voltage, current, or frequency deviations that result in power failure or disoperation of customer of equipment. Power quality is certainly a major concern in the present era; it becomes especially important with the introduction of sophisticated devices, whose performance is very sensitive to the quality of power supply.[4].
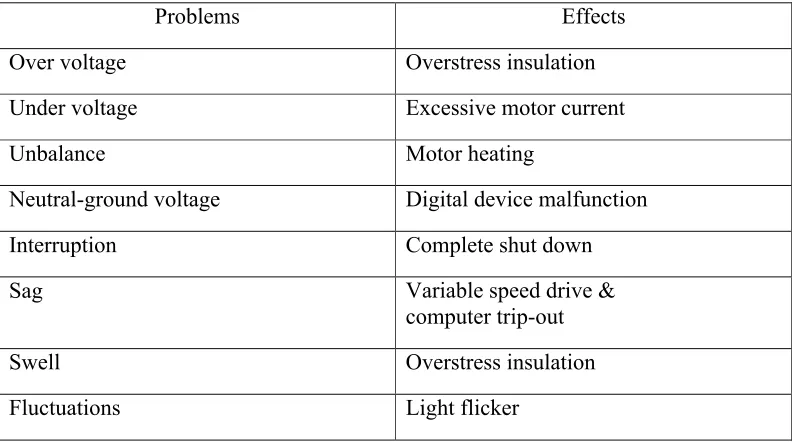
Below is a table showing some common power quality problems and their effects:
Problems Effects
Over voltage Overstress insulation
Under voltage Excessive motor current
Unbalance Motor heating
Neutral-ground voltage Digital device malfunction
Interruption Complete shut down
Sag Variable speed drive &
computer trip-out
Swell Overstress insulation
[image:18.612.128.524.136.357.2]Fluctuations Light flicker
Table 1.0: Some effects of power quality problems for the voltage events.
Among them, two power quality problems have been identified to be of major concern to the customers are voltage sags and swells, but this project will be focusing on voltage sags/swells, as well as interruptions.
Voltage dips are considered one of the most severe disturbances to the industrial equipment. A paper machine can be affected by disturbances of 10% voltage drop lasting for 100ms. A voltage dip of 75% (of the nominal voltage) with duration shorter than 100ms can result in material loss in the range of thousands of US dollars for the semiconductors industry. Swells and over voltages can cause over heating tripping or even destruction of industrial
3
1.2 Objectives
The aim of this project is to study the various types of power quality problems and their effects on both the utility and customer’s side of the system, with more emphasis on these two namely: voltage sag and voltage swells, and how they can be mitigated with the use of the DVR (Dynamic Voltage Restorer) and the D-STATCOM (Distribution Static Compensator),which are also called custom power devices,and its effectiveness in mitigating the named power quality problems given above.
The objectives of this project are:
i. To investigate that the mitigation techniques are suitable for voltage sags,swells and interruptions in the event of a fault in a distribution system. ii. To observe the effect on the characteristic of voltage sag, swell and
interruption for the techniques.
iii. To suggest on the suitability of the techniques used for the mitigation process.
1.3 Background of study
equipment such as motor drives. Electronic equipments are very sensitive loads against harmonics because their control depends on either the peak value or the zero crossing of the supplied voltage, which are all influenced by the harmonic distortion. This project analyzes the key issues in the power quality problems. As one of the prominent power quality problems, the origin, consequences and mitigation techniques of voltage sag/swells and interruptions problem will be discussed in detail. The study describes the techniques of correcting the problems in a distribution system by a strong power electronics based devices called Dynamic Voltage Restorer (DVR) and the Distribution Static Compensator (D-STATCOM). Voltage from both devices is connected into the system to correct the problems.The performance of the DVR and the D-STATCOM is studied for the power quality problems to be viewed.
1.4 Problem Statements
With the increased use of sophisticated electronics, high efficiency variable speed drive, and power electronic controller, power quality has become an increasing concern to utilities and customers. Voltage sags is the most common type of power quality disturbance in the distribution system. It can be caused by fault in the electrical network or by the starting of a large induction motor. Although the electric utilities have made a substantial amount of investment to improve the reliability of the network, they cannot control the external factor that causes the fault, such as lightning or accumulation of salt at a transmission tower located near to sea.
5
1.5 Scope of Study
The scope of study tends to look at the following, I. Investigate the mentioned power quality problems,
II. How they can be mitigated with the custom power device introduced.
CHAPTER 2
LITERATURE REVIEW
2.1 Power Quality
7
One of the most common power quality problems today is voltage dips. A voltage dip is a short time (10 ms to 1 minute) event during which a reduction in r.m.s voltage magnitude occurs. It is often set only by two parameters, depth/magnitude and duration. The voltage dip magnitude is ranged from 10% to 90% of nominal voltage (which corresponds to 90% to 10% remaining voltage) and with a duration from half a cycle to 1 min. In a three-phase system a voltage dip is by nature a three-phase phenomenon, which affects both the to-ground and phase-to-phase voltages. A voltage dip is caused by a fault in the utility system, a fault within the customer’s facility or a large increase of the load current, like starting a motor or transformer energizing. Typical faults are single-phase or multiple-phase short circuits, which leads to high currents. The high current results in a voltage drop over the network impedance. At the fault location the voltage in the faulted phases drops close to zero, whereas in the non-faulted phases it remains more or less unchanged [1, 2].
2.2 Voltage Dips (Sags)
A voltage dip is a sudden reduction in the r.m.s voltage between 0.1 and 0.9 pu at a point in the electrical system,and lasting for 0.5 cycle to several seconds. Dips with durations of less than a cycle are regarded as transients. Figure 2.1 shows a waveform depicting a voltage sag.
Figure 2.1: Voltage dip (sag) waveform
A voltage dip may be caused by switching operations associated with a temporary disconnection of supply, the flow of heavy current associated with the starting of a large electric motors or the flow of fault currents or the transfer of load from one power source to another. These events may emanate from customers’ systems or from the public suply network. The main cause of momentary voltage dips is probably the ligthning strike. Each of these cases may cause a sag with a special characteristics (magnitude and duration).
The possible effects of voltage sags are: Extinction of discharge lamps
9
Computer system crash Tripping of contactors.
2.3 Voltage swell
The increase of voltage magnitudes between 1.1 and 1.8pu is called Swell,it sometimes accompany voltage sags.The most accepted duration of a swell is from 0.5 cycles to 1 minute. They appear on the switching off of a large load; energizing a capacitor bank ; or voltage increase of the unfaulted phases during a single line-to-ground fault. Figure 2.2 shows a waveform of voltage swell.
Figure 2.2: Voltage swell waveform
2.4 Interruptions
Interruptions occurs when the supply voltage decreases to less than 0.1 pu for a minute or less. Some causes of interruptions are equipment failures, control malfunction, and blown fuse or breaker opening due to fault on a system.
2.5 Voltage Source Converters (VSC)
A voltage-source converter is a power electronic device, which can generate a sinusoidal voltage with any required magnitude, frequency and phase angle. Voltage source converters are widely used in adjustable-speed drives, but can also be used to mitigate voltage dips. The VSC is used to either completely replace the voltage or to inject the ‘missing voltage’. The ‘missing voltage’ is the difference between the nominal voltage and the actual. The converter is normally based on some kind of energy storage, which will supply the converter with a DC voltage. The solid-state electronics in the converter is then switched to get the desired output voltage. Normally the VSC is not only used for voltage dip mitigation, but also for other power quality issues, e.g. flicker and harmonics.
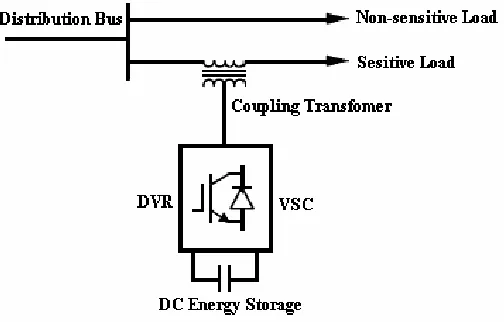
2.6 Dynamic Voltage Restorer (DVR)
11
specification for sensitive load equipment.It is designed to mitigate voltage sags and swells on lines feeding sensitive equipment.
A viable alternative to uninterruptible power systems (UPS) and other utilization solutions to the voltage sag problem, the DVR is specially designed for large loads of the order of 2 MVA to 10 MVA served at distribution voltage. A DVR typically requires less than one-third the nominal power rating of the UPS . DVR can also be used to mitigate troublesome harmonic voltages on the distribution network.
DVR comprises of three main parts: 1. Inverter
2. DC energy storage 3. Control system
[image:27.612.233.485.409.570.2]The basic configuration of a DVR is shown in Figure 2.3 below;
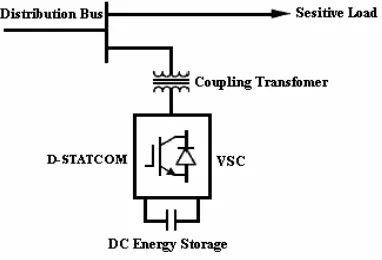
2.7 Distribution Static Compensator (D-STATCOM)
A D-STATCOM (Distribution Static Compensator), which is schematically depicted in Figure, consists of a two-level Voltage Source Converter (VSC), a dc energy storage device, a coupling transformer connected in shunt to the distribution network through a coupling transformer. The VSC converts the dc voltage across the storage device into a set of three-phase ac output voltages. These voltages are in phase and coupled with the ac system through the reactance of the coupling transformer. Suitable adjustment of the phase and magnitude of the D-STATCOM output voltages allows effective control of active and reactive power exchanges between the D-STATCOM and the ac system. Such configuration allows the device to absorb or generate controllable active and reactive power.
The VSC connected in shunt with the ac system provides a multifunctional topology which can be used for up to three quite distinct purposes:
1. Voltage regulation and compensation of reactive power; 2. Correction of power factor; and
3. Elimination of current harmonics.
[image:28.612.233.424.526.656.2]Here, such device is employed to provide continuous voltage regulation using an indirectly controlled converter. The basic configuration of the D-STATCOM is shown in the diagram below,Figure 2.4;
13
2.8 Previous Research
Byung-Moon Han, Bo-Hyung Cho, Seung-Ki Sul and Jae-Eon Kim (2006) developed a configuration for the Unified Power Quality Conditioner,which has a DC/DC converter with super-capacitors for energy storage. The proposed UPQC cancompensate the reactive power, harmonic current, voltage sag and swell, voltage imbalance, and voltage interruption. . The proposed UPQC has ultimate capability to improve the power quality at the point of installation on power distribution systems and industrial power systems.
Active power filters can perform one or more of the functions required to compensate power systems and improving power quality. Their performance also depends on the power rating and the speed of response. Many mitigation techniques have been proposed and implemented to maintain the voltage and current within recommended levels.
15
CHAPTER 3
METHODOLOGY
3.1 Overview of Project Methodology
This project intends to investigate mitigation technique that is suitable for the voltage sags /swells source with different type of loads/systems, with the occurance of a fault. The simulation will be carried out using PSCAD/EMTDC software. The mitigation techniques that will be studied are the dynamic voltage restorer (DVR) and distribution static compensator (D-STATCOM).
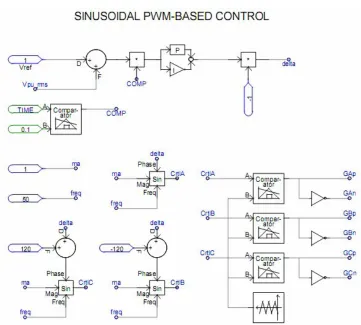
3.2 Sinusoidal PWM-Based Control
relatively low-power application, PWM methods offer a more flexible option than the fundamental frequency switching (FFS) methods favored in FACTS applications. Besides, high switching frequencies can be used to improve the efficiency of the converter, without incurring significant switching losses. Figure 3.1 shows the D-STATCOM controller scheme implemented in PSCAD/EMTDC. The D-D-STATCOM control system exerts voltage angle control as follows: an error signal is obtained by comparing the reference voltage with the rms voltage measured at the load point. The PI controller processes the error signal and generates the required angle δ to drive the error to zero, for example, the load rms voltage is brought back to the reference voltage. In the PWM generators, the sinusoidal signal, Vcontrol, is phase modulated by means of the angle δ or delta as nominated in the Figure 3.1. The modulated signal, Vcontrol, is compared against a triangular signal (carrier) in order to generate the switching signals of the VSC valves.
17
The main parameters of the sinusoidal PWM scheme are the amplitude modulation index, ma, of signal vcontrol, and the frequency modulation index, mf, of the triangular signal. The vcontrol in the Figure 3.1 are nominated as CtrlA, CtrlB and CtrlC. The amplitude index ma is kept fixed at 1 pu, in order to obtain the highest fundamental voltage component at the controller output [13, 18]. The switching frequency mf is set at 450 Hz, mf = 9. It should be noted that, an assumption of balanced network and operating conditions are made. The modulating angle δ or delta is applied to the PWM generators in phase A, whereas the angles for phase B and C are shifted by 240° or -120° and 120° respectively. It can be seen in Figure 3.1 that the control implementation is kept very simple by using only voltage measurements as feedback variable in the control scheme. The speed of response and robustness of the control scheme are clearly shown in the test results.
3.3 Test System
In this project, various test systems were used to carry out the aforementioned mitigation techniques, implemented using the PSCAD/EMTDC software. The test system comprises of Test System A, to carry out simulations for the DVR, which comprises of a 13 kilovolts, 50 Hertz transmission system, feeding into a 3- phase, 3 winding transformer at the primary side, which is stepped up to 115 kilovolts. The secondary side supplies the primary side of 3- phase, 2 winding transformer, which supplies 11 kilovolts to the load.
Also, in order to prove that the effectiveness is more on the mitigation devices, it was also implemented or tested on another sets of systems designed based on motor starting methods comprising of Direct- On- Line, Star-Delta and Autotransformer Starting methods which were designed with the aid of the PSCAD/EMTDC software. Also all were carried out with various faults applied to the system to generate the voltage sags/swells and interruption.
3.4 Theory on Motor Starting Circuits
During motor starting, they occurs an increase in the current level up to approximately six to ten times that of the rated current and the high starting torque is caused by this. The high starting currents often lead to unwelcome voltage surges in the supply network and the high starting torque put the mechanical elements under considerable strain. Therefore, it is imperative to determine the limiting values for the motor starting currents in relation to the rated operational currents. The permissible values vary from network to network and depend on its load-bearing capacity. With regard to mechanics, methods are required which reduce starting torque. Various starters and methods can be used to reduce currents and torque:
a) Direct-On-Line Starting b) Star-Delta Starting c) Auto-transformer Starting
3.4.1 Direct-On-Line (DOL) Starting
19
behaves like a transformer with its secondary side formed by the very low resistance rotor cage, in short circuit. There is a high induced current in the rotor which results in a current peak in the main supply, where the starting current is about 5 to 8 times higher than that rated current. In spite of its advantages (simple equipment, high starting torque, fast start, low cost), Direct-On-Line starting is only suitable when the power of the motor is low compared to that of the mains, which limits interference from inrush current, and the machine to drive, does not need to speed up gradually or has a dampiing device to limit the shock of starting. The starting torque can be high without affecting machine operation or the load that is driven. Figure 3.2 shos the Direct-On-Line circuit connection, where the stator is connected directly to the mains supply.
Figure 3.2: Direct-On-Line Circuit Connection
3.4.2 Star-Delta Starting
the three windings available individually. At start, the line voltage is applied to one end of each of the windings in a star connection. Under this connection, the voltage across each winding is 1/√3 of the line voltage and so the current flowing in each
winding is also reduced by this amount. The resultant current flowing from the supply is reduced by a factor of 1/3 as is the torque. In some cases, this may be enough to get the motor up to full speed, but most, as this is a constant voltage starter, the transition to full voltage will occur at part speed resulting in a virtual DOL type start. To step to full voltage, the star connection is opened, effectively open circuiting the motor, and the ends of the windings are then connected to the three phase supply in a fashion to create a delta connection. This type of starter is an open transition starter and so the switch to delta is accompanied by a very high torque and current transient. In most situations, there would be less damage to the equipment and less interference to the supply if a DOL starter was used. Figure 3.3 shows the Star-Delta connection circuit.
21
3.4.3 Autotransformer Starting
Figure 3.4: Autotransformer Connection for the Motor Starting
3.5 Dynamic Voltage Restorer
23
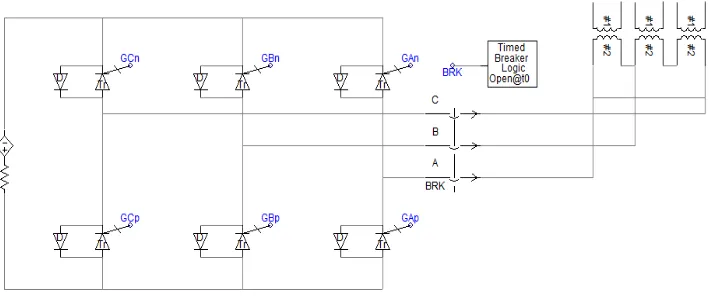
Figure 3.5: Diagram of the DVR designed using the PSCAD/EMTDC.
3.6 Distribution Static Compensator
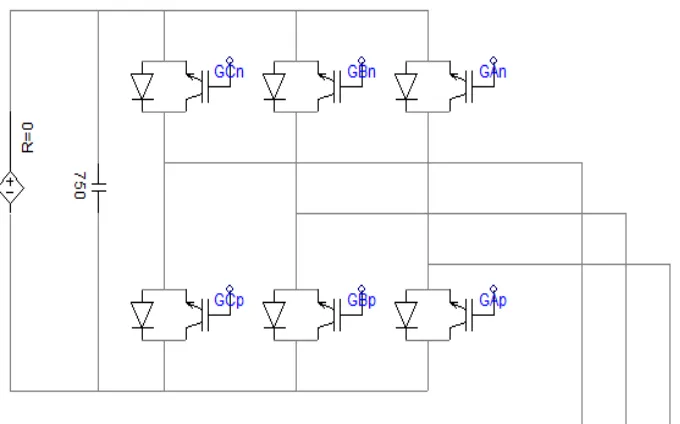
The test system employed to carry out the simulations concerning the D-STATCOM actuation is shown in Figure 3.8 (a & b). A two-level D-D-STATCOM is connected to the 11 kV tertiary winding to provide instantaneous voltage support at
the load point. A 750 μF capacitor on the dc sideprovides the D-STATCOM energy
Figure 3.6: Diagram of the D-STATCOM designed using the PSCAD/EMTDC.
3.7 Test Cases
Below are the diagrams of the test to be implemented using the PSCAD/EMTDC software as stated in 3.3
3.7.1 Test System A
100
REFERENCES
1. H. Hingorani,(1995). “Introducing custom power” IEEE spectrum, vol.32 no.6, p 41-48.
2. M. H. J. Bollen,(2000) “Understanding Power Quality Problems—Voltage Sags and Interruptions” Piscataway, New York: IEEE Press.
3. M.Madrigal, E.Acha,(2000), “Modelling of Custom Power Equipment Using Harmonic Domain Techniques”, IEEE.
4. Ewald F.F, Mohammad A.S.M, (2008), Power Quality in Power Systems and Electrical Machines, Burlington,USA, Elsevier Academic Press.
5. Ray Arnold, (2001), “Solutions to Power Quality Problems” power engineering journal 2001 pages: 65-73.
6. John Stones and Alan Collinsion, (2001), “Introduction to Power Quality” power engineering journal , pages: 58 -64.
7. E. Acha, V. G. Agelidis, O. Anaya-Lara, and T. J. E. Miller,(2001), ‘Electronic Control in Electrical Power Systems,” London, U.K., Butterworth-Heinemann.
8. Gregory F. Reed, Masatoshi Takeda, (1998), "Improved power quality solutions using advanced solid-state switching and static compensation technologies," Power Engineering Society , Winter Meeting, IEEE.
Optimal Time-Frequency representation," Part 2: Application, IEEE Transactions on Power Delivery, vol. 18, pp. 544-549, 2003.
10. Flores, R.A, “State of the Art in the Classification of Power Quality Events, An Overview”. Harmonics and Quality of Power, 2002, 10th International Conference on Volume 1, issue, 6-9, pp. 17-20, Oct. 2002.
11. David Hart, David Uy, Damir Novosel, Steven Kunsman, Carl LaPlace and Marco Tellarini, “Improving Power Quality”, ABB Review, 4/2000.
12. Adly Girgis, Bi Chang and Elham Makram, “A Digital Recursive Measurement for On Line Tracking of Power Systems Harmonics”, IEEE transactions on Power Delivery, Vol. 6, No.3 July 1991.
13. V.K. Ramachandaramurthy, A. Arulampalam, C.Fitzer, C. Zhan, M. Barnes and N.Jenkins,(2002),“Supervisory control of dynamic voltage restorers “IEE Proc.-Gener.Transm. Distrib. Vol. 151, No. 4, pp. 509-516.
14. Chris Fitzer, Mike Barnes, Peter Green,(2004), “ Voltage Sag Detection Technique for a Dynamic Voltage Restore’’, IEEE Transactions on Power Delivery, Vol. 40,No. 1,pp. 203-212.
15. Il-Yop Chung, Dong-Jun Won, Sang-Young Park,Seung-Il Moon, Jong-Keun Park “The DC link energy control method in dynamic voltage restorersystem” Electrical Power and Energy Systems.
16. Pohjanheimo, P. and E. Lakervi,( 2000). Steady state modeling of custom power components in power distribution networks. In: IEEE Power Engineering
Society Winter Meeting, pp: 2949-2954.
102
18. Roger C. Dugan/Mark F. McGranaghan, etc,(2002),Electrical Power Systems Quality, McGraw-Hill,Professional Engineering.
19. Douglas S. Dorr,(1995) “Point of Utilization Power Quality Study Results”, IEEE Transactions on Industry Applications, Vol. 31, No. 4.
20. Bollen, M.H.J.,(2001)” Voltage sags in three-phase systems” Power Engineering Review, IEEE, Vol. 21, Issue: pp: 8 - 11, 15.
21. M.S. Looi, H.H. Goh, and B.C. Kok, ‘‘Comparison betweem Direct-On-Line, Star-Delta and Autotransformer Induction Motor Starting Methods in terms of Power Quality, ’’ in IMECS, 2009, paper ICEE_56, p.1558.